0001520358
false
Q2
--01-31
2024
0001520358
2023-02-01
2023-07-31
0001520358
2023-09-11
0001520358
2023-07-31
0001520358
2023-01-31
0001520358
us-gaap:RelatedPartyMember
2023-07-31
0001520358
us-gaap:RelatedPartyMember
2023-01-31
0001520358
us-gaap:SeriesAPreferredStockMember
2023-07-31
0001520358
us-gaap:SeriesAPreferredStockMember
2023-01-31
0001520358
us-gaap:SeriesBPreferredStockMember
2023-07-31
0001520358
us-gaap:SeriesBPreferredStockMember
2023-01-31
0001520358
2023-05-01
2023-07-31
0001520358
2022-05-01
2022-07-31
0001520358
2022-02-01
2022-07-31
0001520358
us-gaap:PreferredStockMember
us-gaap:SeriesAPreferredStockMember
2023-04-30
0001520358
us-gaap:PreferredStockMember
us-gaap:SeriesBPreferredStockMember
2023-04-30
0001520358
us-gaap:CommonStockMember
2023-04-30
0001520358
us-gaap:TreasuryStockCommonMember
2023-04-30
0001520358
us-gaap:AdditionalPaidInCapitalMember
2023-04-30
0001520358
us-gaap:RetainedEarningsMember
2023-04-30
0001520358
2023-04-30
0001520358
us-gaap:PreferredStockMember
us-gaap:SeriesAPreferredStockMember
2022-04-30
0001520358
us-gaap:CommonStockMember
2022-04-30
0001520358
us-gaap:TreasuryStockCommonMember
2022-04-30
0001520358
us-gaap:AdditionalPaidInCapitalMember
2022-04-30
0001520358
us-gaap:RetainedEarningsMember
2022-04-30
0001520358
2022-04-30
0001520358
us-gaap:PreferredStockMember
us-gaap:SeriesAPreferredStockMember
2023-01-31
0001520358
us-gaap:PreferredStockMember
us-gaap:SeriesBPreferredStockMember
2023-01-31
0001520358
us-gaap:CommonStockMember
2023-01-31
0001520358
us-gaap:TreasuryStockCommonMember
2023-01-31
0001520358
us-gaap:AdditionalPaidInCapitalMember
2023-01-31
0001520358
us-gaap:RetainedEarningsMember
2023-01-31
0001520358
us-gaap:PreferredStockMember
us-gaap:SeriesAPreferredStockMember
2022-01-31
0001520358
us-gaap:CommonStockMember
2022-01-31
0001520358
us-gaap:TreasuryStockCommonMember
2022-01-31
0001520358
us-gaap:AdditionalPaidInCapitalMember
2022-01-31
0001520358
us-gaap:RetainedEarningsMember
2022-01-31
0001520358
2022-01-31
0001520358
us-gaap:PreferredStockMember
us-gaap:SeriesAPreferredStockMember
2023-05-01
2023-07-31
0001520358
us-gaap:PreferredStockMember
us-gaap:SeriesBPreferredStockMember
2023-05-01
2023-07-31
0001520358
us-gaap:CommonStockMember
2023-05-01
2023-07-31
0001520358
us-gaap:TreasuryStockCommonMember
2023-05-01
2023-07-31
0001520358
us-gaap:AdditionalPaidInCapitalMember
2023-05-01
2023-07-31
0001520358
us-gaap:RetainedEarningsMember
2023-05-01
2023-07-31
0001520358
us-gaap:PreferredStockMember
us-gaap:SeriesAPreferredStockMember
2022-05-01
2022-07-31
0001520358
us-gaap:CommonStockMember
2022-05-01
2022-07-31
0001520358
us-gaap:TreasuryStockCommonMember
2022-05-01
2022-07-31
0001520358
us-gaap:AdditionalPaidInCapitalMember
2022-05-01
2022-07-31
0001520358
us-gaap:RetainedEarningsMember
2022-05-01
2022-07-31
0001520358
us-gaap:PreferredStockMember
us-gaap:SeriesAPreferredStockMember
2023-02-01
2023-07-31
0001520358
us-gaap:PreferredStockMember
us-gaap:SeriesBPreferredStockMember
2023-02-01
2023-07-31
0001520358
us-gaap:CommonStockMember
2023-02-01
2023-07-31
0001520358
us-gaap:TreasuryStockCommonMember
2023-02-01
2023-07-31
0001520358
us-gaap:AdditionalPaidInCapitalMember
2023-02-01
2023-07-31
0001520358
us-gaap:RetainedEarningsMember
2023-02-01
2023-07-31
0001520358
us-gaap:PreferredStockMember
us-gaap:SeriesAPreferredStockMember
2022-02-01
2022-07-31
0001520358
us-gaap:CommonStockMember
2022-02-01
2022-07-31
0001520358
us-gaap:TreasuryStockCommonMember
2022-02-01
2022-07-31
0001520358
us-gaap:AdditionalPaidInCapitalMember
2022-02-01
2022-07-31
0001520358
us-gaap:RetainedEarningsMember
2022-02-01
2022-07-31
0001520358
us-gaap:PreferredStockMember
us-gaap:SeriesAPreferredStockMember
2023-07-31
0001520358
us-gaap:PreferredStockMember
us-gaap:SeriesBPreferredStockMember
2023-07-31
0001520358
us-gaap:CommonStockMember
2023-07-31
0001520358
us-gaap:TreasuryStockCommonMember
2023-07-31
0001520358
us-gaap:AdditionalPaidInCapitalMember
2023-07-31
0001520358
us-gaap:RetainedEarningsMember
2023-07-31
0001520358
us-gaap:PreferredStockMember
us-gaap:SeriesAPreferredStockMember
2022-07-31
0001520358
us-gaap:CommonStockMember
2022-07-31
0001520358
us-gaap:TreasuryStockCommonMember
2022-07-31
0001520358
us-gaap:AdditionalPaidInCapitalMember
2022-07-31
0001520358
us-gaap:RetainedEarningsMember
2022-07-31
0001520358
2022-07-31
0001520358
MAMA:ChefInspirationalFoodsIncMember
2022-06-28
0001520358
MAMA:ChefInspirationalFoodsIncMember
2022-06-28
2022-06-28
0001520358
MAMA:ChefInspirationalFoodsIncMember
MAMA:TwoYearFromAcquisitionDateMember
2022-06-28
0001520358
MAMA:ChefInspirationalFoodsIncMember
MAMA:TwoYearFromAcquisitionDateMember
2022-06-28
2022-06-28
0001520358
MAMA:ChefInspirationalFoodsIncMember
MAMA:FirstAnniversaryMember
2022-06-28
2022-06-28
0001520358
MAMA:ChefInspirationalFoodsIncMember
MAMA:SecondAnniversaryMember
2022-06-28
2022-06-28
0001520358
MAMA:ChefInspirationalFoodsIncMember
2023-02-01
2023-06-28
0001520358
us-gaap:EmployeeStockOptionMember
2023-05-01
2023-07-31
0001520358
us-gaap:EmployeeStockOptionMember
2022-05-01
2022-07-31
0001520358
us-gaap:EmployeeStockOptionMember
2023-02-01
2023-07-31
0001520358
us-gaap:EmployeeStockOptionMember
2022-02-01
2022-07-31
0001520358
MAMA:EmployeesMember
2023-05-01
2023-07-31
0001520358
MAMA:EmployeesMember
2023-02-01
2023-07-31
0001520358
srt:MinimumMember
us-gaap:MachineryAndEquipmentMember
2023-07-31
0001520358
srt:MaximumMember
us-gaap:MachineryAndEquipmentMember
2023-07-31
0001520358
us-gaap:FurnitureAndFixturesMember
srt:MinimumMember
2023-07-31
0001520358
us-gaap:FurnitureAndFixturesMember
srt:MaximumMember
2023-07-31
0001520358
us-gaap:LeaseholdImprovementsMember
2023-07-31
0001520358
us-gaap:TrademarksAndTradeNamesMember
2023-07-31
0001520358
us-gaap:CustomerRelationshipsMember
srt:MinimumMember
2023-07-31
0001520358
us-gaap:CustomerRelationshipsMember
srt:MaximumMember
2023-07-31
0001520358
MAMA:NortheastMember
2023-05-01
2023-07-31
0001520358
MAMA:NortheastMember
2022-05-01
2022-07-31
0001520358
MAMA:SoutheastMember
2023-05-01
2023-07-31
0001520358
MAMA:SoutheastMember
2022-05-01
2022-07-31
0001520358
MAMA:MidwestMember
2023-05-01
2023-07-31
0001520358
MAMA:MidwestMember
2022-05-01
2022-07-31
0001520358
MAMA:WestMember
2023-05-01
2023-07-31
0001520358
MAMA:WestMember
2022-05-01
2022-07-31
0001520358
MAMA:SouthwestMember
2023-05-01
2023-07-31
0001520358
MAMA:SouthwestMember
2022-05-01
2022-07-31
0001520358
MAMA:NortheastMember
2023-02-01
2023-07-31
0001520358
MAMA:NortheastMember
2022-02-01
2022-07-31
0001520358
MAMA:SoutheastMember
2023-02-01
2023-07-31
0001520358
MAMA:SoutheastMember
2022-02-01
2022-07-31
0001520358
MAMA:MidwestMember
2023-02-01
2023-07-31
0001520358
MAMA:MidwestMember
2022-02-01
2022-07-31
0001520358
MAMA:WestMember
2023-02-01
2023-07-31
0001520358
MAMA:WestMember
2022-02-01
2022-07-31
0001520358
MAMA:SouthwestMember
2023-02-01
2023-07-31
0001520358
MAMA:SouthwestMember
2022-02-01
2022-07-31
0001520358
MAMA:CifAcquisitionMember
2023-06-28
2023-06-28
0001520358
MAMA:CifAcquisitionMember
2023-06-28
0001520358
MAMA:SoftwareMember
2023-07-31
0001520358
us-gaap:CustomerRelationshipsMember
2023-07-31
0001520358
MAMA:SoftwareMember
2023-01-31
0001520358
us-gaap:CustomerRelationshipsMember
2023-01-31
0001520358
us-gaap:TrademarksAndTradeNamesMember
2023-01-31
0001520358
MAMA:PromissoryNoteMember
2021-12-29
0001520358
MAMA:PromissoryNoteMember
us-gaap:RelatedPartyMember
2023-07-31
0001520358
MAMA:PromissoryNoteMember
us-gaap:RelatedPartyMember
2023-01-31
0001520358
MAMA:PromissoryNoteMember
2023-05-01
2023-07-31
0001520358
MAMA:PromissoryNoteMember
2023-02-01
2023-07-31
0001520358
MAMA:PromissoryNoteMember
2022-05-01
2022-07-31
0001520358
MAMA:PromissoryNoteMember
2022-02-01
2022-07-31
0001520358
MAMA:PromissoryNoteMember
2023-07-31
0001520358
MAMA:PromissoryNoteMember
2023-01-31
0001520358
MAMA:PromissoryNoteMember
MAMA:FirstAnniversaryMember
2023-02-01
2023-07-31
0001520358
MAMA:FarmingdalMember
2023-02-01
2023-07-31
0001520358
MAMA:FarmingdalMember
MAMA:DecemberThirtyOneTwoThousandTwentySixMember
2023-02-01
2023-07-31
0001520358
MAMA:FarmingdalMember
MAMA:EndOfInitialLeaseTermMember
2023-02-01
2023-07-31
0001520358
MAMA:FarmingdalMember
2023-05-01
2023-07-31
0001520358
MAMA:FarmingdalMember
2022-05-01
2022-07-31
0001520358
MAMA:FarmingdalMember
2022-02-01
2022-07-31
0001520358
us-gaap:RelatedPartyMember
MAMA:ChefInspirationalFoodsIncMember
2023-05-01
2023-06-28
0001520358
us-gaap:RelatedPartyMember
MAMA:ChefInspirationalFoodsIncMember
2023-02-01
2023-06-28
0001520358
MAMA:ChefInspirationalFoodsIncMember
us-gaap:RelatedPartyMember
2023-01-31
0001520358
MAMA:MAndTBankMember
2023-07-31
0001520358
MAMA:MAndTBankMember
2023-07-18
2023-07-18
0001520358
MAMA:MAndTBankMember
MAMA:MultipleDisbursementTermLoanMember
2023-02-01
2023-07-31
0001520358
MAMA:MAndTBankMember
2023-02-01
2023-07-31
0001520358
MAMA:MAndTBankMember
2023-01-31
0001520358
MAMA:MAndTBankMember
2023-05-01
2023-07-31
0001520358
MAMA:MAndTBankMember
2022-05-01
2022-07-31
0001520358
MAMA:MAndTBankMember
2022-02-01
2022-07-31
0001520358
MAMA:MAndTBankMember
MAMA:MultipleDisbursementTermLoanMember
2021-12-29
0001520358
MAMA:MAndTBankMember
MAMA:MultipleDisbursementTermLoanMember
2021-12-28
2021-12-29
0001520358
MAMA:MAndTBankMember
MAMA:MultipleDisbursementTermLoanMember
2023-07-31
0001520358
MAMA:MAndTBankMember
MAMA:MultipleDisbursementTermLoanMember
2023-01-31
0001520358
MAMA:MAndTBankMember
MAMA:MultipleDisbursementTermLoanMember
2023-05-01
2023-07-31
0001520358
MAMA:MAndTBankMember
MAMA:MultipleDisbursementTermLoanMember
2022-05-01
2022-07-31
0001520358
MAMA:MAndTBankMember
MAMA:MultipleDisbursementTermLoanMember
2022-02-01
2022-07-31
0001520358
MAMA:CustomerOneMember
us-gaap:SalesRevenueNetMember
us-gaap:CustomerConcentrationRiskMember
2023-02-01
2023-07-31
0001520358
MAMA:CustomerTwoMember
us-gaap:SalesRevenueNetMember
us-gaap:CustomerConcentrationRiskMember
2023-02-01
2023-07-31
0001520358
MAMA:CustomerThreeMember
us-gaap:SalesRevenueNetMember
us-gaap:CustomerConcentrationRiskMember
2023-02-01
2023-07-31
0001520358
MAMA:CustomerOneMember
us-gaap:SalesRevenueNetMember
us-gaap:CustomerConcentrationRiskMember
2022-02-01
2022-07-31
0001520358
MAMA:CustomerTwoMember
us-gaap:SalesRevenueNetMember
us-gaap:CustomerConcentrationRiskMember
2022-02-01
2022-07-31
0001520358
MAMA:CustomerThreeMember
us-gaap:SalesRevenueNetMember
us-gaap:CustomerConcentrationRiskMember
2022-02-01
2022-07-31
0001520358
MAMA:CustomerOneMember
us-gaap:SalesRevenueNetMember
us-gaap:CustomerConcentrationRiskMember
2023-05-01
2023-07-31
0001520358
MAMA:CustomerTwoMember
us-gaap:SalesRevenueNetMember
us-gaap:CustomerConcentrationRiskMember
2023-05-01
2023-07-31
0001520358
MAMA:CustomerThreeMember
us-gaap:SalesRevenueNetMember
us-gaap:CustomerConcentrationRiskMember
2023-05-01
2023-07-31
0001520358
MAMA:CustomerOneMember
us-gaap:SalesRevenueNetMember
us-gaap:CustomerConcentrationRiskMember
2022-05-01
2022-07-31
0001520358
MAMA:CustomerTwoMember
us-gaap:SalesRevenueNetMember
us-gaap:CustomerConcentrationRiskMember
2022-05-01
2022-07-31
0001520358
MAMA:CustomerThreeMember
us-gaap:SalesRevenueNetMember
us-gaap:CustomerConcentrationRiskMember
2022-05-01
2022-07-31
0001520358
MAMA:OneCustomerMember
us-gaap:AccountsReceivableMember
us-gaap:CustomerConcentrationRiskMember
2023-02-01
2023-07-31
0001520358
MAMA:CustomerOneMember
us-gaap:AccountsReceivableMember
us-gaap:CustomerConcentrationRiskMember
2022-02-01
2023-01-31
0001520358
MAMA:CustomerTwoMember
us-gaap:AccountsReceivableMember
us-gaap:CustomerConcentrationRiskMember
2022-02-01
2023-01-31
0001520358
MAMA:CustomerThreeMember
us-gaap:AccountsReceivableMember
us-gaap:CustomerConcentrationRiskMember
2022-02-01
2023-01-31
0001520358
MAMA:ThreeCustomersMember
us-gaap:AccountsReceivableMember
us-gaap:CustomerConcentrationRiskMember
2022-02-01
2023-01-31
0001520358
us-gaap:SeriesAPreferredStockMember
2023-02-01
2023-07-31
0001520358
MAMA:SeriesAConvertiblePreferredStockMember
2023-07-31
0001520358
MAMA:SeriesAConvertiblePreferredStockMember
2023-01-31
0001520358
us-gaap:SeriesBPreferredStockMember
2023-02-01
2023-07-31
0001520358
us-gaap:SeriesBPreferredStockMember
2022-09-13
2022-09-13
0001520358
us-gaap:SeriesBPreferredStockMember
2022-11-17
2022-11-17
0001520358
us-gaap:SeriesBPreferredStockMember
2023-06-22
2023-06-22
0001520358
us-gaap:SeriesBPreferredStockMember
2023-05-01
2023-07-31
0001520358
us-gaap:SeriesBPreferredStockMember
2022-05-01
2022-07-31
0001520358
us-gaap:SeriesBPreferredStockMember
2022-02-01
2022-07-31
0001520358
us-gaap:RestrictedStockUnitsRSUMember
2023-07-31
0001520358
us-gaap:RestrictedStockUnitsRSUMember
2023-02-01
2023-07-31
0001520358
us-gaap:RestrictedStockUnitsRSUMember
2023-05-01
2023-07-31
0001520358
us-gaap:WarrantMember
2023-05-01
2023-07-31
0001520358
2022-02-01
2023-01-31
0001520358
us-gaap:WarrantMember
2023-01-31
0001520358
us-gaap:WarrantMember
2023-02-01
2023-07-31
0001520358
us-gaap:WarrantMember
2023-07-31
0001520358
MAMA:YearOneMember
2023-02-01
2023-07-31
0001520358
MAMA:YearTwoMember
2023-02-01
2023-07-31
0001520358
MAMA:YearTwoMember
srt:MinimumMember
2023-02-01
2023-07-31
0001520358
MAMA:YearTwoMember
srt:MaximumMember
2023-02-01
2023-07-31
0001520358
MAMA:YearThreeMember
2023-02-01
2023-07-31
0001520358
MAMA:YearThreeMember
srt:MinimumMember
2023-02-01
2023-07-31
0001520358
MAMA:YearThreeMember
srt:MaximumMember
2023-02-01
2023-07-31
0001520358
MAMA:YearFourMember
2023-02-01
2023-07-31
0001520358
srt:MinimumMember
2023-02-01
2023-07-31
0001520358
srt:MinimumMember
2023-07-31
0001520358
srt:MaximumMember
2023-07-31
iso4217:USD
xbrli:shares
iso4217:USD
xbrli:shares
xbrli:pure
UNITED
STATES
SECURITIES
AND EXCHANGE COMMISSION
Washington,
DC 20549
FORM
10-Q
| ☒ |
QUARTERLY
REPORT PURSUANT TO SECTION 13 OR 15(D) OF THE SECURITIES EXCHANGE ACT OF 1934 |
For
the quarter ended: July 31, 2023
OR
| ☐ |
TRANSITION
REPORT PURSUANT TO SECTION 13 OR 15(D) OF THE SECURITIES EXCHANGE ACT OF 1934 |
For
the Transition Period from ___________ to ____________
Commission
File Number: 001-40597
Mama’s
Creations, Inc.
(Exact
name of Registrant as specified in its charter)
| Nevada
|
|
27-0607116 |
| (State
or other jurisdiction of incorporation) |
|
(IRS
Employer ID No.) |
25
Branca Road
East
Rutherford, NJ 07073
(Address
of principal executive offices and zip Code)
(201)
531-1212
(Registrant’s
telephone number, including area code)
Securities
Registered Pursuant to Section 12(g) of the Act:
| Title
of Each Class |
|
Trading
Symbol |
|
Name
of Each Exchange on which registered |
| Common
Stock, par value $0.00001 |
|
MAMA |
|
NASDAQ
Capital Market |
Indicate
by check mark whether the registrant (1) has filed all reports required to be filed by section 13 or 15(d) of the Securities Exchange
Act of 1934 during the past 12 months, and (2) has been subject to such filing requirements for the past 90 days. Yes ☒ No ☐
Indicate
by check mark whether the registrant has submitted electronically and posted on its corporate Web site, if any, every Interactive Data
File required to be submitted and posted pursuant to Rule 405 of Regulation S-T (§232.405 of this chapter) during the preceding
12 months (or for such shorter period that the registrant was required to submit and post such files. Yes ☒ No ☐
Indicate
by check mark whether the registrant is a large accelerated filer, an accelerated filer, or a non-accelerated filer, or a smaller reporting
company. See the definitions of “large accelerated filer,” “accelerated filer” and “smaller reporting company”
in Rule 12b-2 of the Exchange Act:
| Large
accelerated filer |
☐ |
Accelerated
filer |
☐ |
| |
|
|
|
| Non-accelerated
filer |
☒ |
Smaller
reporting company |
☒ |
| |
|
|
|
| |
|
Emerging
Growth Company |
☐ |
Indicate
by check mark whether the registrant is a shell company (as defined in Rule 12b-2 of the Exchange Act). Yes ☐ No ☒
As
of September 11, 2023, there were 37,443,387 shares outstanding of the registrant’s common stock.
TABLE
OF CONTENTS
CAUTIONARY
NOTE REGARDING FORWARD-LOOKING STATEMENTS
Certain
statements in this report are “forward-looking statements” within the meaning of Section 27A of the Securities Act of 1933,
as amended, or the Securities Act, and Section 21E of the Exchange Act. The forward-looking statements involve substantial risks and
uncertainties. All statements, other than statements related to present facts or current conditions or of historical facts, contained
in this report, including statements regarding our strategy, future operations, future financial position, future revenues, and projected
costs, prospects, plans and objectives of management, are forward-looking statements. Accordingly, these statements involve estimates,
assumptions and uncertainties which could cause actual results to differ materially from those expressed in them. The words “anticipate,”
“believe,” “continue,” “could,” “estimate,” “expect,” “intend,”
“may,” “might,” “ongoing,” “plan,” “potential,” “predict,” “project,”
“should,” “target,” “will,” “would,” or the negative of these terms or other comparable
terminology are intended to identify forward-looking statements, although not all forward-looking statements contain these identifying
words.
Forward-looking
statements are not guarantees of future performance and our actual results could differ materially from the results discussed in the
forward-looking statements. Factors that could cause actual results to differ materially from those in the forward-looking statements
include:
| |
● |
the
impacts of the COVID-19 pandemic on our business, financial condition and results of operations, and our inability to mitigate such
impacts; |
| |
● |
the
adequacy of our liquidity to pursue our business objectives; |
| |
● |
reliance
on a limited number of customers; |
| |
● |
loss
or retirement of key executives, including prior to identifying a successor; |
| |
● |
adverse
economic conditions or intense competition; |
| |
● |
pricing
pressures in the market and lack of control over the pricing of raw materials and freight; |
| |
● |
entry
of new competitors and products; |
| |
● |
adverse
federal, state and local government regulation (including, but not limited to, the Food and Drug Administration); |
| |
● |
liability
related to the consumption of our products |
| |
● |
ability
to secure placement of our products in key retail locations; |
| |
● |
our
ability to integrate acquisitions and related businesses including Chef Inspirational Foods, LLC; |
| |
● |
wage
and price inflation; |
| |
● |
maintenance
of quality control; and |
| |
● |
issues
related to the enforcement of our intellectual property rights. |
For
more information regarding these risks and uncertainties as well as certain additional risks that we face, you should refer to “Item
1A. Risk Factors” in this report and “Item 1A. Risk Factors” in our most recent Annual Report on Form 10-K, and to
subsequent reports and registration statements filed from time to time with the SEC. We caution you not to place undue reliance on these
forward-looking statements, which are current only as of the date on which we issued this report. We do not intend to, and we disclaim
any duty or obligation to, update or revise any forward-looking statements to reflect new information or future events or for any other
reason.
PART
I - FINANCIAL INFORMATION
Item
1. Financial Statements.
Mama’s
Creations, Inc.
CONDENSED
CONSOLIDATED FINANCIAL STATEMENTS
July
31, 2023
Mama’s
Creations, Inc.
Condensed
Consolidated Balance Sheets
| | |
July
31, 2023 | | |
January 31, 2023 | |
| | |
(Unaudited) | | |
| |
| Assets: | |
| | | |
| | |
| | |
| | | |
| | |
| Current Assets: | |
| | | |
| | |
| Cash | |
$ | 5,560,176 | | |
$ | 4,378,383 | |
| Accounts receivable, net | |
| 8,843,756 | | |
| 6,832,046 | |
| Inventories, net | |
| 3,308,513 | | |
| 3,635,881 | |
| Prepaid expenses and other current assets | |
| 474,301 | | |
| 828,391 | |
| Total current assets | |
| 18,186,746 | | |
| 15,674,701 | |
| | |
| | | |
| | |
| Property, plant, and equipment, net | |
| 4,067,648 | | |
| 3,423,096 | |
| Intangible assets, net | |
| 5,754,182 | | |
| 1,502,510 | |
| Goodwill | |
| 8,633,334 | | |
| 8,633,334 | |
| Operating lease right of use assets, net | |
| 3,124,449 | | |
| 3,236,690 | |
| Deferred tax asset | |
| 67,908 | | |
| 717,559 | |
| Equity method investment | |
| - | | |
| 1,343,486 | |
| Deposits | |
| 65,410 | | |
| 53,819 | |
| Total Assets | |
$ | 39,899,677 | | |
$ | 34,585,195 | |
| | |
| | | |
| | |
| Liabilities and Stockholders’ Equity: | |
| | | |
| | |
| | |
| | | |
| | |
| Liabilities: | |
| | | |
| | |
| Current Liabilities: | |
| | | |
| | |
| Accounts payable and accrued expenses | |
$ | 8,872,582 | | |
$ | 9,063,256 | |
| Term loan, net of debt discount of $49,022 and $60,082, respectively | |
| 1,502,702 | | |
| 1,491,642 | |
| Operating lease liabilities | |
| 414,937 | | |
| 391,802 | |
| Finance leases payable | |
| 335,119 | | |
| 182,391 | |
| Promissory notes – related parties | |
| 1,950,000 | | |
| 750,000 | |
| Total current liabilities | |
| 13,075,340 | | |
| 11,879,091 | |
| | |
| | | |
| | |
| Line of credit | |
| 500,000 | | |
| 890,000 | |
| Operating lease liabilities – net of current | |
| 2,739,208 | | |
| 2,897,205 | |
| Finance leases payable – net of current | |
| 906,476 | | |
| 248,640 | |
| Promissory notes – related parties, net of current | |
| 3,000,000 | | |
| 1,500,000 | |
| Term loan – net of current | |
| 3,879,318 | | |
| 4,655,181 | |
| Total long-term liabilities | |
| 11,025,002 | | |
| 10,191,026 | |
| | |
| | | |
| | |
| Total Liabilities | |
| 24,100,342 | | |
| 22,070,117 | |
| | |
| | | |
| | |
| Commitments and contingencies (Notes 10 and 11) | |
| - | | |
| - | |
| | |
| | | |
| | |
| Stockholders’ Equity: | |
| | | |
| | |
| Series A Preferred stock, $0.00001 par value; 120,000 shares authorized; 23,400 issued as of July 31, 2023 and January 31, 2023, respectively, 0 shares outstanding as of July 31, 2023 and January 31, 2023, respectively | |
| - | | |
| - | |
| Series B Preferred stock, $0.00001 par value; 200,000 shares authorized; 0 and 54,600 issued and outstanding as of July 31, 2023 and January 31, 2023 respectively | |
| - | | |
| - | |
| Preferred stock, $0.00001 par value; 19,680,000 shares authorized; no shares issued and outstanding | |
| - | | |
| - | |
| Common stock, $0.00001 par value; 250,000,000 shares authorized; 37,343,387 and 36,317,857 shares issued and outstanding as of July 31, 2023 and January 31, 2023 | |
| 374 | | |
| 364 | |
| Additional paid in capital | |
| 22,912,383 | | |
| 22,724,440 | |
| Accumulated deficit | |
| (6,963,922 | ) | |
| (10,060,226 | ) |
| Less: Treasury stock, 230,000 shares at cost | |
| (149,500 | ) | |
| (149,500 | ) |
| Total Stockholders’ Equity | |
| 15,799,335 | | |
| 12,515,078 | |
| Total Liabilities and Stockholders’ Equity | |
$ | 39,899,677 | | |
$ | 34,585,195 | |
See
accompanying notes to the condensed consolidated financial statements.
Mama’s
Creations, Inc.
Condensed
Consolidated Statements of Operations
(Unaudited)
| | |
2023 | | |
2022 | | |
2023 | | |
2022 | |
| | |
For the Three Months Ended July 31, | | |
For the Six Months Ended July 31, | |
| | |
2023 | | |
2022 | | |
2023 | | |
2022 | |
| | |
| | |
| | |
| | |
| |
| Net sales | |
$ | 24,790,085 | | |
$ | 22,846,474 | | |
$ | 47,910,901 | | |
$ | 44,677,054 | |
| | |
| | | |
| | | |
| | | |
| | |
| Costs of sales | |
| 17,283,847 | | |
| 20,119,862 | | |
| 34,033,663 | | |
| 38,090,179 | |
| | |
| | | |
| | | |
| | | |
| | |
| Gross profit | |
| 7,506,238 | | |
| 2,726,612 | | |
| 13,877,238 | | |
| 6,586,875 | |
| | |
| | | |
| | | |
| | | |
| | |
| Operating expenses: | |
| | | |
| | | |
| | | |
| | |
| Research and development | |
| 94,871 | | |
| 41,792 | | |
| 166,056 | | |
| 68,327 | |
| Selling, general and administrative | |
| 5,135,537 | | |
| 3,516,115 | | |
| 9,492,568 | | |
| 7,088,870 | |
| Total operating expenses | |
| 5,230,408 | | |
| 3,557,907 | | |
| 9,658,624 | | |
| 7,157,197 | |
| | |
| | | |
| | | |
| | | |
| | |
| Income (loss) from operations | |
| 2,275,830 | | |
| (831,295 | ) | |
| 4,218,614 | | |
| (570,322 | ) |
| | |
| | | |
| | | |
| | | |
| | |
| Other income (expenses) | |
| | | |
| | | |
| | | |
| | |
| Interest, net | |
| (181,658 | ) | |
| (139,064 | ) | |
| (359,052 | ) | |
| (263,315 | ) |
| Amortization of debt discount | |
| (5,530 | ) | |
| (3,015 | ) | |
| (11,060 | ) | |
| (6,655 | ) |
| Other income | |
| 7,449 | | |
| 2,596 | | |
| 27,449 | | |
| 2,596 | |
| Total other expenses | |
| (179,739 | ) | |
| (139,483 | ) | |
| (342,663 | ) | |
| (267,374 | ) |
| | |
| | | |
| | | |
| | | |
| | |
| Net income (loss) before income tax provision and income from equity method investment | |
| 2,096,091 | | |
| (970,778 | ) | |
| 3,875,951 | | |
| (837,696 | ) |
| | |
| | | |
| | | |
| | | |
| | |
| Income from equity method investment | |
| 77,584 | | |
| 18,540 | | |
| 223,342 | | |
| 18,540 | |
| Income tax (provision) benefit | |
| (429,764 | ) | |
| 208,992 | | |
| (954,456 | ) | |
| 179,607 | |
| | |
| | | |
| | | |
| | | |
| | |
| Net income (loss) | |
| 1,743,911 | | |
| (743,246 | ) | |
| 3,144,837 | | |
| (639,549 | ) |
| | |
| | | |
| | | |
| | | |
| | |
| Less: series B preferred dividends | |
| (21,233 | ) | |
| - | | |
| (48,533 | ) | |
| - | |
| | |
| | | |
| | | |
| | | |
| | |
| Net Income available to common stockholders | |
| 1,722,678 | | |
| (743,246 | ) | |
| 3,096,304 | | |
| (639,549 | ) |
| | |
| | | |
| | | |
| | | |
| | |
| Net income (loss) per common share | |
| | | |
| | | |
| | | |
| | |
| – basic | |
$ | 0.05 | | |
$ | (0.02 | ) | |
$ | 0.09 | | |
$ | (0.02 | ) |
| – diluted | |
$ | 0.05 | | |
$ | (0.02 | ) | |
$ | 0.08 | | |
$ | (0.02 | ) |
| | |
| | | |
| | | |
| | | |
| | |
| Weighted average common shares outstanding | |
| | | |
| | | |
| | | |
| | |
| – basic | |
| 36,855,181 | | |
| 35,811,087 | | |
| 36,628,429 | | |
| 35,785,719 | |
| – diluted | |
| 37,490,567 | | |
| 35,811,087 | | |
| 37,195,314 | | |
| 35,785,719 | |
See
accompanying notes to the condensed consolidated financial statements.
Mama’s
Creations, Inc.
Condensed
Consolidated Statements of Changes in Stockholders’ Equity
(Unaudited)
For
the Period from May 1, 2023 through July 31, 2023
| | |
Shares | | |
Amount | | |
Shares | | |
Amount | | |
Shares | | |
Amount | | |
Shares | | |
Amount | | |
Capital | | |
Deficit | | |
Equity | |
| | |
Series A Preferred Stock | | |
Series B Preferred Stock | | |
Common Stock | | |
Treasury Stock | | |
Additional Paid In | | |
Accumulated | | |
Stockholders’ | |
| | |
Shares | | |
Amount | | |
Shares | | |
Amount | | |
Shares | | |
Amount | | |
Shares | | |
Amount | | |
Capital | | |
Deficit | | |
Equity | |
| Balance, May 1, 2023 | |
| - | | |
$ | - | | |
| 54,600 | | |
$ | - | | |
| 36,484,777 | | |
$ | 366 | | |
| (230,000 | ) | |
$ | (149,500 | ) | |
$ | 22,799,322 | | |
$ | (8,686,600 | ) | |
$ | 13,963,588 | |
| | |
| | | |
| | | |
| | | |
| | | |
| | | |
| | | |
| | | |
| | | |
| | | |
| | | |
| | |
| Stock based compensation | |
| - | | |
| - | | |
| - | | |
| - | | |
| 19,960 | | |
| - | | |
| - | | |
| - | | |
| 104,789 | | |
| - | | |
| 104,789 | |
| | |
| | | |
| | | |
| | | |
| | | |
| | | |
| | | |
| | | |
| | | |
| | | |
| | | |
| | |
| Stock issued for the exercise of options and warrants | |
| - | | |
| - | | |
| - | | |
| - | | |
| 19,650 | | |
| - | | |
| - | | |
| - | | |
| 8,280 | | |
| - | | |
| 8,280 | |
| | |
| | | |
| | | |
| | | |
| | | |
| | | |
| | | |
| | | |
| | | |
| | | |
| | | |
| | |
| Conversion of series B preferred stock to common stock | |
| - | | |
| - | | |
| (54,600 | ) | |
| - | | |
| 819,000 | | |
| 8 | | |
| - | | |
| - | | |
| (8 | ) | |
| - | | |
| - | |
| | |
| | | |
| | | |
| | | |
| | | |
| | | |
| | | |
| | | |
| | | |
| | | |
| | | |
| | |
| Series B Preferred dividend | |
| - | | |
| - | | |
| - | | |
| - | | |
| - | | |
| - | | |
| - | | |
| - | | |
| - | | |
| (21,233 | ) | |
| (21,233 | ) |
| | |
| | | |
| | | |
| | | |
| | | |
| | | |
| | | |
| | | |
| | | |
| | | |
| | | |
| | |
| Net income | |
| - | | |
| - | | |
| - | | |
| - | | |
| - | | |
| - | | |
| - | | |
| - | | |
| - | | |
| 1,743,911 | | |
| 1,743,911 | |
| | |
| | | |
| | | |
| | | |
| | | |
| | | |
| | | |
| | | |
| | | |
| | | |
| | | |
| | |
| Balance, July 31, 2023 | |
| - | | |
$ | - | | |
| - | | |
$ | - | | |
| 37,343,387 | | |
$ | 374 | | |
| (230,000 | ) | |
$ | (149,500 | ) | |
$ | 22,912,383 | | |
$ | (6,963,922 | ) | |
$ | 15,799,335 | |
For
the Period from May 1, 2022 through July 31, 2022
| | |
Shares | | |
Amount | | |
Shares | | |
Amount | | |
Shares | | |
Amount | | |
Capital | | |
Deficit | | |
Equity | |
| | |
Series A Preferred Stock | | |
Common Stock | | |
Treasury Stock | | |
Additional Paid In | | |
Accumulated | | |
Stockholders’ | |
| | |
Shares | | |
Amount | | |
Shares | | |
Amount | | |
Shares | | |
Amount | | |
Capital | | |
Deficit | | |
Equity | |
| Balance, May 1, 2022 | |
| - | | |
$ | - | | |
| 35,774,468 | | |
$ | 359 | | |
| (230,000 | ) | |
$ | (149,500 | ) | |
$ | 20,587,789 | | |
$ | (12,225,133 | ) | |
$ | 8,213,515 | |
| | |
| | | |
| | | |
| | | |
| | | |
| | | |
| | | |
| | | |
| | | |
| | |
| Stock issued for the exercise of options | |
| - | | |
| - | | |
| 41,417 | | |
| - | | |
| - | | |
| - | | |
| 26,250 | | |
| - | | |
| 26,250 | |
| | |
| | | |
| | | |
| | | |
| | | |
| | | |
| | | |
| | | |
| | | |
| | |
| Stock options issued for services | |
| - | | |
| - | | |
| - | | |
| - | | |
| - | | |
| - | | |
| 12,333 | | |
| - | | |
| 12,333 | |
| | |
| | | |
| | | |
| | | |
| | | |
| | | |
| | | |
| | | |
| | | |
| | |
| Stock issued for the acquisition of equity investment in Chef Inspirational | |
| - | | |
| - | | |
| 501,972 | | |
| 5 | | |
| - | | |
| - | | |
| 699,995 | | |
| - | | |
| 700,000 | |
| | |
| | | |
| | | |
| | | |
| | | |
| | | |
| | | |
| | | |
| | | |
| | |
| Net loss | |
| - | | |
| - | | |
| - | | |
| - | | |
| - | | |
| - | | |
| - | | |
| (743,246 | ) | |
| (743,246 | ) |
| | |
| | | |
| | | |
| | | |
| | | |
| | | |
| | | |
| | | |
| | | |
| | |
| Balance, July 31, 2022 | |
| - | | |
$ | - | | |
| 36,317,857 | | |
$ | 364 | | |
| (230,000 | ) | |
$ | (149,500 | ) | |
$ | 21,326,367 | | |
$ | (12,968,379 | ) | |
$ | 8,208,852 | |
For
the Period from February 1, 2023 through July 31, 2023
| | |
Shares | | |
Amount | | |
Shares | | |
Amount | | |
Shares | | |
Amount | | |
Shares | | |
Amount | | |
Capital | | |
Deficit | | |
Equity | |
| | |
Series A Preferred Stock | | |
Series B Preferred Stock | | |
Common Stock | | |
Treasury Stock | | |
Additional Paid In | | |
Accumulated | | |
Stockholders’ | |
| | |
Shares | | |
Amount | | |
Shares | | |
Amount | | |
Shares | | |
Amount | | |
Shares | | |
Amount | | |
Capital | | |
Deficit | | |
Equity | |
| Balance, February 1, 2023 | |
| - | | |
$ | - | | |
| 54,600 | | |
$ | - | | |
| 36,317,857 | | |
$ | 364 | | |
| (230,000 | ) | |
$ | (149,500 | ) | |
$ | 22,724,440 | | |
$ | (10,060,226 | ) | |
$ | 12,515,078 | |
| | |
| | | |
| | | |
| | | |
| | | |
| | | |
| | | |
| | | |
| | | |
| | | |
| | | |
| | |
| Stock based compensation | |
| - | | |
| - | | |
| - | | |
| - | | |
| 19,960 | | |
| - | | |
| - | | |
| - | | |
| 160,173 | | |
| - | | |
| 160,173 | |
| | |
| | | |
| | | |
| | | |
| | | |
| | | |
| | | |
| | | |
| | | |
| | | |
| | | |
| | |
| Stock issued for the exercise of options and warrants | |
| - | | |
| - | | |
| - | | |
| - | | |
| 186,570 | | |
| 2 | | |
| - | | |
| - | | |
| 27,778 | | |
| - | | |
| 27,780 | |
| | |
| | | |
| | | |
| | | |
| | | |
| | | |
| | | |
| | | |
| | | |
| | | |
| | | |
| | |
| Conversion of series B preferred stock to common stock | |
| - | | |
| - | | |
| (54,600 | ) | |
| - | | |
| 819,000 | | |
| 8 | | |
| - | | |
| - | | |
| (8 | ) | |
| - | | |
| - | |
| | |
| | | |
| | | |
| | | |
| | | |
| | | |
| | | |
| | | |
| | | |
| | | |
| | | |
| | |
| Series B Preferred dividend | |
| - | | |
| - | | |
| - | | |
| - | | |
| - | | |
| - | | |
| - | | |
| - | | |
| - | | |
| (48,533 | ) | |
| (48,533 | ) |
| | |
| | | |
| | | |
| | | |
| | | |
| | | |
| | | |
| | | |
| | | |
| | | |
| | | |
| | |
| Net income | |
| - | | |
| - | | |
| - | | |
| - | | |
| - | | |
| - | | |
| - | | |
| - | | |
| - | | |
| 3,144,837 | | |
| 3,144,837 | |
| | |
| | | |
| | | |
| | | |
| | | |
| | | |
| | | |
| | | |
| | | |
| | | |
| | | |
| | |
| Balance, July 31, 2023 | |
| - | | |
$ | - | | |
| - | | |
$ | - | | |
| 37,343,387 | | |
$ | 374 | | |
| (230,000 | ) | |
$ | (149,500 | ) | |
$ | 22,912,383 | | |
$ | (6,963,922 | ) | |
$ | 15,799,335 | |
For
the Period from February 1, 2022 through July 31, 2022
| | |
Shares | | |
Amount | | |
Shares | | |
Amount | | |
Shares | | |
Amount | | |
Capital | | |
Deficit | | |
Equity | |
| | |
Series A Preferred Stock | | |
Common Stock | | |
Treasury Stock | | |
Additional Paid In | | |
Accumulated | | |
Stockholders’ | |
| | |
Shares | | |
Amount | | |
Shares | | |
Amount | | |
Shares | | |
Amount | | |
Capital | | |
Deficit | | |
Equity | |
| Balance, February 1, 2022 | |
| - | | |
$ | - | | |
| 35,758,792 | | |
$ | 359 | | |
| (230,000 | ) | |
$ | (149,500 | ) | |
$ | 20,587,789 | | |
$ | (12,328,830 | ) | |
$ | 8,109,818 | |
| Beginning balance, value | |
| - | | |
$ | - | | |
| 35,758,792 | | |
$ | 359 | | |
| (230,000 | ) | |
$ | (149,500 | ) | |
$ | 20,587,789 | | |
$ | (12,328,830 | ) | |
$ | 8,109,818 | |
| | |
| | | |
| | | |
| | | |
| | | |
| | | |
| | | |
| | | |
| | | |
| | |
| Stock issued for the exercise of options | |
| - | | |
| - | | |
| 57,093 | | |
| - | | |
| - | | |
| - | | |
| 26,250 | | |
| - | | |
| 26,250 | |
| | |
| | | |
| | | |
| | | |
| | | |
| | | |
| | | |
| | | |
| | | |
| | |
| Stock options issued for services | |
| - | | |
| - | | |
| - | | |
| - | | |
| - | | |
| - | | |
| 12,333 | | |
| - | | |
| 12,333 | |
| | |
| | | |
| | | |
| | | |
| | | |
| | | |
| | | |
| | | |
| | | |
| | |
| Stock issued for the acquisition of equity investment in Chef Inspirational | |
| - | | |
| - | | |
| 501,972 | | |
| 5 | | |
| - | | |
| - | | |
| 699,995 | | |
| - | | |
| 700,000 | |
| | |
| | | |
| | | |
| | | |
| | | |
| | | |
| | | |
| | | |
| | | |
| | |
| Net loss | |
| - | | |
| - | | |
| - | | |
| - | | |
| - | | |
| - | | |
| - | | |
| (639,549 | ) | |
| (639,549 | ) |
| Net income (loss) | |
| - | | |
| - | | |
| - | | |
| - | | |
| - | | |
| - | | |
| - | | |
| (639,549 | ) | |
| (639,549 | ) |
| | |
| | | |
| | | |
| | | |
| | | |
| | | |
| | | |
| | | |
| | | |
| | |
| Balance, July 31, 2022 | |
| - | | |
$ | - | | |
| 36,317,857 | | |
$ | 364 | | |
| (230,000 | ) | |
$ | (149,500 | ) | |
$ | 21,326,367 | | |
$ | (12,968,379 | ) | |
$ | 8,208,852 | |
| Ending balance, value | |
| - | | |
$ | - | | |
| 36,317,857 | | |
$ | 364 | | |
| (230,000 | ) | |
$ | (149,500 | ) | |
$ | 21,326,367 | | |
$ | (12,968,379 | ) | |
$ | 8,208,852 | |
See
accompanying notes to the condensed consolidated financial statements.
Mama’s
Creations, Inc.
Condensed
Consolidated Statements of Cash Flows
(Unaudited)
| | |
2023 | | |
2022 | |
| | |
For the Six Months Ended July 31, | |
| | |
2023 | | |
2022 | |
| CASH FLOWS FROM OPERATING ACTIVITIES: | |
| | | |
| | |
| Net income (loss) | |
$ | 3,144,837 | | |
$ | (639,549 | ) |
| Adjustments to reconcile net income to net cash provided by operating activities: | |
| | | |
| | |
| Depreciation | |
| 511,589 | | |
| 401,126 | |
| Amortization of debt discount | |
| 11,060 | | |
| 6,655 | |
| Amortization of right of use assets | |
| 112,241 | | |
| 182,862 | |
| Amortization of intangibles | |
| 303,949 | | |
| 230,156 | |
| Stock-based compensation | |
| 110,173 | | |
| 12,333 | |
| Allowance for obsolete inventory | |
| 93,238 | | |
| - | |
| Change in deferred tax asset | |
| 649,651 | | |
| (188,080 | ) |
| Income from equity method investment | |
| (223,342 | ) | |
| (18,540 | ) |
| Paid in kind interest | |
| - | | |
| 53,356 | |
| Changes in operating assets and liabilities: | |
| | | |
| | |
| Allowance for doubtful accounts | |
| 140,442 | | |
| - | |
| Accounts receivable | |
| 1,126,867 | | |
| 749,959 | |
| Inventories | |
| 234,130 | | |
| (1,302,933 | ) |
| Prepaid expenses and other current assets | |
| 346,709 | | |
| (248,113 | ) |
| Security deposits | |
| (17,941 | ) | |
| - | |
| Accounts payable and accrued expenses | |
| (3,049,114 | ) | |
| 1,170,280 | |
| Operating lease liability | |
| (134,862 | ) | |
| (176,534 | ) |
| Net Cash Provided by Operating Activities | |
| 3,359,627 | | |
| 232,978 | |
| | |
| | | |
| | |
| CASH FLOWS FROM INVESTING ACTIVITIES: | |
| | | |
| | |
| Cash paid for fixed assets | |
| (252,853 | ) | |
| (305,547 | ) |
| Cash paid for investment in Chef Inspirational Foods, LLC, net | |
| (645,641 | ) | |
| (500,000 | ) |
| Net Cash (Used in) Investing Activities | |
| (898,494 | ) | |
| (805,547 | ) |
| | |
| | | |
| | |
| CASH FLOWS FROM FINANCING ACTIVITIES: | |
| | | |
| | |
| Proceeds in advance of preferred stock offering | |
| - | | |
| 515,000 | |
| Repayment of term loan | |
| (775,863 | ) | |
| (517,241 | ) |
| (Repayment) borrowings of line of credit, net | |
| (390,000 | ) | |
| 1,725,000 | |
| Repayment of finance lease obligations | |
| (92,724 | ) | |
| (130,626 | ) |
| Payment of Series B Preferred dividends | |
| (48,533 | ) | |
| - | |
| Proceeds from exercise of options | |
| 27,780 | | |
| 26,250 | |
| Net Cash (Used in) Provided by Financing Activities | |
| (1,279,340 | ) | |
| 1,618,383 | |
| | |
| | | |
| | |
| Net Increase in Cash | |
| 1,181,793 | | |
| 1,045,814 | |
| | |
| | | |
| | |
| Cash - Beginning of Period | |
| 4,378,383 | | |
| 850,598 | |
| | |
| | | |
| | |
| Cash - End of Period | |
$ | 5,560,176 | | |
$ | 1,896,412 | |
| | |
| | | |
| | |
| SUPPLEMENTARY CASH FLOW INFORMATION: | |
| | | |
| | |
| Cash Paid During the Period for: | |
| | | |
| | |
| Income taxes | |
$ | 112,500 | | |
$ | - | |
| Interest | |
$ | 313,488 | | |
$ | 182,873 | |
| | |
| | | |
| | |
| SUPPLEMENTARY DISCLOSURE OF NON-CASH INVESTING AND FINANCING ACTIVITIES: | |
| | | |
| | |
| Conversion of series b preferred stock to common stock | |
$ | 8 | | |
$ | - | |
| Finance lease asset additions | |
$ | 903,288 | | |
$ | 34,268 | |
| Related party debt incurred for purchase of Chef Inspirational Foods, LLC | |
$ | 2,700,000 | | |
| - | |
| Non-cash consideration paid in common stock for equity investment in Chef Inspirational | |
$ | - | | |
$ | 700,000 | |
| Settlement of liability in common stock | |
$ | 50,000 | | |
$ | - | |
See
accompanying notes to the condensed consolidated financial statements.
Mama’s
Creations, Inc.
Notes
to Condensed Consolidated Financial Statements
July
31, 2023
Note
1 - Nature of Operations and Basis of Presentation
Nature
of Operations
Mama’s
Creations, Inc. (together with its subsidiaries, the “Company”), was organized on July 22, 2009 as a Nevada corporation.
The Company has a year-end of January 31.
Our
subsidiary, MamaMancini’s Inc., a Delaware Corporation (“Mamas”) is a marketer, manufacturer and distributor of beef
meatballs with sauce, turkey meatballs with sauce, beef meat loaf, sausage & peppers, chicken parmesan and other similar meats and
sauces. In addition, the Company continues to diversify its product line by introducing new products such as ready to serve meals, single-size
pasta bowls, bulk deli, and packaged refrigerated protein products. Mamas products were submitted to the United States Department of
Agriculture (the “USDA”) and approved as all natural. The USDA defines all natural as a product that contains no artificial
ingredients, coloring ingredients or chemical preservatives and is minimally processed.
On
December 29, 2021, the Company made two acquisitions which expanded the Company’s core product lines, occasions, and access to
specific cohorts and markets. T&L Creative Salads, Inc. (“T&L”) and Olive Branch, LLC (“Olive Branch”),
are related premier gourmet food manufacturers based in New York. T&L offers a full line of foods for retail food chains and club
stores, delis, bagel stores, caterers and provision distributors. T&L uses high-quality meats, seafood and vegetables, prepared to
meet the standards set forth by the USDA and the Food and Drug Administration (“FDA”). Olive Branch offers a full line of
olives, olive mixes, and savory products to retail food chains and club stores, delis, bagel stores, caterers and provision distributors,
primarily in pre-packaged containers.
On
June 28, 2022, the Company acquired a 24% minority interest in Chef Inspirational Foods, LLC (“CIF”), a leading developer,
innovator, marketer and sales company selling prepared foods, for an investment of $1.2 million. The investment consisted of $500,000
in cash and $700,000 in the Company’s common stock. The acquisition of the interest in CIF was accounted for under the equity method
of accounting for investments up until the Company acquired the remaining interest of CIF (the “CIF Acquisition”). On June
28, 2023, the Company completed the acquisition of the remaining 76% of CIF, in accordance with the terms of the Membership Interest
Purchase Agreement dated June 28, 2023 by and among the Company, Siegel Suffolk Family, LLC, and R&I Loeb Family, LLC (the “Sellers”).
Per the terms of the Membership Interest Purchase Agreement the purchase price was $3.65 million, including $950 thousand in cash at
closing and $2.7 million in a promissory note. The promissory note requires a principal payment of $1.2 million in cash on the first
anniversary of the closing date, and a payment of $1.5 million in common stock of the Company on the second anniversary of the closing
date.
The
following presents the unaudited results of operations for the period February 1, 2023 through June 28, 2023 of CIF.
Schedule
of Results of Operations
| | |
For the Period
February 1, 2023
through
June 28, 2023 | |
| Revenues | |
$ | 13,720,817 | |
| Net income | |
$ | 930,592 | |
On
July 31, 2023, MamaMancini’s Holdings, Inc. filed an amendment to the Articles of Incorporation with the Secretary of State of
the State of Nevada to change the Company’s name from “MamaMancini’s Holdings, Inc.” to “Mama’s Creations,
Inc.” (the “Name Change”). The Name Change, which was approved by the Company’s stockholders at its annual meeting
on July 31, 2023, did not alter the voting powers or relative rights of the Company Common Stock, reflects the evolution of the Company
from its origins as a home style, old world Italian food company to a broader provider of all-natural specialty prepared refrigerated
foods for sale in retailers around the country. The Company also amended and restated its Amended and Restated Bylaws, solely to reflect
the name change (as amended, the “Second Amended and Restated Bylaws”).
Note
2 - Summary of Significant Accounting Policies
Basis
of Presentation
The
accompanying unaudited Condensed Consolidated Financial Statements have been prepared in accordance with accounting principles generally
accepted in the United States of America (“U.S. GAAP”) for interim financial information and with the instructions to Form
10-Q and Article 8 of Regulation S-X of the SEC for interim financial information. Accordingly, they do not include all of the information
and footnotes required by generally accepted accounting principles for complete financial statements. In the opinion of management, the
accompanying Condensed Consolidated Financial Statements of the Company and its subsidiaries, which are unaudited, include all normal
and recurring adjustments considered necessary to present fairly the Company’s financial position as of July 31, 2023, and the
results of its operations and its cash flows for the periods presented. The unaudited Condensed Consolidated Financial Statements herein
should be read together with the historical consolidated financial statements of the Company for the years ended January 31, 2023 and
2022 included in our 2023 Form 10-K. Operating results for the three and six months ended July 31, 2023 are not necessarily indicative
of the results that may be expected for the year ending January 31, 2024.
Principles
of Consolidation
The
Condensed Consolidated Financial Statements include the accounts of the Company and its wholly owned subsidiaries. All intercompany balances
have been eliminated in consolidation.
Use
of Estimates
The
preparation of Condensed Consolidated Financial Statements in accordance with U.S. GAAP requires management to make estimates and assumptions
that affect the amounts reported in the Condensed Consolidated Financial Statements and accompanying notes. The Company bases its estimates
on historical experience and other assumptions believed to be reasonable under the circumstances, the results of which form the basis
for making judgments about the carrying value of assets and liabilities that are not readily apparent from other sources. Such estimates
and assumptions impact, among others, the following: allowance for doubtful accounts, the fair value of stock-based payments, valuation
of the acquisition of the remaining interest of CIF (which was accounted for as an asset acquisition as substantially all of the fair
value is concentrated in customer relationships), inventory reserves, and estimates for unrealized returns, discounts, and other allowances
that are netted against revenue.
Making
estimates requires management to exercise significant judgment. It is at least reasonably possible that the estimate of the effect of
a condition, situation or set of circumstances that existed at the date of the Condensed Consolidated Financial Statements, which management
considered in formulating its estimate could change in the near term due to one or more future confirming events. Accordingly, the actual
results could differ significantly from our estimates.
Risks
and Uncertainties
The
Company operates in an industry that is subject to intense competition and changes in consumer demand. The Company’s operations
are subject to significant risk and uncertainties including financial and operational risks including the potential risk of business
failure.
The
Company has experienced, and in the future expects to continue to experience variability in sales and earnings. The factors expected
to contribute to this variability include, among others, (i) the cyclical nature of the grocery industry, (ii) general economic conditions
in the various local markets in which the Company competes, including a potential general downturn in the economy, and (iii) the volatility
of prices pertaining to food and beverages in connection with the Company’s distribution of the product. These factors, among others,
make it difficult to project the Company’s operating results on a consistent basis.
Cash
The
Company considers all highly liquid instruments purchased with a maturity of three months or less to be cash equivalents. The Company
held no cash equivalents at July 31, 2023 and January 31, 2023.
The
Company minimizes its credit risk associated with cash by periodically evaluating the credit quality of its primary financial institution.
The balance at times may exceed federally insured limits.
Accounts
Receivable and Allowance for Doubtful Accounts
Accounts
receivable are stated at the amount management expects to collect from outstanding balances. The Company generally does not require collateral
to support customer receivables. The Company provides an allowance for doubtful accounts based upon a review of the outstanding accounts
receivable, historical collection information and existing economic conditions. The Company determines if receivables are past due based
on days outstanding, and amounts are written off when determined to be uncollectible by management. As of July 31, 2023 and January 31,
2023, the reserve for uncollectible accounts was approximately $93,000 and $233,000, respectively. During the three and six months ended
July 31, 2023 the Company wrote off approximately $140,000 accounts that were deemed to be uncollectible.
Inventories
The
Company values its inventory at the lower of cost or net realizable value (“NRV”) and include direct material, direct labor,
warehousing, and overhead costs. NRV is defined as the estimated selling prices less the costs of completion, disposal, and transportation.
The cost of inventory is determined on the first-in, first-out basis. Inventories have been reduced by an allowance for excess, obsolete
and unsaleable inventories. The allowance is an estimate based on management’s review of inventories on hand compared to estimated
future usage and sales. The reserve for obsolescence as of July 31, 2023 and January 31, 2023 was approximately $126,000 and $32,000,
respectively.
Inventories
by major category are as follows:
Schedule of Inventories
| | |
July
31, 2023 | | |
January 31, 2023 | |
| Raw materials and packaging | |
$ | 1,495,179 | | |
$ | 1,883,270 | |
| Work in process | |
| 200,437 | | |
| 98,910 | |
| Finished goods | |
| 1,612,897 | | |
| 1,653,701 | |
| Total | |
$ | 3,308,513 | | |
$ | 3,635,881 | |
Property,
Plant and Equipment
Property,
plant, and equipment are recorded at cost net of depreciation. Depreciation expense is computed using straight-line methods over the
estimated useful lives.
Asset
lives for financial statement reporting of depreciation are:
Schedule
of Property and Equipment Estimated Useful Lives
| Machinery and equipment | |
| 2-7 years | |
| Furniture and fixtures | |
| 3-5 years | |
| Leasehold improvements | |
| -* | |
Upon
sale or retirement of property and equipment, the related cost and accumulated depreciation are removed from the accounts and any gain
or loss is reflected in the consolidated statements of operations.
Goodwill
and Other Intangible Assets
Goodwill
Goodwill represents the excess of the purchase price over the fair values
of the underlying net assets of an acquired business. The Company tests goodwill for impairment on an annual basis during the fourth quarter
of its fiscal year, or immediately if conditions indicate that such impairment could exist. The Company evaluates qualitative factors
to determine if it is more likely than not that the fair value is less than its carrying value and whether it is necessary to perform
goodwill impairment process.
As
of July 31, 2023 and January 31, 2023, there were no impairment losses recognized for goodwill.
Other
Intangible Assets
Other
intangible assets consist of trademarks, trade names and customer relationships. Intangible asset lives for financial statement reporting
of amortization are:
Schedule
of Other Intangible Assets Impairment Losses Recognized for Goodwill
| Tradenames and trademarks | |
| 3 years | |
| Customer relationships | |
| 4 – 5 years | |
Fair
Value of Financial Instruments
For
purpose of this disclosure, the fair value of a financial instrument is the amount at which the instrument could be exchanged in a current
transaction between willing parties, other than in a forced sale or liquidation. The carrying amount of the Company’s short-term
financial instruments approximates fair value due to the relatively short period to maturity for these instruments.
Research
and Development
Research
and development is expensed as incurred. Research and development expenses for the three months ended July 31, 2023 and 2022 were $94,871
and $41,792, respectively. Research and development expenses for the six months ended July 31, 2023 and 2022 were $166,056 and $68,327,
respectively.
Revenue
Recognition
The
Company recognizes revenue in accordance with FASB Topic 606, Revenue from Contracts with Customers (Topic 606).
The
Company’s sales are generated from the sale of finished products to customers, which contains a single performance obligation and
revenue is recognized at a single point in time when ownership, risks and rewards transfer. Typically, this occurs when the goods are
received and accepted by the customer. Revenues are recognized in an amount that reflects the net consideration the Company expects to
receive in exchange for the goods. The Company reports all amounts billed to a customer in a sale transaction as revenue. The Company
elected to treat shipping and handling activities as fulfillment activities, and the related costs are recorded as selling expenses in
selling, general and administrative expenses on the condensed consolidated statements of operations.
The
Company promotes its products with consumer incentives and trade promotions. These programs include discounts, slotting fees, coupons,
rebates, in-store display incentives and volume-based incentives. Customer trade promotion and consumer incentive activities are recorded
as a reduction to the transaction price based on amounts estimated as being due to customers and consumers at the end of a period. The
Company derives these estimates principally on historical utilization and redemption rates. The Company does not receive a distinct service
in relation to the consumer incentives and trade promotions and as a result, these incentives and promotions are accounted for as a reduction
of the transaction price.
Payment
terms in the Company’s invoices are based on the billing schedule established in contracts and purchase orders with customers.
The Company recognizes the related trade receivable when the goods are received by the customer.
Expenses
such as slotting fees, sales discounts, and allowances are accounted for as a direct reduction of revenues as follows:
Schedule
of Expenses of Slotting Fees, Sales Discounts and Allowances are Accounted as Direct Reduction of Revenues
| | |
July 31, 2023 | | |
July 31, 2022 | |
| | |
For the Three Months Ended | |
| | |
July 31, 2023 | | |
July 31, 2022 | |
| Gross Sales | |
$ | 25,414,735 | | |
$ | 23,631,857 | |
| Less: Slotting, Discounts, Allowances | |
| 624,650 | | |
| 785,383 | |
| Net Sales | |
$ | 24,790,085 | | |
$ | 22,846,474 | |
| | |
July 31, 2023 | | |
July 31, 2022 | |
| | |
For the Six Months Ended | |
| | |
July 31, 2023 | | |
July 31, 2022 | |
| Gross Sales | |
$ | 49,014,645 | | |
$ | 45,980,449 | |
| Less: Slotting, Discounts, Allowances | |
| 1,103,744 | | |
| 1,303,395 | |
| Net Sales | |
$ | 47,910,901 | | |
$ | 44,677,054 | |
Disaggregation
of Revenue from Contracts with Customers. The following table disaggregates gross revenue by significant geographic area for the
three months ended July 31, 2023 and 2022:
Schedule
of Disaggregates Gross Revenue by Significant Geographic Area
| | |
July 31, 2023 | | |
July 31, 2022 | |
| | |
For the Three Months Ended | |
| | |
July 31, 2023 | | |
July 31, 2022 | |
| Northeast | |
$ | 9,385,210 | | |
$ | 9,066,443 | |
| Southeast | |
| 7,191,911 | | |
| 6,857,963 | |
| Midwest | |
| 3,987,565 | | |
| 2,560,178 | |
| West | |
| 2,693,758 | | |
| 2,543,230 | |
| Southwest | |
| 2,156,291 | | |
| 2,604,043 | |
| Total gross sales | |
$ | 25,414,735 | | |
$ | 23,631,857 | |
The
following table disaggregates gross revenue by significant geographic area for the six months ended July 31, 2023 and 2022:
| | |
July 31, 2023 | | |
July 31, 2022 | |
| | |
For the Six Months Ended | |
| | |
July 31, 2023 | | |
July 31, 2022 | |
| Northeast | |
$ | 17,951,303 | | |
$ | 17,755,723 | |
| Southeast | |
| 13,887,317 | | |
| 12,365,760 | |
| Midwest | |
| 8,254,563 | | |
| 5,384,977 | |
| West | |
| 4,615,326 | | |
| 5,442,086 | |
| Southwest | |
| 4,306,136 | | |
| 5,031,903 | |
| Total gross sales | |
$ | 49,014,645 | | |
$ | 45,980,449 | |
Cost
of Sales
Cost
of sales represents costs directly related to the production and manufacturing of the Company’s products. Costs include production
costs, freight-in, packaging, and print production costs.
Advertising
Costs
incurred for advertising for the Company are charged to selling, general and administrative expenses as incurred. Advertising expenses
for the three months ended July 31, 2023 and 2022 were approximately $95,000 and $119,000 respectively. Advertising expenses for the
six months ended July 31, 2023 and 2022 were $304,000 and $307,000 respectively.
Stock-Based
Compensation
The
Company accounts for stock-based compensation in accordance with ASC Topic 718, “Compensation – Stock Compensation”
(“ASC 718”), which establishes financial accounting and reporting standards for stock-based employee compensation.
It defines a fair value-based method of accounting for an employee stock option or similar equity instrument.
The
Company recognizes all forms of stock-based payments, including stock option grants, warrants and restricted stock grants, at their fair
value on the grant date, which are based on the estimated number of awards that are ultimately expected to vest.
Stock-based
payments, excluding restricted stock, are valued using a Black-Scholes option pricing model. Grants of stock-based payment awards issued
to non-employees for services rendered have been recorded at the fair value of the stock-based payment, which is the more readily determinable
value. The grants are amortized on a straight-line basis over the requisite service periods, which is generally the vesting period. If
an award is granted, but vesting does not occur, any previously recognized compensation cost is reversed in the period related to the
termination of service. Stock-based compensation expenses are included in cost of goods sold, selling general and administrative expenses,
or research and development, depending on the nature of the services provided, in the condensed consolidated statements of operations.
Stock-based payments issued to placement agents are classified as a direct cost of a stock offering and are recorded as a reduction of
additional paid in capital.
For
the three months ended July 31, 2023 and 2022, stock-based compensation related to options amounted to approximately $18,000 and $12,000,
respectively.
For
the six months ended July 31, 2023 and 2022, stock-based compensation related to options amounted to approximately $41,000 and $12,000,
respectively.
For
the three and six months ended July 31, 2023, the Company issued 19,960 shares valued at approximately $50,000 to certain employees as
compensation.
For
the six months ended July 31, 2023 and 2022, when computing fair value of stock-based payments, the Company has considered the following
variables:
Schedule
of Fair Value of Share-Based Payments
| | |
July 31, 2023 | | |
July 31, 2022 | |
| Risk-free interest rate | |
| N/A | | |
| 2.77 | % |
| Expected life of grants | |
| N/A | | |
| 7.5 years | |
| Expected volatility of underlying stock | |
| N/A | | |
| 85.74 | % |
| Dividends | |
| N/A | | |
| 0 | % |
Earnings
Per Share
Basic
net income per share attributable to common stockholders excludes dilution and is computed by dividing net income or loss attributable
to common stockholders during the period by the weighted average number of common shares outstanding during the period. Diluted net income
or loss per share reflects potential dilution and is computed by dividing net income attributable to common stockholders by the weighted
average number of common shares outstanding during the period, which is increased by the number of additional common shares that would
have been outstanding if the potential common shares had been issued. However, if the effect of any additional securities are anti-dilutive
(i.e., resulting in a higher net income per share or lower net loss per share), they are excluded from the dilutive net income computation.
The dilutive effect of stock options, warrants, and restricted stock is calculated using the treasury-stock method and the dilutive effect
of the Series B Preferred Stock is calculated using the if-converted method.
The
following table provides a reconciliation of the numerator and denominator used in computing basic and diluted net income attributable
to common stockholders per common share.
Schedule
of Earnings Per Share, Basic and Diluted
| | |
July 31, 2023 | | |
July 31, 2022 | |
| | |
For the Three Months Ended | |
| | |
July 31, 2023 | | |
July 31, 2022 | |
| Numerator: | |
| | | |
| | |
| Net (loss) income attributable to common stockholders | |
$ | 1,722,678 | | |
| (743,246 | ) |
| Effect of dilutive securities: | |
| 21,233 | | |
| — | |
| | |
| | | |
| | |
| Diluted net income (loss) | |
$ | 1,743,911 | | |
$ | (743,246 | ) |
| | |
| | | |
| | |
| Denominator: | |
| | | |
| | |
| Weighted average common shares outstanding – basic | |
| 36,855,181 | | |
| 35,811,087 | |
| Dilutive securities (a): | |
| | | |
| | |
| Restricted stock | |
| 251,017 | | |
| - | |
| Options | |
| 384,369 | | |
| | |
| | |
| | | |
| - | |
| | |
| | | |
| | |
| Weighted average common shares outstanding and assumed conversion – diluted | |
| 37,490,567 | | |
| 35,811,087 | |
| | |
| | | |
| | |
| Basic net (loss) income per common share | |
$ | 0.05 | | |
$ | (0.02 | ) |
| | |
| | | |
| | |
| Diluted net (loss) income per common share | |
$ | 0.05 | | |
$ | (0.02 | ) |
| | |
| | | |
| | |
| (a) – Anti-dilutive securities excluded: | |
| - | | |
| 689,000 | |
| | |
July 31, 2023 | | |
July 31, 2022 | |
| | |
For the Six Months Ended | |
| | |
July 31, 2023 | | |
July 31, 2022 | |
| Numerator: | |
| | | |
| | |
| Net (loss) income attributable to common stockholders | |
$ | 3,096,304 | | |
| (639,549 | ) |
| Effect of dilutive securities: | |
| 48,533 | | |
| — | |
| | |
| | | |
| | |
| Diluted net income | |
$ | 3,144,837 | | |
$ | (639,549 | ) |
| | |
| | | |
| | |
| Denominator: | |
| | | |
| | |
| Weighted average common shares outstanding – basic | |
| 36,628,429 | | |
| 35,785,719 | |
| Dilutive securities (a): | |
| | | |
| | |
| Restricted stock | |
| 222,280 | | |
| - | |
| Options | |
| 344,605 | | |
| - | |
| | |
| | | |
| - | |
| | |
| | | |
| | |
| Weighted average common shares outstanding and assumed conversion – diluted | |
| 37,195,314 | | |
| 35,785,719 | |
| | |
| | | |
| | |
| Basic net (loss) income per common share | |
$ | 0.09 | | |
$ | (0.02 | ) |
| | |
| | | |
| | |
| Diluted net income (loss) per common share | |
$ | 0.08 | | |
$ | (0.02 | ) |
| | |
| | | |
| | |
| (a) – Anti-dilutive securities excluded: | |
| - | | |
| 689,000 | |
Income
Taxes
Income
taxes are provided in accordance with ASC 740, “Accounting for Income Taxes”. A deferred tax asset or liability is
recorded for all temporary differences between financial and tax reporting and net operating loss carryforwards. Deferred tax expense
results from the net change during the period of deferred tax assets and liabilities.
Deferred
tax assets are reduced by a valuation allowance when, in the opinion of management, it is more likely than not that some portion or all
of the deferred tax assets will not be realized. Deferred tax assets are adjusted for the effects of changes in tax laws and rates on
the date of enactment. As of July 31, 2023 and January 31, 2023, the Company recognized a deferred tax asset of $67,908 and $717,559,
respectively, which is included in other long-term assets on the condensed consolidated balance sheets. The Company regularly evaluates
the need for a valuation allowance related to the deferred tax asset.
Recent
Accounting Pronouncements
In
August 2020, the FASB issued ASU No. 2020-06, Accounting for Convertible Instruments and Contracts in an Entity’s Own Equity
(“ASU 2020-06”), which simplifies an issuer’s accounting for convertible instruments by reducing the number of
accounting models that require separate accounting for embedded conversion features. ASU 2020-06 also simplifies the settlement assessment
that entities are required to perform to determine whether a contract qualifies for equity classification and makes targeted improvements
to the disclosures for convertible instruments and earnings-per-share (EPS) guidance. This update will be effective for the Company’s
fiscal years beginning after December 15, 2023, and interim periods within those fiscal years. Early adoption is permitted, but no earlier
than fiscal years beginning after December 15, 2020, and interim periods within those fiscal years. Entities can elect to adopt the new
guidance through either a modified retrospective method of transition or a fully retrospective method of transition. The adoption of
the new standard is not expected to have a significant impact on the Company’s consolidated financial statements.
Management
does not believe that any recently issued, but not yet effective accounting pronouncements, when adopted, will have a material effect
on the accompanying consolidated financial statements.
Note
3 – Property Plant and Equipment:
Property
plant and equipment on July 31, 2023 and January 31, 2023 are as follows:
Schedule of Property and Equipment
| | |
July
31, 2023 | | |
January 31, 2023 | |
| Machinery and Equipment | |
$ | 3,669,137 | | |
$ | 5,387,255 | |
| Furniture and Fixtures | |
| 236,645 | | |
| 284,781 | |
| Leasehold Improvements | |
| 2,841,159 | | |
| 3,480,061 | |
| Property and Equipment, Gross | |
| 6,746,941 | | |
| 9,152,097 | |
| Less: Accumulated Depreciation | |
| 2,679,293 | | |
| 5,729,001 | |
| Total | |
$ | 4,067,648 | | |
$ | 3,423,096 | |
Depreciation
expense for the three months ended July 31, 2023 and 2022 amounted to $263,176 and $192,297, respectively. Depreciation expense for the
six months ended July 31, 2023 and 2022 amounted to $511,589 and $401,126, respectively.
Note
4 – Acquisition of CIF
As
described in Note 1, on June 28, 2023, the Company completed the CIF Acquisition. The acquisition of the remaining interest in CIF was
accounted for as an asset acquisition as substantially all of the fair value was concentrated in customer relationships. CIF’s
assets (except for cash and working capital) were measured and recognized as an allocation of the transaction price based on their relative
fair values as of the transaction date. The fair value of total consideration was $5,216,828. The following table is a summary of the
purchase price calculation.
Schedule
of Purchase Price Calculation
| | |
| | |
| Cash transferred upon acquisition | |
| 950,000 | |
| Related party debt issued upon acquisition | |
| 2,700,000 | |
| Sub-total | |
| 3,650,000 | |
| Carrying value of the Company’s equity method investment in CIF | |
| 1,566,828 | |
| Total purchase price | |
| 5,216,828 | |
The
allocation of the purchase price was as follows (amounts in thousands):
Schedule
of Allocation of Purchase Price
| | |
| | |
| Cash and cash equivalents | |
$ | 304,359 | |
| Net working capital (excluding cash) | |
| 356,848 | |
| Customer relationships | |
| 4,555,621 | |
| Net assets acquired | |
$ | 5,216,828 | |
Note
5 – Intangible assets, net
Intangible
assets, net consisted of the following at July 31, 2023:
Schedule of Intangibles Assets
| | |
Gross Carrying Amount | | |
Accumulated Amortization | | |
Net Carrying Amount | | |
Weighted Average Remaining Life (years) | |
| Software | |
$ | 87,639 | | |
$ | (87,639 | ) | |
$ | - | | |
| - | |
| Customer relationships | |
| 6,417,621 | | |
| (700,666 | ) | |
| 5,716,955 | | |
| 3.79 | |
| Tradename and trademarks | |
| 79,000 | | |
| (41,773 | ) | |
| 37,227 | | |
| 1.41 | |
| | |
$ | 6,584,260 | | |
$ | (830,078 | ) | |
$ | 5,754,182 | | |
| | |
Intangibles,
net consisted of the following at January 31, 2023:
| | |
Gross Carrying Amount | | |
Accumulated Amortization | | |
Net Carrying Amount | | |
Weighted Average Remaining Life | |
| Software | |
$ | 87,639 | | |
$ | (87,639 | ) | |
$ | - | | |
| - | |
| Customer relationships | |
| 1,862,000 | | |
| (409,776 | ) | |
| 1,452,224 | | |
| 3.41 | |
| Tradename and trademarks | |
| 79,000 | | |
| (28,714 | ) | |
| 50,286 | | |
| 1.91 | |
| | |
$ | 2,028,639 | | |
$ | (526,129 | ) | |
$ | 1,502,510 | | |
| | |
As
described in Note 1 and 4, on June 28, 2023, the Company completed the CIF Acquisition which resulted in the recognition of Customer
relationships in the amount of $4,555,621.
Amortization
expense for the three and six months ended July 31, 2023 was $202,053 and $303,949, respectively.
Amortization
expense for the three and six months ended July 31, 2022 was $116,986 and $ 230,156, respectively.
We
expect the estimated aggregate amortization expense for each of the five succeeding fiscal years to be as follows:
Schedule of Estimated Aggregate Amortization Expense
| | |
| | |
| 2024 (Remaining) | |
$ | 768,954 | |
| 2025 | |
| 1,538,766 | |
| 2026 | |
| 1,513,238 | |
| 2027 | |
| 1,466,741 | |
| 2028 | |
| 466,483 | |
| Total | |
$ | 5,754,182 | |
Note
6 – Related Party Transactions
Promissory
Note – Related Party
Upon
consummation of the acquisition of T&L and Olive Branch on December 29, 2021, the Company executed a $3,000,000 promissory note with
the sellers. The promissory note requires annual principal payments of $750,000 payable on each anniversary of the closing, together
with accrued interest at a rate of three and one-half (3.5%) per annum. As of July 31, 2023 and January 31, 2023, the outstanding balance
under the note was $2,250,000, respectively, of which $750,000 is recorded as Promissory notes – related parties and $1,500,000
is recorded as Promissory notes – related parties, net of current in the Company’s Condensed Consolidated Balance Sheets.
For the three and six months ended July 31, 2023 interest expense for this note was $20,137 and $39,451 respectively. For the three and
six months ended July 31, 2022 interest expense for this note was $27,237 and $53,356 respectively. As of July 31, 2023 and January 31,
2023, accrued interest was $46,140 and $6,688, respectively.
As
part of the purchase price of the remaining interest in CIF, the Company agreed to pay $600,000
to each Seller in cash by bank check(s) or wire transfer(s), without interest, on the first anniversary of the closing date and
$750,000
shall be paid by the Company to each seller in common stock of the Company, without interest, on the second anniversary of the
Closing Date. As of July 31, 2023 $1,200,000
is recorded as Promissory notes – related parties and $1,500,000
is recorded as Promissory notes – related parties, net of current in the Company’s Condensed Consolidated Balance
Sheet.
Lease
– Related Party
The
Company leases a fully contained facility in Farmingdale, NY from 148 Allen Blvd LLC for production and distribution of T&L
Creative Salads and Olive Branch products. 148 Allen Blvd LLC is owned by Anthony Morello, Jr., President of T&L and various
individuals related to Mr. Morello. This lease term is through November
30, 2031 with the
option to extend the lease for two additional ten-year terms with base rent of $20,200
per month through December 31, 2026, increasing after that date to $23,567
through the end of the initial lease term. The exercise of optional renewal is uncertain and therefore excluded from the calculation
of the right of use asset. Rent expense and other ancillary charges pursuant to the lease for the three and six months ended July
31, 2023 was $105,691
and $171,299,
respectively. Rent expense and other ancillary charges pursuant to the lease for the three and six months ended July 31, 2022 was
$65,608 and $131,216, respectively.
Chef
Inspirational Foods, LLC – Related Party
As
noted above in Note 1, the Company owned a 24% minority interest in CIF (until June 28, 2023). For the period from May 1, 2023 to June
28,2023 and the period from February 1, 2023 to June 28, 2023, the Company recorded sales of $4,349,203 and $10,889,277 with CIF. As
of January 31, 2023, the Company had an account receivable balance with CIF of $1,449,009. On June 28, 2023 the Company acquired the
remaining interest in CIF (refer to Note 1 and 4).
Note
7 – Loan and Security Agreements
M&T
Bank
The
Company has a working capital line with M&T Bank (the “Credit Agreement”) with total available borrowings of $5.5 million.
On July 18, 2023 the Company extended the maturity of the working capital line from June 30, 2024 to October 31, 2025. Interest is payable
on the unpaid principal amount of the Loan at a variable rate per annum based on the Company’s Senior Funded Debt/EBITDA Ratio
(as defined in the Credit Agreement) as of the date of any advance under the Credit Agreement as follows: if the Senior Funded Debt/EBITDA
ratio is: (i) greater than 2.25, 3.87 percentage point(s) above one-day (i.e., overnight) SOFR (as defined); (ii) greater than 1.50 but
less than or equal to 2.25, 3.37 percentage points above one-day SOFR; or (iii) 1.50 or less, 2.87 percentage points above one-day SOFR.
In all events set forth at subsections (i) through (iii) in the preceding sentence, if SOFR shall at any time be less than 0.25%, one-day
SOFR shall be deemed to be 0.25% and the foregoing margins shall be applied to the SOFR Index Floor. The Credit Agreement is secured
by a first priority security interest in all of the Company’s business assets and is further subject to various affirmative and
negative financial covenants. The Company was in compliance with the covenants as of July 31, 2023 and January 31, 2023. Advances under
the line of credit are limited to eighty percent (80%) of eligible accounts receivable (which is subject to an agreed limitation and
is further subject to certain asset concentration provisions) and fifty percent (50%) of eligible inventory (which is subject to an agreed
dollar limitation). All advances under the line of credit are due upon maturity. The outstanding balance on the line of credit was $500,000
and $890,000 as of July 31, 2023 and January 31, 2023, respectively. During the three months ended July 31, 2023 and 2022, the Company
incurred interest of $26,244 and $32,943, respectively, pursuant to borrowings under the Credit Agreement. During the six months ended
July 31, 2023 and 2022, the Company incurred interest of $46,776 and $49,053, respectively, pursuant to borrowings under the Credit Agreement.
On
December 29, 2021, the Company entered into a Multiple Disbursement Term Loan with M&T Bank, which was amended and restated on October
26, 2022, for the original principal amount of $7,500,000 payable in equal monthly principal installments over a 60-month amortization
period (the “Term Loan Agreement”). The maturity date of the Term Loan Agreement is January 17, 2027. Interest is payable
on the unpaid principal under the Term Loan Agreement at a variable rate per annum based on the Company’s Senior Funded Debt/EBITDA
Ratio (as defined in the Term Loan Agreement) as of the date of any advance under the Term Loan Agreement as follows: if the Senior Funded
Debt/EBITDA ratio is: (i) greater than 2.25, 4.12 percentage point(s) above the Variable Loan Rate (as defined in the agreement); (ii)
greater than 1.50 but less than or equal to 2.25, 3.62 percentage points above Variable Loan Rate; or (iii) less than or equal to 1.50,
3.12 percentage points above applicable Variable Loan Rate. In all events set forth at subsections (i) through (iii) in the preceding
sentence, if SOFR shall at any time be less than 0.25%, one-day SOFR shall be deemed to be 0.00% and the foregoing margins shall be applied
to the Variable Loan Rates. All disbursements available under the Term Loan Agreement have been previously made. As of July 31, 2023,
the outstanding balance and unamortized discount of the Term Loan Agreement was $5,431,042 and $49,022, respectively. As of January 31,
2023, the outstanding balance and unamortized discount of the Acquisition Note was $6,206,905 and $60,082, respectively. During the three
and six months ended July 31, 2023, the Company incurred interest of $117,606 and $237,315 for the Acquisition Note, respectively. During
the three and six months ended July 31, 2022, the Company incurred interest of $73,484 and $148,606 for the Acquisition Note, respectively.
Note
8 – Concentrations
Revenues
For
the six months ended July 31, 2023, the Company’s revenue was concentrated in three customers that accounted for approximately
22%, 13%, and 11% of gross revenue, respectively. For the six months ended July 31, 2022, the Company’s revenue was concentrated
in three customers that accounted for approximately 24%, 13%, and 12% respectively, of gross revenue.
For
the three months ended July 31, 2023, the Company’s revenue was concentrated in three customers that accounted for approximately
18%, 17%, and 10% of gross revenue, respectively. For the three months ended July 31, 2022, the Company’s revenue was concentrated
in three customers that accounted for approximately 23%, 14%, and 12% respectively, of gross revenue.
Receivables
As
of July 31, 2023 one customer represented approximately 40% of the total gross outstanding receivables. As of January 31, 2023, three
customers represented approximately 20%, 15% and 11%, totaling 46%, of total gross outstanding receivables, respectively.
Note
9 – Stockholders’ Equity
Preferred
Stock and Series A Preferred Stock
The
Company is authorized to issue 20,000,000 shares of Preferred Stock, $0.00001 par value per share. The Company has designated 120,000
shares of Preferred Stock as Series A Convertible Preferred stock. As of July 31, 2023 and January 31, 2023, no shares of Series A Convertible
Preferred Stock are issued and outstanding. The Company has designated 200,000 shares of preferred stock, Series B Preferred Stock.
Series
B Preferred Stock
The
holders of the Series B Preferred Stock shall be entitled to receive, upon liquidation, dissolution or winding up of the Company, the
original issue price, plus any dividends declared but unpaid or the amount of cash, securities or other property to which such holder
would be entitled to receive with respect to such shares of Series B Preferred Stock if such shares had been converted to common stock
immediately prior to such liquidation.
Holders
of the Series B Preferred Stock were entitled to receive cumulative cash dividends at an annual rate of eight percent (8%). Holders of
the Series B Preferred Stock had no voting rights. Each share of Series B Preferred Stock was convertible, at the option of the holder,
into shares of common stock at a rate of 1 share of Series B Preferred Stock into 15 shares of common stock. The Company was able to
force conversion at $2.00 per share of Common Stock at any time after six (6) months after issue if the Common Stock has a closing price
of $2.00 or higher in any 20 consecutive trading days. After 18 months, the Company could force holders to convert at a 20% discount
to the most recent 20-day average closing price per share. The Company also has the right to cause a conversion following a Fundamental
Change.
On
September 13, 2022, the Company closed the first round of the Series B Preferred Stock offering with the sale of 47,200 shares, raising
gross proceeds of $1,180,000. On November 17, 2022, the company held a final closing of its offering of Series B Preferred Stock, wherein
it sold an additional 7,400 shares of Series B. Preferred Stock for gross proceeds of $185,000
As
of January 31, 2023 there were 54,600 shares of Series B Preferred Stock outstanding. On June 22, 2023, all the holders of the Series
B Preferred Stock converted the shares of Series B Preferred Stock into 819,000 shares of Common Stock of the Company. As of July 31,
2023, no shares of Series B Preferred Stock remain outstanding.
During
the three months ended July 31, 2023 and 2022, the Company paid dividends of $21,233 and $0, respectively.
During
the six months ended July 31, 2023 and 2022, the Company paid dividends of $48,533 and $0 respectively.
Restricted
Stock Units
During
the six months ended July 31, 2023, the Company awarded 39,733 restricted stock units (“RSUs”) to certain employees with
an aggregate grant date fair value of $70,000. The RSUs will be expensed over the requisite service period. The terms of the RSUs include
vesting provisions based solely on continued service. If the service criteria is satisfied, the RSUs will vest in equal installments
over a three-year period.
The
following is a summary of the Company’s restricted stock units activity:
Schedule
of Restricted Stock Option Activity
| | |
Restricted Stock Units | | |
Weighted Average Exercise Price | |
| Unvested – February 1, 2023 | |
| 367,647 | | |
$ | 1.36 | |
| Granted | |
| 39,773 | | |
$ | 1.76 | |
| Vested | |
| - | | |
$ | - | |
| Forfeited | |
| - | | |
$ | - | |
| Outstanding – July 31, 2023 | |
| 407,420 | | |
$ | 1.40 | |
During
the three and six months ended July 31, 2023, the Company
recognized stock-based compensation related to restricted stock units of an aggregate of $37,083 and $69,612, respectively, which was
recorded to selling, general and administrative expense on the Condensed Consolidated Statement of Operations, and
there was unrecognized stock-based compensation of $449,960 as of July 31, 2023 related
to future vesting of restricted stock units.
Options
The
following is a summary of the Company’s option activity:
Summary
of Option Activity
| | |
Options | | |
Weighted Average Exercise Price | | |
Weighted Average Remaining Contractual Life (in years) | | |
Aggregate Intrinsic Value | |
| Outstanding – February 1, 2023 | |
| 689,000 | | |
$ | 0.77 | | |
| 2.95 | | |
$ | 544,760 | |
| Granted | |
| - | | |
$ | - | | |
| | | |
| | |
| Exercised | |
| 206,000 | | |
$ | 0.40 | | |
| | | |
| | |
| Expired/forfeited | |
| - | | |
| - | | |
| | | |
| | |
| Outstanding – July 31, 2023 | |
| 483,000 | | |
$ | 0.92 | | |
| 2.68 | | |
$ | 1,347,410 | |
| Exercisable – July 31, 2023 | |
| 370,500 | | |
$ | 0.75 | | |
| 1.55 | | |
$ | 1,096,535 | |
During
the three months ended July 31, 2023, there were 6,000 options exercised at a weighted average exercise price of $1.38 per share and
resulted in the issuance of 6,000 shares of common stock. The Company received $8,280 for the exercise of these options.
During
the six months ended July 31, 2023, there were 206,000 options exercised at a weighted average exercise price of $0.40 per share and
resulted in the issuance of 172,920 shares of common stock. The Company received $27,780 for the exercise of these options, as a portion
of the options were cashless exercised.
For
the six months ended July 31, 2023 and 2022, the Company recognized stock-based compensation related to options of an aggregate of $40,561
and $12,333, respectively, which is included in selling, general and administrative expenses on the accompanying consolidated statements
of operations. At July 31, 2023, there was unrecognized stock-based compensation related to the issuance of options of $79,928.
Warrants
The
following is a summary of the Company’s warrant activity:
Schedule
of Warrants Activity
| | |
Warrants | | |
Weighted Average Exercise Price | |
| Outstanding – February 1, 2023 | |
| 13,650 | | |
$ | 2.25 | |
| Exercisable – February 1, 2023 | |
| 13,650 | | |
$ | 2.25 | |
| Granted | |
| - | | |
$ | | |
| Exercised | |
| 13,650 | | |
$ | - | |
| Outstanding – July 31, 2023 | |
| - | | |
$ | - | |
| Exercisable – July 31, 2023 | |
| - | | |
$ | - | |
During
the three months ended July 31, 2023, the Company issued 13,650 shares of common stock upon the cashless exercise of the warrants.
Note
10 - Commitments and Contingencies
Litigation,
Claims and Assessments
From
time to time, the Company may become involved in various lawsuits and legal proceedings, which arise in the ordinary course of business.
Litigation is subject to inherent uncertainties, and an adverse result in these or other matters may arise from time to time that may
harm its business. The Company is currently not aware of any such legal proceedings or claims that they believe will have, individually
or in the aggregate, a material adverse effect on its business, financial condition or operating results.
Licensing
and Royalty Agreements
On
March 1, 2010, the Company was assigned a Development and License agreement, dated January 1, 2009, with Daniel Dougherty (the “License
Agreement”). Under the terms of the License Agreement the licensor shall exclusively develop for the Company a line of beef meatballs
with sauce, turkey meatballs with sauce and other similar meats and sauces for commercial manufacture, distribution and sale (each a
“Licensor Product” and collectively the “Licensor Products”). Licensor shall work with the Company to develop
Licensor Products that are acceptable to the Company. Upon acceptance of a Licensor Product by Licensee, Licensor’s trade secret
recipes, formulas methods and ingredients for the preparation and production of such Licensor Products (the “Recipes”) shall
be subject to the License Agreement.
The
exclusive term began on January 1, 2009 (the “Effective Date”) and ends on the 50th anniversary of the Effective Date.
The
royalty rate payable by the Company is: 6%
of net sales up to $500,000
of net sales (as defined in the agreement) for each year under the License Agreement; 4%
of net sales from $500,000
up to $2,500,000
of net sales for each year under the License Agreement; 2%
of net sales from $2,500,000
up to $20,000,000
of net sales for each year under the License Agreement; and 1%
of net sales in excess of $20,000,000
of net sales for each year under the License Agreement.
In
order to continue exclusivity, the Company shall pay a minimum royalty of $125,000 each year.
The
Company incurred approximately $129,000 and $125,000 of royalty expenses for the three months ended July 31, 2023 and 2022, respectively.
The Company incurred approximately $318,000 and $275,000 of royalty expenses for the six months ended July 31, 2023 and 2022, respectively.
Royalty expenses are included in selling, general and administrative expenses on the Condensed Consolidated Statements of Operations.
Note
11 –Leases
We
account for leases in accordance with ASC 842 “Leases” (“ASC 842”). We determine whether an arrangement is a
lease at inception. This determination generally depends on whether the arrangement conveys the right to control the use of an identified
fixed asset explicitly or implicitly for a period of time in exchange for consideration.
We
have operating leases for offices and other facilities used for our operations. We also have finance leases comprised primarily of machinery
and equipment. Our leases have remaining lease terms of approximately 1 year to 8.25 years.
Supplemental
cash flow and other information related to leases was as follows:
Schedule
of Supplemental Cash Flow and Other Information Related to Leases
| | |
July 31, 2023 | | |
July 31, 2022 | |
| Cash paid for amounts included in the measurement of lease liabilities | |
| | | |
| | |
| Operating cash flows from operating leases | |
$ | (134,862 | ) | |
$ | (176,534 | ) |
| Financing cash flows from finance leases | |
| (92,724 | ) | |
| (130,626 | ) |
The
following table shows the weighted average lease term and weighted average discount rate for our ROU assets:
| | |
July 31, 2023 | | |
January 31, 2023 | |
| Weighted average remaining lease term (in years) | |
| | | |
| | |
| Operating leases | |
| 7.00 | | |
| 7.50 | |
| Finance leases | |
| 4.28 | | |
| 2.60 | |
| | |
| | | |
| | |
| Weighted average discount rate: | |
| | | |
| | |
| Operating leases | |
| 4.85 | % | |
| 4.85 | % |
| Finance Leases | |
| 5.86 | % | |
| 3.41 | % |
Maturities
of lease liabilities for each of the succeeding fiscal years are as follows:
Schedule
of Future Minimum Payments Required Under Maturities of Lease Liabilities
| For the Twelve months ended January 31, | |
| |
| 2024 | |
$ | 486,910 | |
| 2025 | |
| 951,205 | |
| 2026 | |
| 847,464 | |
| 2027 | |
| 691,145 | |
| 2028 | |
| 713,501 | |
| Thereafter | |
| 1,454,059 | |
| Total lease payments | |
$ | 5,144,284 | |
| Less: amounts representing interest | |
| (748,544 | ) |
| Total lease obligations | |
$ | 4,395,740 | |
Note
12 - Income Tax Provision
The
Company’s effective tax rate for the three and six months ending July 31, 2023 is 19.8% and 23.2%. Differences with statutory rate
primarily relate to state taxes. Deferred tax assets are net operating loss carryforwards and other assets.
Deferred
taxes are caused primarily by net operating loss carryforwards. Net Operating Losses (“NOLs”) generated in 2017 and prior
years can be carried forward for 20 years. NOLs generated in 2018 – 2020, as enacted by the CARES Act, can be carried forward indefinitely.
However, NOLs generated in 2021 are also carried forward indefinitely but limited to 80% of taxable income.
In
assessing the realization of deferred tax assets, management considers whether it is more likely than not that some portion or all of
the deferred tax assets will not be realized. The ultimate realization of deferred tax assets is dependent upon future generation for
taxable income during the periods in which temporary differences representing net future deductible amounts become deductible. Management
considers the scheduled reversal of deferred tax liabilities, projected future taxable income and tax planning strategies in making this
assessment. There was no valuation allowance as of July 31, 2023 or January 31, 2023.
The
Company evaluated the provisions of ASC 740 related to the accounting for uncertainty in income taxes recognized in an enterprise’s
financial statements. ASC 740 prescribes a comprehensive model for how a company should recognize, present, and disclose uncertain positions
that the Company has taken or expects to take in its tax return. For those benefits to be recognized, a tax position must be more-likely-than-not
to be sustained upon examination by taxing authorities. Differences between tax positions taken or expected to be taken in a tax return
and the net benefit recognized and measured pursuant to the interpretation are referred to as “unrecognized benefits.” A
liability is recognized (or amount of net operating loss carry forward or amount of tax refundable is reduced) for unrecognized tax benefit
because it represents an enterprise’s potential future obligation to the taxing authority for a tax position that was not recognized
as a result of applying the provisions of ASC 740.
The
actual yearly tax rate will vary due to numerous factors, such as level and geographic mix of income and losses, acquisitions, investments,
intercompany transactions, our stock price, changes in our deferred tax assets and liabilities and their valuation, changes in the laws,
regulations, administrative practices, principles, and interpretations related to tax, including changes to the global tax framework
and other laws and accounting rules in various jurisdictions.
Item
2. Management’s Discussion and Analysis of Financial Condition and Results of Operations.
THE
FOLLOWING DISCUSSION OF OUR PLAN OF OPERATION AND RESULTS OF OPERATIONS SHOULD BE READ IN CONJUNCTION WITH THE FINANCIAL STATEMENTS AND
RELATED NOTES TO THE FINANCIAL STATEMENTS INCLUDED ELSEWHERE IN THIS REPORT. THIS DISCUSSION CONTAINS FORWARD-LOOKING STATEMENTS THAT
RELATE TO FUTURE EVENTS OR OUR FUTURE FINANCIAL PERFORMANCE. THESE STATEMENTS INVOLVE KNOWN AND UNKNOWN RISKS, UNCERTAINTIES AND OTHER
FACTORS THAT MAY CAUSE OUR ACTUAL RESULTS, LEVELS OF ACTIVITY, PERFORMANCE OR ACHIEVEMENTS TO BE MATERIALLY DIFFERENT FROM ANY FUTURE
RESULTS, LEVELS OF ACTIVITY, PERFORMANCE OR ACHIEVEMENTS EXPRESSED OR IMPLIED BY THESE FORWARD- LOOKING STATEMENTS. THESE RISKS AND OTHER
FACTORS INCLUDE, AMONG OTHERS, THOSE LISTED UNDER “FORWARD-LOOKING STATEMENTS” AND “RISK FACTORS” DETAILED IN
OUR MOST RECENT ANNUAL REPORT ON FORM 10-K, OTHER PRIOR COMPANY FILINGS AND THOSE INCLUDED ELSEWHERE IN THIS REPORT.
Results
of Operations for the Three Months Ended July 31, 2023 and 2022
The
following table sets forth the summary of the condensed consolidated statements of operations for the three months ended July 31, 2023
and 2022:
| | |
For the Three Months Ended | |
| | |
July 31, 2023 | | |
July 31, 2022 | |
| | |
| | |
| |
| Net Sales | |
$ | 24,790,085 | | |
$ | 22,846,474 | |
| Cost of Sales | |
$ | 17,283,847 | | |
$ | 20,119,862 | |
| Gross Profit | |
$ | 7,506,238 | | |
$ | 2,726,612 | |
| Operating Expenses | |
$ | 5,230,408 | | |
$ | 3,557,907 | |
| Other Expenses | |
$ | (179,739 | ) | |
$ | (139,483 | ) |
| Income Tax (Provision) Benefit | |
$ | (429,764 | ) | |
$ | 208,992 | |
| Income from equity method investment in Chef Inspirational Foods, LLC | |
$ | 77,584 | | |
$ | 18,540 | |
| Net Income (Loss) | |
$ | 1,743,911 | | |
$ | (743,246 | ) |
For
the three months ended July 31, 2023 and 2022, the Company reported net income of $1,743,911 and a net loss of $(743,246), respectively.
The change in net income between the three months ended July 31, 2023 and 2022 reflects strong sales, successful pricing actions, same-customer
cross-selling, product additions, normalization of costs for commodities, and as other materials, and freight efficiencies and other
improvements in manufacturing execution.
Net
sales: Net Sales increased by approximately 9% to $24,790,085 during the three months ended July 31, 2023, from $22,846,474 during
the three months ended July 31, 2022. The increase in sales is due to both volume gains and successful pricing actions. Volume gains
were driven by the acquisition of new customers, same-customer cross-selling, the acquisition of CIF, and product additions.
Cost
of sales: Cost of sales decreased by approximately 14% to $17,283,847 during the three months ended July 31, 2023, from $20,119,862
during the three months ended July 31, 2022. The decrease in cost of sales is due to improvements in procurement and manufacturing efficiencies
and normalization of costs for commodities.
Gross
Profit Margin: The gross profit margin was 30% and 12% for the three months ended July 31, 2023 and 2022, respectively. The change
in gross profits between the three months ended July 31, 2023 and 2022 is due to successful pricing actions, improvements in procurement,
manufacturing and logistics efficiencies and normalization of costs for commodities.
Operating
Expenses: Operating expenses increased by 47% during the three months ended July 31, 2023, as compared to the three months ended
July 31, 2022. Operating expenses increased as a percentage of sales to 21% in 2023 compared to 16% in 2022. The $1,672,501 increase
in total operating expenses is primarily attributable to the following:
| ● |
Payroll
and Related Expenses inclusive of stock-based compensation increased by approximately $1,000,000 related to executive and office
hires; |
| |
|
| ● |
Insurance
Expenses increased by approximately $395,000 due to the growth of the Company and increases in coverage, including enhanced cyber
security; |
| |
|
| ● |
Professional
fees and director fees increased by approximately $135,000 due to the growth of the Company and the use of consultants for upgrades
for manufacturing efficiencies as well as information technology integration; |
| |
|
| ● |
Amortization
of intangible assets increased by approximately $85,000 due to the acquisition of CIF; |
| |
|
| ● |
Commission
Expenses and Royalty Expenses decreased by approximately $39,000 due to product mix sold during the period; and |
| |
|
| ● |
Freight
related expenses decreased by approximately $220,000 due to the addition of dedicated logistics employees and capabilities |
Other
Expenses: Other expenses increased by $40,256 to $179,739 for the three months ended July 31, 2023 as compared to $139,483
for the three months ended July 31, 2022. For the three months ended July 31, 2023, other income (expenses) consisted of $181,658
in interest expense on the Company’s financing arrangements and $5,530 in amortization of debt discount partially offset by $7,449
in other income. For the three months ended July 31, 2022, other expenses consisted of $139,064 in interest expense incurred on the Company’s
financing arrangements and $3,015 in amortization of debt discount and other income of $2,596.
Results
of Operations for the Six Months Ended July 31, 2023 and 2022
The
following table sets forth the summary of the condensed consolidated statements of operations for the six months ended July 31, 2023
and 2022:
| | |
For the Six Months Ended | |
| | |
July 31, 2023 | | |
July 31, 2022 | |
| | |
| | |
| |
| Net Sales | |
$ | 47,910,901 | | |
$ | 44,677,054 | |
| Cost of Sales | |
$ | 34,033,663 | | |
$ | 38,090,179 | |
| Gross Profit | |
$ | 13,877,238 | | |
$ | 6,586,875 | |
| Operating Expenses | |
$ | 9,658,624 | | |
$ | 7,157,197 | |
| Other Expenses | |
$ | (342,663 | ) | |
$ | (267,374 | ) |
| Income Tax (Provision) Benefit | |
$ | (954,456 | ) | |
$ | 179,607 | |
| Income from equity method investment in Chef Inspirational Foods, LLC | |
$ | 223,342 | | |
$ | 18,540 | |
| Net Income (Loss) | |
$ | 3,144,837 | | |
$ | (639,549 | ) |
For
the six months ended July 31, 2023 and 2022, the Company reported net income of $3,144,837 and a net loss of $(639,549), respectively.
The change in net income between the six months ended July 31, 2023 and 2022 reflects strong sales, successful pricing actions, same-customer
cross-selling, product additions, normalization of costs for commodities, as well as other materials, and freight efficiencies and other
improvements in manufacturing execution.
Net
Sales: Net sales, net of slotting fees and discounts increased by approximately 7% to $47,910,901 during the six months ended July
31, 2023, from $44,677,054 during the six months ended July 31, 2022. The increase in sales is due to both volume gains as well as successful
pricing actions. Volume gains were driven by the acquisition of new customers, same-customer cross-selling, the acquisition of CIF, and product additions.
Cost
of sales: Cost of sales decreased by approximately 11% to $34,033,663 during the six months ended July 31, 2023, from $38,090,179
during the six months ended July 31, 2022. The decrease in cost of sales is due to improvements in procurement and manufacturing efficiencies
and normalization of costs for commodities.
Gross
Profit Margin: The gross profit margin was 29% and 15% for the six months ended July 31, 2023 and 2022, respectively. The change
in gross profits between the six months ended July 31, 2023 and 2022 is due to successful pricing actions, improvements in procurement,
manufacturing and logistics efficiencies and normalization of costs for commodities.
Operating
Expenses: Operating expenses increased by 35% during the six months ended July 31, 2023, as compared to the six months ended July
31, 2022. Operating expenses increased as a percentage of sales to 20% in 2023 compared to 16% in 2022. The $2,501,427 increase in total
operating expenses is primarily attributable to the following:
| ● |
Payroll
and Related Expenses inclusive of stock-based compensation increased by approximately $1.7 million related to executive and
office hires; |
| |
|
| ● |
Insurance
Expenses increased by approximately $469,000 due to the growth of the Company and increases in coverage, including enhanced cyber
security; |
| |
|
| ● |
Professional
fees and director fees increased by approximately $111,000 due to the growth of the Company and the use of consultants for upgrades
for manufacturing efficiencies as well as information technology integration; |
| |
|
| ● |
Amortization
of intangible assets increased by approximately $74,000 due to the acquisition of CIF; |
| |
|
| ● |
Commission
and Royalty Expenses increased by approximately $133,000 due to increased sales; and |
| |
|
| ● |
Freight
related expenses decreased by approximately $460,000 due to the addition of dedicated logistics employees and capabilities; |
Other
Expenses: Other expenses increased by $75,289 to $342,663 for the six months ended July 31, 2023 as compared to $267,374
for the six months ended July 31, 2022. For the six months ended July 31, 2023, other income (expenses) consisted of $359,052
in interest expense on the Company’s financing arrangements and $11,060 in amortization of debt discount partially offset by $27,449
in other income. For the six months ended July 31, 2022, other expenses consisted of $263,315 in interest expense incurred on the Company’s
financing arrangements and $6,655 in amortization of debt discount and $2,596 of other income.
Liquidity
and Capital Resources
We
finance our operations with internally generated funds, supplemented by credit arrangements with third parties and, potentially, capital
market financing.
Working
Capital
The
following table summarizes total current assets, liabilities and working capital at July 31, 2023 compared to January 31, 2023:
| | |
July 31, 2023 | | |
January 31, 2023 | | |
Change | |
| Current Assets | |
$ | 18,186,746 | | |
$ | 15,674,701 | | |
$ | 2,512,045 | |
| Current Liabilities | |
| 13,075,340 | | |
| 11,879,091 | | |
| 1,196,249 | |
| Working Capital | |
$ | 5,111,406 | | |
$ | 3,795,610 | | |
$ | 1,315,796 | |
As
of July 31, 2023, we had working capital of $5,111,406 as compared to working capital of $3,795,610 as of January 31, 2023, an increase
of $1,315,796. The increase in working capital is primarily attributable to an increase in cash of approximately $1,200,000, and an
increase of accounts receivables of approximately $2,000,000, partially offset by an increase in related party promissory notes of
approximately $1,200,000, a decrease in inventory of approximately $327,000 and a decrease in prepaid expenses and other current
assets of $354,000.
Long
Term Requirements
As
discussed above, as of July 31, 2023, we have $500,000 outstanding under our Credit Agreement and $5,431,042 outstanding under our Term
Loan Agreement, each with M&T Bank. The Credit Agreement and Term Loan Agreement have maturity dates of October 31, 2025 and January
17, 2027, respectively. In addition to a principal payment in December 2023, we will be required to make two additional payments of $750,000
(plus accrued interest) on each of December 29, 2024 and 2025 pursuant to promissory notes issued to the sellers of T&L and Olive
Branch, as discussed in Item 1. Note 6. We also have operating leases for offices and other facilities used for our operations, and finance
leases comprised primarily of machinery and equipment, as discussed in Note 11. Our Farmingdale, NY lease term is through November 30,
2031, with the option to extend the lease for two additional ten-year terms with base rent of $20,200 per month through December 31, 2026,
increasing after that date to $23,567 through the end of the initial lease term, refer to Item 1. Note 6 for additional information.
Cash
Flows
The
following table summarizes the key components of our cash flows for the six months ended July 31, 2023 and 2022.
| | |
For the Six Months Ended July 31, | |
| | |
2023 | | |
2022 | |
| | |
USD | | |
USD | |
| Net cash provided by operating activities | |
$ | 3,359,627 | | |
$ | 232,978 | |
| Net cash (used in) investing activities | |
| (898,494 | ) | |
| (805,547 | ) |
| Net cash (used in) provided by financing activities | |
| (1,279,340 | ) | |
| 1,618,383 | |
| Net changes in cash | |
| 1,181,793 | | |
| 1,045,814 | |
| Cash, beginning of period | |
| 4,378,383 | | |
| 850,598 | |
| Cash, end of period | |
$ | 5,560,176 | | |
$ | 1,896,412 | |
Net
cash provided by operating activities for the six months ended July 31, 2023 was $3,359,627 compared to net cash provided by
operating activities for the six months ended July 31, 2022 of $232,978. The net income (loss) for the six months ended July 31,
2023 and 2022 was $3,144,837 and $(639,549), respectively. During the six months ended July 31, 2023, net income was affected by
non-cash adjustments of $1,568,559 and by changes in operating activities which used cash of $(1,353,769). During the six months
ended July 31, 2022, net income was affected by non-cash adjustments of $679,868 offset by changes in operating
activities which provided cash of $192,659.
Net
cash used in investing activities for six months ended July 31, 2023 was $(898,494) as compared to $(805,547) for the six months ended
July 31, 2022, respectively. For the six months ended July 31, 2023, the Company used cash of $252,853 to purchase new machinery and
equipment and used $645,641 for the acquisition of the remaining interest of CIF. For the six months ended July 31, 2022, the cash used
in investing activities of $305,547 was to purchase new machinery and equipment and $500,000 was used to purchase a 24% interest in CIF.
Net
cash used in financing activities for the six months ended July 31, 2023 was $(1,279,340) as compared to $1,618,383 provided by
financing activities for the six months ended July 31, 2022. During the six months ended July 31, 2023, the Company had repayments
of $390,000 from borrowings pursuant to the line of credit, payments of the term loan and finance lease payments of $775,863, and
$92,724, respectively. In addition, during the six months ended July 31, 2023, the Company received proceeds of $27,780 for the
exercise of options. During the six months ended July 31, 2023, the Company paid dividends on the Series B Preferred stock of
$48,533. During the six months ended July 31, 2022, the Company received net proceeds of
$1,725,000 from borrowings pursuant to the line of credit and $515,000 from the sale of Series B Preferred Stock, which were offset
by payments of the term loan and finance lease payments of $517,241 and $130,626,
respectively.
Although
the expected revenue growth and control of expenses lead management to believe that it is probable that the Company’s cash resources
will be sufficient to meet its cash requirements through at least the next twelve months, based on current and projected levels of operations,
the Company may require additional funding to finance growth or achieve its strategic objectives. If such financing is required, there
can be no assurance that financing will be available in amounts or terms acceptable to the Company, if at all. In the event funding is
not available on reasonable terms, the Company might be required to change its growth strategy and/or seek funding on an alternative
basis, but there is no guarantee it will be able to do so.
Recent
Accounting Pronouncements
As
of the filing date of this report, there were no significant changes in our critical accounting estimates from those discussed in our
2023 Form 10-K. See Note 2 of Notes to Unaudited Condensed Consolidated Financial Statements for accounting pronouncements issued but
not yet adopted that may impact the Company’s consolidated financial position, earnings, cash flows or disclosures.”
Critical
Accounting Estimates and Policies
As
of the filing date of this report, there were no significant changes in our critical accounting estimates from those discussed in our
2023 Form 10-K. See Note 2 of Notes to Unaudited Condensed Consolidated Financial Statements for accounting pronouncements issued but
not yet adopted that may impact the Company’s consolidated financial position, earnings, cash flows.
Item
3. Quantitative and Qualitative Disclosures About Market Risk.
Not
applicable.
Item
4. Controls and Procedures
Disclosure
Controls and Procedures
The
Company maintains disclosure controls and procedures that are designed to ensure that information required to be disclosed in the reports
that we file or submit under the Securities Exchange Act of 1934 (as defined in Rules 13a-15(e) and 15d-15(e) under the Securities Exchange
Act of 1934), as amended (the “Exchange Act”) is recorded, processed, summarized and reported within the time periods specified
in the SEC’s rules and forms. Our disclosure controls and procedures include, without limitation, controls and procedures designed
to ensure that information required to be disclosed in the reports that we file under the Exchange Act is accumulated and communicated
to management, including our Chief Executive Officer and Chief Financial Officer, who serves as our principal executive officer and our
principal financial officer, respectively, as appropriate, to allow timely decisions regarding required disclosure. In designing and
evaluating the disclosure controls and procedures, management recognizes that any controls and procedures, no matter how well-designed
and operated, can provide only reasonable assurance of achieving the desired control objectives. Due to the inherent limitations of control
systems, not all misstatements may be detected. These inherent limitations include the realities that judgments in decision-making can
be faulty and that breakdowns can occur because of a simple error or mistake. Additionally, controls can be circumvented by the individual
acts of some persons, by collusion of two or more people, or by management override of the control. Controls and procedures can only
provide reasonable, not absolute, assurance that the above objectives have been met.
As
of July 31, 2023, we evaluated, with the participation of our management, including our Chief Executive Officer and Chief Financial Officer,
the effectiveness of our disclosure controls and procedures as defined in Rules 13a-15(e) and 15d-15(e) under the Exchange Act. Based
on that evaluation, our Chief Executive Officer and Chief Financial Officer concluded that our disclosure controls and procedures were
effective, at the reasonable assurance level, in ensuring that information required to be disclosed by us in the reports that we file
or submit under the Exchange Act is recorded, processed, summarized and reported, within the time periods specified in the SEC’s
rules and forms and is accumulated and communicated to management, including the Chief Executive Officer and Chief Financial Officer,
as appropriate to allow timely decisions regarding required disclosure.
Changes
in Internal Control over Financial Reporting
There
were no changes in our internal control over financial reporting, as such term is defined in Exchange Act Rule 13a-15, that occurred
during our last quarter to which this Quarterly Report relates that have materially affected, or are reasonably likely to materially
affect, our internal control over financial reporting.
PART
II - OTHER INFORMATION
Item
1. Legal Proceedings.
From
time to time, we may be involved in litigation incidental to the conduct of our business. We are currently not involved in any litigation
that we believe could have a material effect on our financial condition or results of operations.
Item
1A. Risk Factors.
In
addition to the other information set forth in this report, you should carefully consider the risks that could materially affect our
business, financial condition or results of operations which are discussed below and under the caption “Risk Factors” in
Part I, Item 1A of our Annual Report on Form 10-K for the year ended January 31, 2023.
Risks
Related to our Business
We
have a limited history of profitability.
Since
inception on February 22, 2010 and through January 31, 2023, we had raised approximately $22,724,000 in capital. During this same period,
we have recorded net accumulated losses totaling $(10,060,226). As of January 31, 2023, we had working capital of $3,795,610. our net
income (loss) for the two most recent fiscal years ended January 31, 2023 and January 31, 2022 have been $2,302,674 and $(251,926). Our
ability to achieve continued profitability depends upon many factors, including our ability to develop and commercialize products. There
can be no assurance that we will be able to achieve growth and profitability consistent with historical performance.
We
will need additional capital, which may be difficult to raise for a variety of reasons.
While
we believe that we have adequate financing to execute our current growth plan, in the case that we exceed our expected growth, we will
need to raise additional capital and/or significantly cut expenses and overhead in order to operate the business through such date. Currently,
we have no plan to raise additional capital, and our access to funding is always uncertain. There is no assurance that additional equity
or debt financing will be available to us when needed, on acceptable terms or even at all. In the event that we are not able to secure
financing, we may have to scale back our development plans or operations.
The
majority of our business depends on a limited number of principal customers.
Because
we depend on a limited number of customers for a significant portion of our sales, a loss of a small number of these customers could
materially adversely affect our business and financial condition. During the twelve months ended January 31, 2023, the Company earned
revenues from two customers representing approximately 25%, and 13% of gross sales. As of January 31, 2023, three customers represented
approximately 20%, 15% and 11%, of total gross outstanding receivables, respectively. During the twelve months ended January 31, 2022,
the Company earned revenues from three customers representing approximately 26%, 21% and 11% of gross sales. As of January 31, 2022,
three customers represented approximately 11%, 10% and 7% of total gross outstanding receivables. If these principal customers cease
ordering products from us, our business could be materially adversely affected.
Competitive
product and pricing pressures in the food industry and the financial condition of customers and suppliers could adversely affect our
ability to gain or maintain market share and/or profitability.
We
currently operate in the highly competitive food industry, competing with other companies that have varying abilities to withstand changing
market conditions. Any significant change in our relationship with a major customer, including changes in product prices, sales volume,
or contractual terms may impact financial results. Such changes may result because our competitors may have substantial financial, marketing,
and other resources that may change the competitive environment. If we are unable to establish economies of scale, marketing expertise,
product innovation, and category leadership positions to respond to changing market trends, or if we are unable to increase prices while
maintaining a customer base, our profitability and volume growth could be impacted in a materially adverse way. The success of our business
depends, in part, upon the financial strength and viability of our suppliers and customers. The financial condition of those suppliers
and customers is affected in large part by conditions and events that are beyond our control. A significant deterioration of their financial
condition would adversely affect our financial results.
We
face competition from companies who produce similar products and other prepared foods, many of whom have longer operating histories or
who have substantially more financial resources.
Many
of our competitors have been in business for a significantly longer period of time than we have and have learned manufacturing techniques
which can aid in efficiently producing their products. Additionally, many of these companies have successfully acquired a loyal customer
base that would be difficult for us to compete with. Such customers may be unwilling to purchase our products due to brand loyalty or
uncertainty in the highly competitive market in which we compete. In addition, if we gain traction in our particular niche of creating
gourmet prepared foods, major food companies with substantial marketing and financial resources may attempt to compete more directly
with us. In the event that such large companies do directly compete with us, our business may be adversely affected.
Our
operations are subject to regulation by the U.S. Food and Drug Administration (“FDA”), U.S. Department of Agriculture (“USDA”),
Federal Trade Commission (“FTC”) and other governmental entities and such regulations are subject to change from time to
time which could impact how we manage our production and sale of products. Federal budget cuts could result in furloughs for government
employees, including inspectors and reviewers for our supplier’s plants and products which could materially impact our ability
to manufacture regulated products.
Our
food products which are manufactured in facilities that are subject to extensive regulation by the FDA, the USDA and other national,
state, and local authorities. For example, we are subject to the Food, Drug and Cosmetic Act and regulations promulgated thereunder by
the FDA. This comprehensive regulatory program governs, among other things, the manufacturing, composition and ingredients, packaging,
and safety of food. Under this program, the FDA regulates manufacturing practices for foods through, among other things, its current
“good manufacturing practices” regulations, or GMP’s, and specifies the recipes for certain foods. Specifically, the
USDA defines “all natural” as a product that contains no artificial ingredients, coloring ingredients or chemical preservatives
and is minimally processed. The Company’s products were submitted to the USDA and approved as “all natural”. However,
should the USDA change their definition of “all natural” at some point in the future, or should the Company change its existing
recipes to include ingredients that do not meet the USDA’s definition/ of “all natural”, our results of operations
could be adversely affected.
The
FTC and other authorities regulate how we market and advertise our products, and we could be the target of claims relating to alleged
false or deceptive advertising under federal and state laws and regulations. Changes in these laws or regulations or the introduction
of new laws or regulations could increase the costs of doing business for us or our customers or suppliers or restrict our actions, causing
our results of operations to be adversely affected.
The
need for and effect of product recalls could have a material adverse impact on our business.
If
any of our products become misbranded or adulterated, we may need to conduct a product recall. The scope of such a recall could result
in significant costs incurred as a result of the recall, potential destruction of inventory, and lost sales. Should consumption of any
product cause injury and/or illness, we also may be liable for monetary damages as a result of one or more product liability judgments
against us. A significant product recall or product liability case could cause a loss of consumer confidence in our food products and
could have a material adverse effect on the value of our brand, results of operations and prospects.
We
may be subject to significant liability if the consumption of any of our products causes illness or physical harm.
The
sale of food products for human consumption involves the risk of injury or illness to consumers. Such injuries or illness may result
from inadvertent mislabeling, tampering or product contamination or spoilage. Under certain circumstances, we may be required to recall
or withdraw products, which may have a material adverse effect on our business. Even if a situation does not necessitate a recall or
market withdrawal, product liability claims may be asserted against us. If the consumption of any of our products causes, or is alleged
to have caused, a health-related illness, we may become subject to claims or lawsuits relating to such matters. Even if a product liability
claim is unsuccessful, the negative publicity surrounding any assertion that our products caused illness or physical harm could adversely
affect our reputation with existing and potential distributors, retailers and consumers and our corporate image and brand equity. Moreover,
claims or liabilities of this sort might not be covered by insurance or by any rights of indemnity or contribution that we may have against
others. A product liability judgment against us or a product recall or market withdrawal could have a material adverse effect on our
business, reputation and operating results.
The
impact of various food safety issues, environmental, legal, tax, and other regulations and related developments could adversely affect
our sales and profitability.
Our
products are subject to numerous food safety and other laws and regulations regarding the manufacturing, marketing, and distribution
of food products, particularly the USDA, and state and local agencies. These regulations govern matters such as ingredients, advertising,
taxation, relations with distributors and retailers, health and safety matters, and environmental concerns. The ineffectiveness of our
or our manufacturer’s planning and policies with respect to these matters, and the need to comply with new or revised laws or regulations
with regard to licensing requirements, trade and pricing practices, environmental permitting, or other food or safety matters, or new
interpretations or enforcement of existing laws and regulations, as well as any related litigation, may have a material adverse effect
on our sales and profitability.
Increases
in the cost and restrictions on the availability of raw materials could adversely affect our financial results.
Our
products include agricultural commodities such as tomatoes, onions, and meats and other items such as spices and flour, as well as packaging
materials such as plastic, metal, paper, fiberboard, and other materials and inputs such as water, in order to manufacture products.
The availability or cost of such commodities may fluctuate widely due to government policy and regulation, crop failures or shortages
due to plant disease or insect and other pest infestation, weather conditions, potential impact of climate change, increased demand for
biofuels, or other unforeseen circumstances. To the extent that any of the foregoing or other unknown factors increase the prices of
such commodities or materials and we are unable to increase our prices or adequately hedge against such changes in a manner that offsets
such changes, the results of its operations could be materially and adversely affected. Similarly, if supplier arrangements and relationships
result in increased and unforeseen expenses, our financial results could be materially and adversely impacted.
Disruption
of our supply chain could adversely affect our business.
Damage
or disruption to our manufacturing or distribution capabilities due to weather, natural disaster, fire, terrorism, pandemic, strikes,
the financial and/or operational instability of key suppliers, distributors, warehousing and transportation providers, or brokers, or
other reasons could impair our ability to manufacture or sell our products. To the extent that we are unable to, or cannot financially
mitigate the likelihood or potential impact of such events, or to effectively manage such events if they occur, particularly when a product
is sourced from a single location, our business and results of operations may be materially adversely affected, and additional resources
could be required to restore our supply chain.
Higher
energy costs and other factors affecting the cost of producing, transporting, and distributing our products could adversely affect our
financial results.
Rising
fuel and energy costs may have a significant impact on our cost of operations, including the manufacture, transportation, and distribution
of products. Fuel costs may fluctuate due to a number of factors outside of our control, including government policy and regulation and
weather conditions. Additionally, we may be unable to maintain favorable arrangements with respect to the manufacturing costs of our
products as a result of the rise in costs of procuring raw materials and transportation by our manufacturers. This may result in increased
expenses and negatively affect operations.
If
we fail to establish and maintain an effective system of internal control, we may not be able to report our financial results accurately
or to prevent fraud. Any inability to report and file our financial results accurately and timely could harm our reputation and adversely
impact the trading price of our common stock.
During
the course of testing our disclosure controls and procedures and internal control over financial reporting, we may identify and disclose
material weaknesses or significant deficiencies in internal control over financial reporting that will have to be remedied. Implementing
any appropriate changes to our internal control may require specific compliance training of our directors, officers and employees, entail
substantial costs to modify our existing accounting systems, and take a significant period of time to complete. Such changes may not,
however, be effective in maintaining the adequacy of our internal control over financial reporting, and any failure to maintain that
adequacy or inability to produce accurate financial statements on a timely basis could result in our financial statements being unreliable,
increase our operating costs and materially impair our ability to operate our business.
Failure
to achieve and maintain effective internal control over financial reporting could result in a loss of investor confidence in our financial
reports and could have a material adverse effect on our stock price. Additionally, failure to maintain effective internal control over
our financial reporting could result in government investigation or sanctions by regulatory authorities.
Global
economic uncertainties continue to affect consumers’ purchasing habits and customer financial stability, which may affect sales
volume and profitability on some of our products and have other impacts that we cannot fully predict.
As
a result of continuing global economic uncertainties, price-conscious consumers may replace their purchases of our premium and value-added
products with lower-cost alternatives, which could affect the price and volume of some of these products. The volume or profitability
of our products may be adversely affected if consumers are reluctant to pay a premium for higher quality foods or if they replace purchases
of our products with cheaper alternatives. Additionally, distributors and retailers may become more conservative in response to these
conditions and seek to reduce their inventories. Our results of operations depend upon, among other things, our ability to maintain and
increase sales volume with our existing distributors and retailers, to attract new consumers and to provide products that appeal to consumers
at prices they are willing and able to pay. Prolonged unfavorable economic conditions may have an adverse effect on our sales and profitability.
We
rely on key personnel and, if we are unable to retain or motivate key personnel or hire qualified personnel, we may not be able to grow
effectively.
Our
success depends in large part upon the abilities and continued service of our executive officers and other key employees, particularly
Mr. Adam L. Michaels, our Chief Executive Officer and Chairman and Anthony Gruber, our Chief Financial Officer. There can be no assurance
that we will be able to retain the services of such officers and employees. Our failure to retain the services of our key personnel could
have a materially adverse effect on our business. In order to support our projected growth, we will be required to effectively recruit,
hire, train and retain additional qualified management personnel. Our inability to attract and retain necessary personnel could have
a materially adverse effect on our business.
The
failure of new product or packaging introductions to gain trade and consumer acceptance and address changes in consumer preferences could
adversely affect our sales.
Our
success is dependent upon anticipating and reacting to changes in consumer preferences, including health and wellness. There are inherent
marketplace risks associated with new product or packaging introductions, including uncertainties about trade and consumer acceptance.
Moreover, success is dependent upon our ability to identify and respond to consumer trends through innovation. We may be required to
increase expenditures for new product development and there is no guarantee that we will be successful in developing new products or
improving upon products already in existence. Additionally, our new products may not achieve consumer acceptance and could materially
negatively impact sales.
Changes
in our promotional activities may impact, and may have a disproportionate effect on, our overall financial condition and results of operations.
We
offer a variety of sales and promotion incentives to our customers and to consumers, such as price discounts, consumer coupons, volume
rebates, cooperative marketing programs, slotting fees and in-store displays. Our net sales may periodically be influenced by the introduction
and discontinuance of sales and promotion incentives. Reductions in overall sales and promotion incentives could impact our net sales
and affect our results of operations in any particular fiscal quarter.
We
may not be able to successfully implement our growth strategy on a timely basis or at all.
Our
future success depends, in large part, on our ability to implement our growth strategy of expanding distribution and improving placement
of our products, attracting new consumers to our brand and introducing new product lines and product extensions. Our ability to implement
this growth strategy depends, among other things, on our ability to:
| |
● |
enter
into distribution and other strategic arrangements with third-party retailers and other potential distributors of our products; |
| |
|
|
| |
● |
continue
to compete in conventional grocery and mass merchandiser retail channels in addition to the natural and organic channel; |
| |
|
|
| |
● |
secure
shelf space in key supermarket locations; |
| |
|
|
| |
● |
increase
our brand awareness; |
| |
|
|
| |
● |
expand
and maintain brand loyalty; and |
| |
|
|
| |
● |
develop
new product lines and extensions. |
We
may not be able to successfully implement our growth strategy. Our sales and operating results will be adversely affected if we fail
to implement our growth strategy or if we invest resources in a growth strategy that ultimately proves unsuccessful.
We
are currently selling products in supermarkets in the United States. If we are unable to expand into mass-market retailers or sell products
in a greater number of supermarkets, we will fall short of our projections and our business and financial condition would be adversely
affected.
As
a smaller supplier, we may not sell in enough bulk in certain stores and as such our products may not be placed in the most ideal locations
to catch the attention of end consumers. If we are unable to gain significant sales growth, our products may never be displayed in the
most attractive locations in stores and our sales may suffer.
We
may be unable to successfully execute our identified growth strategies or other growth strategies that we determine to pursue.
We
currently have a limited corporate infrastructure. In order to pursue growth strategies, we will need to continue to build our infrastructure
and operational capabilities. Our ability to do any of these successfully could be affected by any one or more of the following factors:
| |
● |
our
ability to raise substantial amounts of additional capital if needed to fund the implementation of our business plan; |
| |
|
|
| |
● |
our
ability to execute our business strategy; |
| |
|
|
| |
● |
the
ability of our products to achieve market acceptance; |
| |
|
|
| |
● |
our
ability to manage the expansion of our operations and any acquisitions we may make, which could result in increased costs, high employee
turnover or damage to customer relationships; |
| |
|
|
| |
● |
our
ability to attract and retain qualified personnel; |
| |
|
|
| |
● |
our
ability to manage our third-party relationships effectively; and |
| |
|
|
| |
● |
our
ability to accurately predict and respond to the rapid market changes in our industry and the evolving demands of the markets we
serve. |
Our
failure to adequately address any one or more of the above factors could have a significant impact on our ability to implement our business
plan and our ability to pursue other opportunities that arise.
We
may be unable to maintain quality control.
Although
we have entered into raw material supply agreements specifying certain minimum acceptable quality standards, there is no assurance that
our current quality assurance procedures will be able to effectively monitor compliance. Additionally, in the event that we expand our
operations and increase our output volume, including securing third-party manufacturers, there is no assurance that we will be able to
adequately maintain quality controls or that our current manufacturing process is scalable.
There
may be products liability and other legal claims.
We
currently carry products liability insurance policy. Although we believe that the amount of insurance coverage is sufficient for our
operations, there is no assurance that the coverage will be adequate.
Our
brand and reputation may suffer from real or perceived issues involving the labeling and marketing of our products as “natural.”
Although
the FDA and USDA have each issued statements regarding the appropriate use of the word “natural,” there is no single, U.S.
government-regulated definition of the term “natural” for use in the food industry. The resulting uncertainty has led to
consumer confusion, distrust and legal challenges. Plaintiffs have commenced legal actions against a number of food companies that market
“natural” products, asserting false, misleading and deceptive advertising and labeling claims. Should we become subject to
similar claims, consumers may avoid purchasing products from us or seek alternatives, even if the basis for the claim is unfounded. Adverse
publicity about these matters may discourage consumers from buying our products. The cost of defending against any such claims could
be significant. Any loss of confidence on the part of consumers in the truthfulness of our labeling or ingredient claims would be difficult
and costly to overcome and may significantly reduce our brand value. Uncertainty as to the ingredients used in our products, regardless
of the cause, may have a substantial and adverse effect on our brand and our business, results of operations and financial condition.
Our
finished goods inventory is located in a small number of warehouse facilities. Any damage or disruption at a storage facility would have
an adverse effect on our business, results of operations and financial condition.
Our
finished goods inventory is located in a small number of warehouse facilities. A natural disaster, fire, power interruption, work stoppage
or other unanticipated catastrophic event at these facilities would significantly disrupt our ability to deliver our products and operate
our business. If any material amount of our inventory were damaged, we would be unable to meet our contractual obligations and, as a
result, our business, results of operations and financial condition would suffer.
We
may be unable to defend our intellectual property.
Our
business could be adversely affected if we are unable to adequately protect our intellectual property. Our current intellectual property
consists of trade secret recipes and cooking processes for our products and trademarks. We rely on a combination of trademark, copyright
and trade secret laws to establish and protect our proprietary rights. We will also use technical measures to protect our proprietary
rights. We may, however, not be able to secure significant protection for service marks or trademarks that we obtain. Our inability to
protect our intellectual property from others may impede our brand identity and could lead to consumer confusion.
Our
intellectual property rights are valuable, and any inability to protect them could reduce the value of our services and brand.
Our
business is largely based upon our recipes which are trade secrets and are not patentable. We may be unable to keep other companies from
copying our recipes, or we may be subject to legal actions alleging intellectual property infringement, unfair competition or similar
claims against us. Companies may have intellectual property rights covering aspects of our technologies or businesses. Defending ourselves
against intellectual property infringement or similar claims would be expensive and would divert management’s attention. Additionally,
there is no assurance that we would be successful in defending ourselves against such claims.
Risks
Related To Our Securities
We
currently have a limited trading volume, which can result in higher price volatility for, and reduced liquidity of, our common stock.
Our
shares of common stock traded on the OTCQB from 2013 to July 2021 and on the NASDAQ Capital Market from July 2021 to the present date.
While we have upgraded our listing, historically there has been limited daily volume of trading in our common stock, which has limited
the overall and perceived liquidity of our common stock on that market.
A
more active trading market for our shares may never develop or be sustained. Active trading markets generally result in lower price volatility
and more efficient execution of buy and sell orders. The absence of an active trading market increases price volatility and reduces the
liquidity of our common stock. As long as this condition continues, the sale of a significant number of shares of common stock at any
particular time could be difficult to achieve at the market prices prevailing immediately before such shares are offered and, if an active
market for our common stock does not develop, it may be difficult to sell shares without depressing the market price for the shares,
or at all. In addition, in the event that an active trading market does not develop, the price of our common stock may not be a reliable
indicator of the fair value of our common stock.
Furthermore,
if our common stock ceases to be listed on the NASDAQ Capital Market, holders may find it more difficult to dispose of, or to obtain
accurate quotations as to the market value of, our common stock, and the market value of our common stock would likely decline.
You
may experience dilution of your ownership interest because of the future issuance of additional shares of our common stock and our preferred
stock.
In
the future, we may issue our authorized but previously unissued equity securities, resulting in the dilution of the ownership interests
of our present stockholders. We are currently authorized to issue an aggregate of 270,000,000 shares of capital stock consisting of 20,000,000
shares of preferred stock, par value $0.00001 per share and 250,000,000 shares of common stock, par value $0.00001 per share.
We
may also issue additional shares of our common stock or other securities that are convertible into or exercisable for common stock in
connection with hiring or retaining employees or consultants, future acquisitions, future sales of our securities for capital raising
purposes, or for other business purposes. The future issuance of any such additional shares of our common stock or other securities may
create downward pressure on the trading price of our common stock. There can be no assurance that we will not be required to issue additional
shares, warrants or other convertible securities in the future in conjunction with hiring or retaining employees or consultants, future
acquisitions, future sales of our securities for capital raising purposes or for other business purposes, including at a price (or exercise
prices) below the price at which shares of our common stock are trading.
The
concentration of our capital stock ownership with insiders could limit your ability to influence the outcome of key transactions, including
a change of control.
Our
directors, executive officers and founding shareholders, in the aggregate, beneficially own approximately 23.4% of the outstanding shares
of our common stock, based on the number of shares outstanding as of April 26, 2023. These stockholders are able to influence or control
matters requiring approval by our stockholders, including the election of directors and the approval of mergers, acquisitions or other
extraordinary transactions. They may have interests that differ from yours and may vote in a manner that is adverse to your interests.
This concentration of ownership may have the effect of deterring, delaying or preventing a change of control of our company, could deprive
our stockholders of an opportunity to receive a premium for their common stock as part of a sale of our company and might ultimately
affect the market price of our common stock.
If
and when a larger trading market for our common stock develops, the market price of our common stock is still likely to be highly volatile
and subject to wide fluctuations, and you may be unable to resell your shares at or above the price at which you acquired them.
The
market price of our common stock is likely to be highly volatile and could be subject to wide fluctuations in response to a number of
factors that are beyond our control, including, but not limited to:
| |
● |
variations
in our revenue and operating expenses; |
| |
|
|
| |
● |
market
conditions in our industry and the economy as a whole; |
| |
|
|
| |
● |
actual
or expected changes in our growth rates or our competitors’ growth rates; |
| |
|
|
| |
● |
announcements
of innovations or new products or services by us or our competitors; |
| |
|
|
| |
● |
announcements
by the government relating to regulations that govern our industry; |
| |
|
|
| |
● |
sales
of our common stock or other securities by us or in the open market; and |
| |
|
|
| |
● |
changes
in the market valuations of other comparable companies. |
In
addition, if the market for food industry stocks or the stock market in general experiences loss of investor confidence, the trading
price of our common stock could decline for reasons unrelated to our business, financial condition or operating results. The trading
price of our shares might also decline in reaction to events that affect other companies in our industry, even if these events do not
directly affect us. Each of these factors, among others, could harm the value of your investment in our common stock. In the past, following
periods of volatility in the market, securities class-action litigation has often been instituted against companies. Such litigation,
if instituted against us, could result in substantial costs and diversion of management’s attention and resources, which could
materially and adversely affect our business, operating results and financial condition.
We
do not expect to pay dividends.
We
have never declared or paid any cash dividends or distributions on our common stock. We currently intend to retain our future earnings,
if any, to support operations and to finance expansion and therefore we do not anticipate paying any cash dividends on our common stock
in the foreseeable future.
The
declaration, payment and amount of any future dividends will be made at the discretion of the board of directors, and will depend upon,
among other things, the results of our operations, cash flows and financial condition, operating and capital requirements, and other
factors as the board of directors considers relevant. There is no assurance that future dividends will be paid, and, if dividends are
paid, there is no assurance with respect to the amount of any such dividend. If the Company does not pay dividends, the Company’s
common stock may be less valuable because a return on an investor’s investment will only occur if the Company’s stock price
appreciates.
If
securities or industry analysts do not publish research or reports about us, our business or our market, or if they change their recommendations
regarding our stock adversely, our stock price and trading volume could decline.
The
trading market for our common stock will be influenced by the research and reports that industry or securities analysts may publish about
us, our business, our market or our competitors. If any of the analysts who may cover us change their recommendation regarding our stock
adversely, or provide more favorable relative recommendations about our competitors, our stock price would likely decline. If any analyst
who may cover us were to cease coverage of our company or fail to regularly publish reports on us, we could lose visibility in the financial
markets, which in turn could cause our stock price or trading volume to decline.
Item
2. Unregistered Sales of Equity Securities and Use of Proceeds.
During
the six months ended July 31, 2023, the Company had no sales of unregistered securities.
Item
3. Defaults upon Senior Securities.
There
has been no material default in payment of principal, interest, sinking or purchase fund installment, or any other material default,
with respect to any indebtedness of the Company.
Item
4. Mine Safety Disclosures.
Not
applicable.
Item
6. Exhibits.
Exhibit
No. |
|
Description |
| |
|
|
| 3.1 |
|
Articles of Incorporation of Mama’s Creations, Inc. (incorporated by reference from Exhibit 3.1 to the Company’s Registration Statement on Form S-1 filed on May 24, 2011). |
| 3.2 |
|
Certificate of Amendment to Certificate of Incorporation of Mama’s Creations, Inc. (incorporated by reference from Exhibit 3.4 to the Company’s Current Report on Form 8-K filed on March 8, 2013). |
| 3.3 |
|
Second Amended and Restated Series A Convertible Preferred Stock Certificate of Designation (incorporated by reference from Exhibit 3.1 to the Company’s Current Report on Form 8-K filed on September 10, 2015). |
| 3.4 |
|
Series B Preferred Stock Certificate of Designation (incorporated by reference from Exhibit 3.4 to the Company’s Registration Statement on Form S-3 filed on June 2, 2023). |
| 3.5 |
|
Second Amended and Restated Bylaws of Mama’s Creations, Inc. (incorporated by reference from Exhibit 3.2 to the Company’s Current Report on Form 8-K filed on August 1, 2023). |
| 10.1 |
|
Membership Interest Purchase Agreement dated June 28, 2023 by and among the Company, Siegel Suffolk Family, LLC, R&I Loeb Family, LLC, Jeffrey Siegel, and Ronald Loeb (incorporated by reference from Exhibit 10.1 to the Company’s Current Report on Form 8-K filed on June 29, 2023). |
| 10.2 |
|
Letter Amendment to the Revolving Line of Credit Loan by and between M&T Bank, the Company and T&L Acquisition Corp.* |
| 31.1 |
|
Certification of Principal Executive Officer, pursuant to 18 U.S.C. 1350, as adopted pursuant to Section 302 of 2002* |
| 31.2 |
|
Certification of Principal Financial Officer, pursuant to 18 U.S.C. 1350, as adopted pursuant to Section 302 of 2002* |
| 32.1 |
|
Certification of Principal Executive Officer, pursuant to 18 U.S.C. 1350, as adopted pursuant to Section 906 of the Sarbanes-Oxley Act of 2002* |
| 32.2 |
|
Certification of Principal Financial Officer, pursuant to 18 U.S.C. 1350, as adopted pursuant to Section 906 of the Sarbanes-Oxley Act of 2002* |
| 101.INS |
|
Inline
XBRL Instance Document** |
| 101.SCH |
|
Inline
XBRL Taxonomy Extension Schema Document** |
| 101.CAL |
|
Inline
XBRL Taxonomy Extension Calculation Linkbase Document** |
| 101.DEF |
|
Inline
XBRL Taxonomy Extension Definition Linkbase Document** |
| 101.LAB |
|
Inline
XBRL Taxonomy Extension Label Linkbase Document** |
| 101.PRE |
|
Inline
XBRL Taxonomy Extension Presentation Linkbase Document** |
| 104 |
|
Cover
Page Interactive Data File (embedded within the Inline XBRL document) |
*
Filed herewith.
**
Furnished herewith.
SIGNATURES
In
accordance with the requirements of the Exchange Act, the registrant caused this report to be signed on its behalf by the undersigned,
thereunto duly authorized.
| |
MAMA’S
CREATIONS, INC. |
| |
|
|
| Date:
September 12, 2023 |
By: |
/s/
Adam L. Michaels |
| |
Name: |
Adam
L. Michaels |
| |
Title: |
Chief
Executive Officer |
| |
|
(Principal
Executive Officer) |
| |
|
|
| |
By: |
/s/
Anthony Gruber |
| |
Name: |
Anthony
Gruber |
| |
Title: |
Chief
Financial Officer (Principal Financial Officer) |
Exhibit 10.2
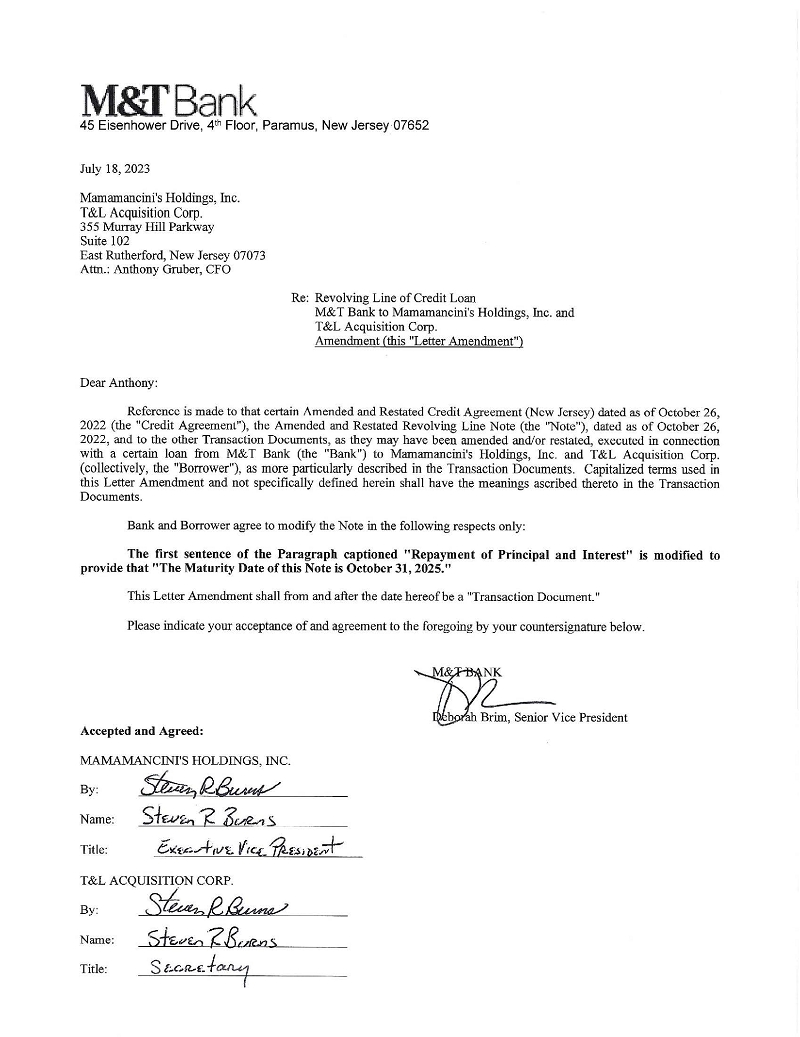
EXHIBIT
31.1
CERTIFICATION
OF PRINCIPAL EXECUTIVE OFFICER
PURSUANT
TO
18
U.S.C. SECTION 1350,
AS
ADOPTED PURSUANT TO SECTION 302 OF
THE
SARBANES-OXLEY ACT OF 2002
I,
Adam L. Michaels, certify that:
| 1. |
I
have reviewed this Form 10-Q of Mama’s Creations, Inc.; |
| |
|
| 2. |
Based
on my knowledge, this report does not contain any untrue statement of a material fact or omit to state a material fact necessary
to make the statements made, in light of the circumstances under which such statements were made, not misleading with respect to
the period covered by this report; |
| |
|
| 3. |
Based
on my knowledge, the financial statements, and other financial information included in this report, fairly present in all material
respects the financial condition, results of operations and cash flows of the registrant as of, and for, the periods presented in
this report; |
| |
|
| 4. |
The
registrant’s other certifying officer(s) and I are responsible for establishing and maintaining disclosure controls and procedures
(as defined in Exchange Act Rules 13a-15(e) and 15d-15(e)) and internal control over financial reporting (as defined in Exchange
Act Rules 13-a-15(f) and 15d-15(f)) for the registrant and have: |
| |
a) |
Designed
such disclosure controls and procedures, or caused such disclosure controls and procedures to be designed under our supervision,
to ensure that material information relating to the registrant, including its consolidated subsidiaries, is made known to us by others
within those entities, particularly during the period in which this report is being prepared; |
| |
|
|
| |
b) |
Designed
such internal control over financial reporting, or caused such internal control over financial reporting to be designed under our
supervision, to provide reasonable assurance regarding the reliability of financial reporting and the preparation of financial statements
for external purposes in accordance with generally accepted accounting principles; |
| |
|
|
| |
c) |
Evaluated
the effectiveness of the registrant’s disclosure controls and procedures and presented in this report our conclusions about
the effectiveness of the disclosure controls and procedures, as of the end of the period covered by this report based on such evaluation;
and |
| |
|
|
| |
d) |
Disclosed
in this report any change in the registrant’s internal control over financial reporting that occurred during the registrant’s
most recent fiscal quarter (the registrant’s fourth fiscal quarter in the case of an annual report) that has materially affected,
or is reasonably likely to materially affect, the registrant’s internal control over financial reporting; and |
| 5. |
The
registrant’s other certifying officer(s) and I have disclosed, based on our most recent evaluation of internal control over
financial reporting, to the registrant’s auditors and the audit committee of the registrant’s board of directors (or
persons performing the equivalent functions): |
| |
a) |
All
significant deficiencies and material weaknesses in the design or operation of internal control over financial reporting which are
reasonably likely to adversely affect the registrant’s ability to record, process, summarize and report financial information;
and |
| |
|
|
| |
b) |
Any
fraud, whether or not material, that involves management or other employees who have a significant role in the registrant’s
internal control over financial reporting. |
| Date:
September 12, 2023 |
By: |
/s/
Adam L. Michaels |
| |
|
Adam
L. Michaels |
| |
|
Principal
Executive Officer |
| |
|
Mama’s
Creations, Inc. |
EXHIBIT
31.2
CERTIFICATION
OF PRINCIPAL FINANCIAL OFFICER
PURSUANT
TO
18
U.S.C. SECTION 1350,
AS
ADOPTED PURSUANT TO SECTION 302 OF
THE
SARBANES-OXLEY ACT OF 2002
I,
Anthony Gruber, certify that:
| 1. |
I
have reviewed this Form 10-Q of Mama’s Creations, Inc.; |
| |
|
| 2. |
Based
on my knowledge, this report does not contain any untrue statement of a material fact or omit to state a material fact necessary
to make the statements made, in light of the circumstances under which such statements were made, not misleading with respect to
the period covered by this report; |
| |
|
| 3. |
Based
on my knowledge, the financial statements, and other financial information included in this report, fairly present in all material
respects the financial condition, results of operations and cash flows of the registrant as of, and for, the periods presented in
this report; |
| |
|
| 4. |
The
registrant’s other certifying officer(s) and I are responsible for establishing and maintaining disclosure controls and procedures
(as defined in Exchange Act Rules 13a-15(e) and 15d-15(e)) and internal control over financial reporting (as defined in Exchange
Act Rules 13-a-15(f) and 15d-15(f)) for the registrant and have: |
| |
a) |
Designed
such disclosure controls and procedures, or caused such disclosure controls and procedures to be designed under our supervision,
to ensure that material information relating to the registrant, including its consolidated subsidiaries, is made known to us by others
within those entities, particularly during the period in which this report is being prepared; |
| |
|
|
| |
b) |
Designed
such internal control over financial reporting, or caused such internal control over financial reporting to be designed under our
supervision, to provide reasonable assurance regarding the reliability of financial reporting and the preparation of financial statements
for external purposes in accordance with generally accepted accounting principles; |
| |
|
|
| |
c) |
Evaluated
the effectiveness of the registrant’s disclosure controls and procedures and presented in this report our conclusions about
the effectiveness of the disclosure controls and procedures, as of the end of the period covered by this report based on such evaluation;
and |
| |
|
|
| |
d) |
Disclosed
in this report any change in the registrant’s internal control over financial reporting that occurred during the registrant’s
most recent fiscal quarter (the registrant’s fourth fiscal quarter in the case of an annual report) that has materially affected,
or is reasonably likely to materially affect, the registrant’s internal control over financial reporting; and |
| 5. |
The
registrant’s other certifying officer(s) and I have disclosed, based on our most recent evaluation of internal control over
financial reporting, to the registrant’s auditors and the audit committee of the registrant’s board of directors (or
persons performing the equivalent functions): |
| |
a) |
All
significant deficiencies and material weaknesses in the design or operation of internal control over financial reporting which are
reasonably likely to adversely affect the registrant’s ability to record, process, summarize and report financial information;
and |
| |
|
|
| |
b) |
Any
fraud, whether or not material, that involves management or other employees who have a significant role in the registrant’s
internal control over financial reporting. |
| Date:
September 12, 2023 |
By:
|
/s/
Anthony Gruber |
| |
|
Anthony
Gruber |
| |
|
Principal
Financial Officer |
| |
|
Mama’s
Creations, Inc. |
EXHIBIT
32.1
CERTIFICATION
PURSUANT TO
18
U.S.C. SECTION 1350,
AS
ADOPTED PURSUANT TO SECTION 906 OF
THE
SARBANES-OXLEY ACT OF 2002
In
connection with this Quarterly Report of Mama’s Creations, Inc. (the “Company”), on Form 10-Q for the period ended
July 31, 2023, as filed with the U.S. Securities and Exchange Commission on the date hereof, I, Adam L. Michaels, Principal Executive
Officer of the Company, certify to the best of my knowledge, pursuant to 18 U.S.C. Sec. 1350, as adopted pursuant to Sec. 906 of the
Sarbanes-Oxley Act of 2002, that:
| |
(1) |
Such
Quarterly Report on Form 10-Q for the period ended July 31, 2023, fully complies with the requirements of section 13(a) or 15(d)
of the Securities Exchange Act of 1934; and |
| |
|
|
| |
(2) |
The
information contained in such Quarterly Report on Form 10-Q for the period ended July 31, 2023, fairly presents, in all material
respects, the financial condition and results of operations of the Company. |
| Date:
September 12, 2023 |
By:
|
/s/
Adam L. Michaels |
| |
|
Adam
L. Michaels |
| |
|
Principal
Executive Officer |
| |
|
Mama’s
Creations, Inc. |
EXHIBIT
32.2
CERTIFICATION
PURSUANT TO
18
U.S.C. SECTION 1350,
AS
ADOPTED PURSUANT TO SECTION 906 OF
THE
SARBANES-OXLEY ACT OF 2002
In
connection with this Quarterly Report of Mama’s Creations, Inc. (the “Company”), on Form 10-Q for the period ended
July 31, 2023, as filed with the U.S. Securities and Exchange Commission on the date hereof, I, Anthony Gruber, Principal Executive Officer
of the Company, certify to the best of my knowledge, pursuant to 18 U.S.C. Sec. 1350, as adopted pursuant to Sec. 906 of the Sarbanes-Oxley
Act of 2002, that:
| |
(1) |
Such
Quarterly Report on Form 10-Q for the period ended July 31, 2023, fully complies with the requirements of section 13(a) or 15(d)
of the Securities Exchange Act of 1934; and |
| |
|
|
| |
(2) |
The
information contained in such Quarterly Report on Form 10-Q for the period ended July 31, 2023, fairly presents, in all material
respects, the financial condition and results of operations of the Company. |
| Date:
September 12, 2023 |
By:
|
/s/
Anthony Gruber |
| |
|
Anthony
Gruber |
| |
|
Principal
Financial Officer |
| |
|
Mama’s
Creations, Inc. |
v3.23.2
Cover - shares
|
6 Months Ended |
|
Jul. 31, 2023 |
Sep. 11, 2023 |
| Cover [Abstract] |
|
|
| Document Type |
10-Q
|
|
| Amendment Flag |
false
|
|
| Document Quarterly Report |
true
|
|
| Document Transition Report |
false
|
|
| Document Period End Date |
Jul. 31, 2023
|
|
| Document Fiscal Period Focus |
Q2
|
|
| Document Fiscal Year Focus |
2024
|
|
| Current Fiscal Year End Date |
--01-31
|
|
| Entity File Number |
001-40597
|
|
| Entity Registrant Name |
Mama’s
Creations, Inc.
|
|
| Entity Central Index Key |
0001520358
|
|
| Entity Tax Identification Number |
27-0607116
|
|
| Entity Incorporation, State or Country Code |
NV
|
|
| Entity Address, Address Line One |
25
Branca Road
|
|
| Entity Address, City or Town |
East
Rutherford
|
|
| Entity Address, State or Province |
NJ
|
|
| Entity Address, Postal Zip Code |
07073
|
|
| City Area Code |
(201)
|
|
| Local Phone Number |
531-1212
|
|
| Title of 12(b) Security |
Common
Stock, par value $0.00001
|
|
| Trading Symbol |
MAMA
|
|
| Security Exchange Name |
NASDAQ
|
|
| Entity Current Reporting Status |
Yes
|
|
| Entity Interactive Data Current |
Yes
|
|
| Entity Filer Category |
Non-accelerated Filer
|
|
| Entity Small Business |
true
|
|
| Entity Emerging Growth Company |
false
|
|
| Entity Shell Company |
false
|
|
| Entity Common Stock, Shares Outstanding |
|
37,443,387
|
| X |
- DefinitionBoolean flag that is true when the XBRL content amends previously-filed or accepted submission.
| Name: |
dei_AmendmentFlag |
| Namespace Prefix: |
dei_ |
| Data Type: |
xbrli:booleanItemType |
| Balance Type: |
na |
| Period Type: |
duration |
|
| X |
- DefinitionEnd date of current fiscal year in the format --MM-DD.
| Name: |
dei_CurrentFiscalYearEndDate |
| Namespace Prefix: |
dei_ |
| Data Type: |
xbrli:gMonthDayItemType |
| Balance Type: |
na |
| Period Type: |
duration |
|
| X |
- DefinitionFiscal period values are FY, Q1, Q2, and Q3. 1st, 2nd and 3rd quarter 10-Q or 10-QT statements have value Q1, Q2, and Q3 respectively, with 10-K, 10-KT or other fiscal year statements having FY.
| Name: |
dei_DocumentFiscalPeriodFocus |
| Namespace Prefix: |
dei_ |
| Data Type: |
dei:fiscalPeriodItemType |
| Balance Type: |
na |
| Period Type: |
duration |
|
| X |
- DefinitionThis is focus fiscal year of the document report in YYYY format. For a 2006 annual report, which may also provide financial information from prior periods, fiscal 2006 should be given as the fiscal year focus. Example: 2006.
| Name: |
dei_DocumentFiscalYearFocus |
| Namespace Prefix: |
dei_ |
| Data Type: |
xbrli:gYearItemType |
| Balance Type: |
na |
| Period Type: |
duration |
|
| X |
- DefinitionFor the EDGAR submission types of Form 8-K: the date of the report, the date of the earliest event reported; for the EDGAR submission types of Form N-1A: the filing date; for all other submission types: the end of the reporting or transition period. The format of the date is YYYY-MM-DD.
| Name: |
dei_DocumentPeriodEndDate |
| Namespace Prefix: |
dei_ |
| Data Type: |
xbrli:dateItemType |
| Balance Type: |
na |
| Period Type: |
duration |
|
| X |
- DefinitionBoolean flag that is true only for a form used as an quarterly report. Reference 1: http://www.xbrl.org/2003/role/presentationRef
-Publisher SEC
-Name Form 10-Q
-Number 240
-Section 308
-Subsection a
| Name: |
dei_DocumentQuarterlyReport |
| Namespace Prefix: |
dei_ |
| Data Type: |
xbrli:booleanItemType |
| Balance Type: |
na |
| Period Type: |
duration |
|
| X |
- DefinitionBoolean flag that is true only for a form used as a transition report. Reference 1: http://www.xbrl.org/2003/role/presentationRef
-Publisher SEC
-Name Forms 10-K, 10-Q, 20-F
-Number 240
-Section 13
-Subsection a-1
| Name: |
dei_DocumentTransitionReport |
| Namespace Prefix: |
dei_ |
| Data Type: |
xbrli:booleanItemType |
| Balance Type: |
na |
| Period Type: |
duration |
|
| X |
- DefinitionThe type of document being provided (such as 10-K, 10-Q, 485BPOS, etc). The document type is limited to the same value as the supporting SEC submission type, or the word 'Other'.
| Name: |
dei_DocumentType |
| Namespace Prefix: |
dei_ |
| Data Type: |
dei:submissionTypeItemType |
| Balance Type: |
na |
| Period Type: |
duration |
|
| X |
- DefinitionAddress Line 1 such as Attn, Building Name, Street Name
| Name: |
dei_EntityAddressAddressLine1 |
| Namespace Prefix: |
dei_ |
| Data Type: |
xbrli:normalizedStringItemType |
| Balance Type: |
na |
| Period Type: |
duration |
|
| X |
- Definition
+ References
+ Details
| Name: |
dei_EntityAddressCityOrTown |
| Namespace Prefix: |
dei_ |
| Data Type: |
xbrli:normalizedStringItemType |
| Balance Type: |
na |
| Period Type: |
duration |
|
| X |
- DefinitionCode for the postal or zip code
| Name: |
dei_EntityAddressPostalZipCode |
| Namespace Prefix: |
dei_ |
| Data Type: |
xbrli:normalizedStringItemType |
| Balance Type: |
na |
| Period Type: |
duration |
|
| X |
- DefinitionName of the state or province.
| Name: |
dei_EntityAddressStateOrProvince |
| Namespace Prefix: |
dei_ |
| Data Type: |
dei:stateOrProvinceItemType |
| Balance Type: |
na |
| Period Type: |
duration |
|
| X |
- DefinitionA unique 10-digit SEC-issued value to identify entities that have filed disclosures with the SEC. It is commonly abbreviated as CIK. Reference 1: http://www.xbrl.org/2003/role/presentationRef
-Publisher SEC
-Name Exchange Act
-Number 240
-Section 12
-Subsection b-2
| Name: |
dei_EntityCentralIndexKey |
| Namespace Prefix: |
dei_ |
| Data Type: |
dei:centralIndexKeyItemType |
| Balance Type: |
na |
| Period Type: |
duration |
|
| X |
- DefinitionIndicate number of shares or other units outstanding of each of registrant's classes of capital or common stock or other ownership interests, if and as stated on cover of related periodic report. Where multiple classes or units exist define each class/interest by adding class of stock items such as Common Class A [Member], Common Class B [Member] or Partnership Interest [Member] onto the Instrument [Domain] of the Entity Listings, Instrument.
| Name: |
dei_EntityCommonStockSharesOutstanding |
| Namespace Prefix: |
dei_ |
| Data Type: |
xbrli:sharesItemType |
| Balance Type: |
na |
| Period Type: |
instant |
|
| X |
- DefinitionIndicate 'Yes' or 'No' whether registrants (1) have filed all reports required to be filed by Section 13 or 15(d) of the Securities Exchange Act of 1934 during the preceding 12 months (or for such shorter period that registrants were required to file such reports), and (2) have been subject to such filing requirements for the past 90 days. This information should be based on the registrant's current or most recent filing containing the related disclosure.
| Name: |
dei_EntityCurrentReportingStatus |
| Namespace Prefix: |
dei_ |
| Data Type: |
dei:yesNoItemType |
| Balance Type: |
na |
| Period Type: |
duration |
|
| X |
- DefinitionIndicate if registrant meets the emerging growth company criteria. Reference 1: http://www.xbrl.org/2003/role/presentationRef
-Publisher SEC
-Name Exchange Act
-Number 240
-Section 12
-Subsection b-2
| Name: |
dei_EntityEmergingGrowthCompany |
| Namespace Prefix: |
dei_ |
| Data Type: |
xbrli:booleanItemType |
| Balance Type: |
na |
| Period Type: |
duration |
|
| X |
- DefinitionCommission file number. The field allows up to 17 characters. The prefix may contain 1-3 digits, the sequence number may contain 1-8 digits, the optional suffix may contain 1-4 characters, and the fields are separated with a hyphen.
| Name: |
dei_EntityFileNumber |
| Namespace Prefix: |
dei_ |
| Data Type: |
dei:fileNumberItemType |
| Balance Type: |
na |
| Period Type: |
duration |
|
| X |
- DefinitionIndicate whether the registrant is one of the following: Large Accelerated Filer, Accelerated Filer, Non-accelerated Filer. Definitions of these categories are stated in Rule 12b-2 of the Exchange Act. This information should be based on the registrant's current or most recent filing containing the related disclosure. Reference 1: http://www.xbrl.org/2003/role/presentationRef
-Publisher SEC
-Name Exchange Act
-Number 240
-Section 12
-Subsection b-2
| Name: |
dei_EntityFilerCategory |
| Namespace Prefix: |
dei_ |
| Data Type: |
dei:filerCategoryItemType |
| Balance Type: |
na |
| Period Type: |
duration |
|
| X |
- DefinitionTwo-character EDGAR code representing the state or country of incorporation.
| Name: |
dei_EntityIncorporationStateCountryCode |
| Namespace Prefix: |
dei_ |
| Data Type: |
dei:edgarStateCountryItemType |
| Balance Type: |
na |
| Period Type: |
duration |
|
| X |
- DefinitionBoolean flag that is true when the registrant has submitted electronically every Interactive Data File required to be submitted pursuant to Rule 405 of Regulation S-T during the preceding 12 months (or for such shorter period that the registrant was required to submit such files). Reference 1: http://www.xbrl.org/2003/role/presentationRef
-Publisher SEC
-Name Regulation S-T
-Number 232
-Section 405
| Name: |
dei_EntityInteractiveDataCurrent |
| Namespace Prefix: |
dei_ |
| Data Type: |
dei:yesNoItemType |
| Balance Type: |
na |
| Period Type: |
duration |
|
| X |
- DefinitionThe exact name of the entity filing the report as specified in its charter, which is required by forms filed with the SEC. Reference 1: http://www.xbrl.org/2003/role/presentationRef
-Publisher SEC
-Name Exchange Act
-Number 240
-Section 12
-Subsection b-2
| Name: |
dei_EntityRegistrantName |
| Namespace Prefix: |
dei_ |
| Data Type: |
xbrli:normalizedStringItemType |
| Balance Type: |
na |
| Period Type: |
duration |
|
| X |
- DefinitionBoolean flag that is true when the registrant is a shell company as defined in Rule 12b-2 of the Exchange Act. Reference 1: http://www.xbrl.org/2003/role/presentationRef
-Publisher SEC
-Name Exchange Act
-Number 240
-Section 12
-Subsection b-2
| Name: |
dei_EntityShellCompany |
| Namespace Prefix: |
dei_ |
| Data Type: |
xbrli:booleanItemType |
| Balance Type: |
na |
| Period Type: |
duration |
|
| X |
- DefinitionIndicates that the company is a Smaller Reporting Company (SRC). Reference 1: http://www.xbrl.org/2003/role/presentationRef
-Publisher SEC
-Name Exchange Act
-Number 240
-Section 12
-Subsection b-2
| Name: |
dei_EntitySmallBusiness |
| Namespace Prefix: |
dei_ |
| Data Type: |
xbrli:booleanItemType |
| Balance Type: |
na |
| Period Type: |
duration |
|
| X |
- DefinitionThe Tax Identification Number (TIN), also known as an Employer Identification Number (EIN), is a unique 9-digit value assigned by the IRS. Reference 1: http://www.xbrl.org/2003/role/presentationRef
-Publisher SEC
-Name Exchange Act
-Number 240
-Section 12
-Subsection b-2
| Name: |
dei_EntityTaxIdentificationNumber |
| Namespace Prefix: |
dei_ |
| Data Type: |
dei:employerIdItemType |
| Balance Type: |
na |
| Period Type: |
duration |
|
| X |
- DefinitionLocal phone number for entity.
| Name: |
dei_LocalPhoneNumber |
| Namespace Prefix: |
dei_ |
| Data Type: |
xbrli:normalizedStringItemType |
| Balance Type: |
na |
| Period Type: |
duration |
|
| X |
- DefinitionTitle of a 12(b) registered security. Reference 1: http://www.xbrl.org/2003/role/presentationRef
-Publisher SEC
-Name Exchange Act
-Number 240
-Section 12
-Subsection b
| Name: |
dei_Security12bTitle |
| Namespace Prefix: |
dei_ |
| Data Type: |
dei:securityTitleItemType |
| Balance Type: |
na |
| Period Type: |
duration |
|
| X |
- DefinitionName of the Exchange on which a security is registered. Reference 1: http://www.xbrl.org/2003/role/presentationRef
-Publisher SEC
-Name Exchange Act
-Number 240
-Section 12
-Subsection d1-1
| Name: |
dei_SecurityExchangeName |
| Namespace Prefix: |
dei_ |
| Data Type: |
dei:edgarExchangeCodeItemType |
| Balance Type: |
na |
| Period Type: |
duration |
|
| X |
- DefinitionTrading symbol of an instrument as listed on an exchange.
| Name: |
dei_TradingSymbol |
| Namespace Prefix: |
dei_ |
| Data Type: |
dei:tradingSymbolItemType |
| Balance Type: |
na |
| Period Type: |
duration |
|
v3.23.2
Condensed Consolidated Balance Sheets - USD ($)
|
Jul. 31, 2023 |
Jan. 31, 2023 |
| Current Assets: |
|
|
| Cash |
$ 5,560,176
|
$ 4,378,383
|
| Accounts receivable, net |
8,843,756
|
6,832,046
|
| Inventories, net |
3,308,513
|
3,635,881
|
| Prepaid expenses and other current assets |
474,301
|
828,391
|
| Total current assets |
18,186,746
|
15,674,701
|
| Property, plant, and equipment, net |
4,067,648
|
3,423,096
|
| Intangible assets, net |
5,754,182
|
1,502,510
|
| Goodwill |
8,633,334
|
8,633,334
|
| Operating lease right of use assets, net |
3,124,449
|
3,236,690
|
| Deferred tax asset |
67,908
|
717,559
|
| Equity method investment |
|
1,343,486
|
| Deposits |
65,410
|
53,819
|
| Total Assets |
39,899,677
|
34,585,195
|
| Current Liabilities: |
|
|
| Accounts payable and accrued expenses |
8,872,582
|
9,063,256
|
| Term loan, net of debt discount of $49,022 and $60,082, respectively |
1,502,702
|
1,491,642
|
| Operating lease liabilities |
414,937
|
391,802
|
| Finance leases payable |
335,119
|
182,391
|
| Total current liabilities |
13,075,340
|
11,879,091
|
| Line of credit |
500,000
|
890,000
|
| Operating lease liabilities – net of current |
2,739,208
|
2,897,205
|
| Finance leases payable – net of current |
906,476
|
248,640
|
| Term loan – net of current |
3,879,318
|
4,655,181
|
| Total long-term liabilities |
11,025,002
|
10,191,026
|
| Total Liabilities |
24,100,342
|
22,070,117
|
| Commitments and contingencies (Notes 10 and 11) |
|
|
| Stockholders’ Equity: |
|
|
| Preferred stock, $0.00001 par value; 19,680,000 shares authorized; no shares issued and outstanding |
|
|
| Common stock, $0.00001 par value; 250,000,000 shares authorized; 37,343,387 and 36,317,857 shares issued and outstanding as of July 31, 2023 and January 31, 2023 |
374
|
364
|
| Additional paid in capital |
22,912,383
|
22,724,440
|
| Accumulated deficit |
(6,963,922)
|
(10,060,226)
|
| Less: Treasury stock, 230,000 shares at cost |
(149,500)
|
(149,500)
|
| Total Stockholders’ Equity |
15,799,335
|
12,515,078
|
| Total Liabilities and Stockholders’ Equity |
39,899,677
|
34,585,195
|
| Series A Preferred Stock [Member] |
|
|
| Stockholders’ Equity: |
|
|
| Preferred stock, $0.00001 par value; 19,680,000 shares authorized; no shares issued and outstanding |
|
|
| Series B Preferred Stock [Member] |
|
|
| Stockholders’ Equity: |
|
|
| Preferred stock, $0.00001 par value; 19,680,000 shares authorized; no shares issued and outstanding |
|
|
| Related Party [Member] |
|
|
| Current Liabilities: |
|
|
| Promissory notes – related parties |
1,950,000
|
750,000
|
| Promissory notes – related parties, net of current |
$ 3,000,000
|
$ 1,500,000
|
| X |
- DefinitionSum of the carrying values as of the balance sheet date of obligations incurred through that date and due within one year (or the operating cycle, if longer), including liabilities incurred (and for which invoices have typically been received) and payable to vendors for goods and services received, taxes, interest, rent and utilities, accrued salaries and bonuses, payroll taxes and fringe benefits. Reference 1: http://fasb.org/us-gaap/role/ref/legacyRef
-Name Accounting Standards Codification
-Topic 210
-SubTopic 10
-Section S99
-Paragraph 1
-Subparagraph (SX 210.5-02.19,20)
-Publisher FASB
-URI https://asc.fasb.org//1943274/2147480566/210-10-S99-1
| Name: |
us-gaap_AccountsPayableAndAccruedLiabilitiesCurrent |
| Namespace Prefix: |
us-gaap_ |
| Data Type: |
xbrli:monetaryItemType |
| Balance Type: |
credit |
| Period Type: |
instant |
|
| X |
- DefinitionAmount, after allowance for credit loss, of right to consideration from customer for product sold and service rendered in normal course of business, classified as current. Reference 1: http://www.xbrl.org/2003/role/disclosureRef
-Topic 310
-SubTopic 10
-Name Accounting Standards Codification
-Section 45
-Paragraph 2
-Publisher FASB
-URI https://asc.fasb.org//1943274/2147481990/310-10-45-2
Reference 2: http://www.xbrl.org/2003/role/disclosureRef
-Topic 310
-SubTopic 10
-Name Accounting Standards Codification
-Section 45
-Paragraph 9
-Publisher FASB
-URI https://asc.fasb.org//1943274/2147481990/310-10-45-9
| Name: |
us-gaap_AccountsReceivableNetCurrent |
| Namespace Prefix: |
us-gaap_ |
| Data Type: |
xbrli:monetaryItemType |
| Balance Type: |
debit |
| Period Type: |
instant |
|
| X |
- DefinitionAmount of excess of issue price over par or stated value of stock and from other transaction involving stock or stockholder. Includes, but is not limited to, additional paid-in capital (APIC) for common and preferred stock. Reference 1: http://www.xbrl.org/2003/role/exampleRef
-Topic 852
-SubTopic 10
-Name Accounting Standards Codification
-Section 55
-Paragraph 10
-Publisher FASB
-URI https://asc.fasb.org//1943274/2147481372/852-10-55-10
Reference 2: http://www.xbrl.org/2009/role/commonPracticeRef
-Topic 946
-SubTopic 210
-Name Accounting Standards Codification
-Section S99
-Paragraph 1
-Subparagraph (SX 210.6-04(18))
-Publisher FASB
-URI https://asc.fasb.org//1943274/2147479617/946-210-S99-1
Reference 3: http://fasb.org/us-gaap/role/ref/legacyRef
-Topic 210
-SubTopic 10
-Name Accounting Standards Codification
-Section S99
-Paragraph 1
-Subparagraph (SX 210.5-02(30)(a)(1))
-Publisher FASB
-URI https://asc.fasb.org//1943274/2147480566/210-10-S99-1
| Name: |
us-gaap_AdditionalPaidInCapital |
| Namespace Prefix: |
us-gaap_ |
| Data Type: |
xbrli:monetaryItemType |
| Balance Type: |
credit |
| Period Type: |
instant |
|
| X |
- DefinitionSum of the carrying amounts as of the balance sheet date of all assets that are recognized. Assets are probable future economic benefits obtained or controlled by an entity as a result of past transactions or events. Reference 1: http://www.xbrl.org/2003/role/disclosureRef
-Topic 810
-SubTopic 10
-Name Accounting Standards Codification
-Section 50
-Paragraph 3
-Subparagraph (bb)
-Publisher FASB
-URI https://asc.fasb.org//1943274/2147481203/810-10-50-3
Reference 2: http://www.xbrl.org/2003/role/disclosureRef
-Topic 810
-SubTopic 10
-Name Accounting Standards Codification
-Section 45
-Paragraph 25
-Subparagraph (a)
-Publisher FASB
-URI https://asc.fasb.org//1943274/2147481231/810-10-45-25
Reference 3: http://www.xbrl.org/2003/role/disclosureRef
-Topic 235
-SubTopic 10
-Name Accounting Standards Codification
-Section S99
-Paragraph 1
-Subparagraph (SX 210.4-08(g)(1)(ii))
-Publisher FASB
-URI https://asc.fasb.org//1943274/2147480678/235-10-S99-1
Reference 4: http://www.xbrl.org/2003/role/disclosureRef
-Topic 323
-SubTopic 10
-Name Accounting Standards Codification
-Section 50
-Paragraph 3
-Subparagraph (c)
-Publisher FASB
-URI https://asc.fasb.org//1943274/2147481687/323-10-50-3
Reference 5: http://www.xbrl.org/2003/role/disclosureRef
-Topic 825
-SubTopic 10
-Name Accounting Standards Codification
-Section 50
-Paragraph 28
-Subparagraph (f)
-Publisher FASB
-URI https://asc.fasb.org//1943274/2147482907/825-10-50-28
Reference 6: http://www.xbrl.org/2003/role/exampleRef
-Topic 852
-SubTopic 10
-Name Accounting Standards Codification
-Section 55
-Paragraph 10
-Publisher FASB
-URI https://asc.fasb.org//1943274/2147481372/852-10-55-10
Reference 7: http://www.xbrl.org/2003/role/exampleRef
-Topic 946
-SubTopic 830
-Name Accounting Standards Codification
-Section 55
-Paragraph 12
-Publisher FASB
-URI https://asc.fasb.org//1943274/2147480167/946-830-55-12
Reference 8: http://www.xbrl.org/2003/role/disclosureRef
-Topic 944
-SubTopic 210
-Name Accounting Standards Codification
-Section S99
-Paragraph 1
-Subparagraph (SX 210.7-03(a)(12))
-Publisher FASB
-URI https://asc.fasb.org//1943274/2147479440/944-210-S99-1
Reference 9: http://www.xbrl.org/2003/role/disclosureRef
-Topic 280
-SubTopic 10
-Name Accounting Standards Codification
-Section 50
-Paragraph 22
-Publisher FASB
-URI https://asc.fasb.org//1943274/2147482810/280-10-50-22
Reference 10: http://www.xbrl.org/2003/role/disclosureRef
-Topic 946
-SubTopic 210
-Name Accounting Standards Codification
-Section S99
-Paragraph 1
-Subparagraph (SX 210.6-04(8))
-Publisher FASB
-URI https://asc.fasb.org//1943274/2147479617/946-210-S99-1
Reference 11: http://www.xbrl.org/2003/role/disclosureRef
-Topic 210
-SubTopic 10
-Name Accounting Standards Codification
-Section S99
-Paragraph 1
-Subparagraph (SX 210.5-02(18))
-Publisher FASB
-URI https://asc.fasb.org//1943274/2147480566/210-10-S99-1
Reference 12: http://www.xbrl.org/2003/role/disclosureRef
-Topic 470
-SubTopic 10
-Name Accounting Standards Codification
-Section S99
-Paragraph 1A
-Subparagraph (SX 210.13-01(a)(4)(i))
-Publisher FASB
-URI https://asc.fasb.org//1943274/2147480097/470-10-S99-1A
Reference 13: http://www.xbrl.org/2009/role/commonPracticeRef
-Topic 470
-SubTopic 10
-Name Accounting Standards Codification
-Section S99
-Paragraph 1A
-Subparagraph (SX 210.13-01(a)(4)(ii))
-Publisher FASB
-URI https://asc.fasb.org//1943274/2147480097/470-10-S99-1A
Reference 14: http://www.xbrl.org/2009/role/commonPracticeRef
-Topic 470
-SubTopic 10
-Name Accounting Standards Codification
-Section S99
-Paragraph 1A
-Subparagraph (SX 210.13-01(a)(4)(iii))
-Publisher FASB
-URI https://asc.fasb.org//1943274/2147480097/470-10-S99-1A
Reference 15: http://www.xbrl.org/2003/role/disclosureRef
-Topic 470
-SubTopic 10
-Name Accounting Standards Codification
-Section S99
-Paragraph 1A
-Subparagraph (SX 210.13-01(a)(4)(iii)(A))
-Publisher FASB
-URI https://asc.fasb.org//1943274/2147480097/470-10-S99-1A
Reference 16: http://www.xbrl.org/2003/role/disclosureRef
-Topic 470
-SubTopic 10
-Name Accounting Standards Codification
-Section S99
-Paragraph 1A
-Subparagraph (SX 210.13-01(a)(4)(iv))
-Publisher FASB
-URI https://asc.fasb.org//1943274/2147480097/470-10-S99-1A
Reference 17: http://www.xbrl.org/2003/role/disclosureRef
-Topic 470
-SubTopic 10
-Name Accounting Standards Codification
-Section S99
-Paragraph 1A
-Subparagraph (SX 210.13-01(a)(5))
-Publisher FASB
-URI https://asc.fasb.org//1943274/2147480097/470-10-S99-1A
Reference 18: http://www.xbrl.org/2003/role/disclosureRef
-Topic 470
-SubTopic 10
-Name Accounting Standards Codification
-Section S99
-Paragraph 1B
-Subparagraph (SX 210.13-02(a)(4)(i))
-Publisher FASB
-URI https://asc.fasb.org//1943274/2147480097/470-10-S99-1B
Reference 19: http://www.xbrl.org/2003/role/disclosureRef
-Topic 470
-SubTopic 10
-Name Accounting Standards Codification
-Section S99
-Paragraph 1B
-Subparagraph (SX 210.13-02(a)(4)(iii)(A))
-Publisher FASB
-URI https://asc.fasb.org//1943274/2147480097/470-10-S99-1B
Reference 20: http://www.xbrl.org/2003/role/disclosureRef
-Topic 470
-SubTopic 10
-Name Accounting Standards Codification
-Section S99
-Paragraph 1B
-Subparagraph (SX 210.13-02(a)(4)(iii)(B))
-Publisher FASB
-URI https://asc.fasb.org//1943274/2147480097/470-10-S99-1B
Reference 21: http://www.xbrl.org/2003/role/disclosureRef
-Topic 470
-SubTopic 10
-Name Accounting Standards Codification
-Section S99
-Paragraph 1B
-Subparagraph (SX 210.13-02(a)(4)(iv))
-Publisher FASB
-URI https://asc.fasb.org//1943274/2147480097/470-10-S99-1B
Reference 22: http://www.xbrl.org/2003/role/disclosureRef
-Topic 470
-SubTopic 10
-Name Accounting Standards Codification
-Section S99
-Paragraph 1B
-Subparagraph (SX 210.13-02(a)(5))
-Publisher FASB
-URI https://asc.fasb.org//1943274/2147480097/470-10-S99-1B
Reference 23: http://www.xbrl.org/2009/role/commonPracticeRef
-Topic 852
-SubTopic 10
-Name Accounting Standards Codification
-Section 50
-Paragraph 7
-Subparagraph (a)
-Publisher FASB
-URI https://asc.fasb.org//1943274/2147481404/852-10-50-7
Reference 24: http://www.xbrl.org/2003/role/disclosureRef
-Topic 280
-SubTopic 10
-Name Accounting Standards Codification
-Section 50
-Paragraph 30
-Subparagraph (c)
-Publisher FASB
-URI https://asc.fasb.org//1943274/2147482810/280-10-50-30
Reference 25: http://www.xbrl.org/2003/role/disclosureRef
-Topic 280
-SubTopic 10
-Name Accounting Standards Codification
-Section 50
-Paragraph 32
-Subparagraph (d)
-Publisher FASB
-URI https://asc.fasb.org//1943274/2147482810/280-10-50-32
Reference 26: http://fasb.org/us-gaap/role/ref/legacyRef
-Topic 942
-SubTopic 210
-Name Accounting Standards Codification
-Section S99
-Paragraph 1
-Subparagraph (SX 210.9-03(11))
-Publisher FASB
-URI https://asc.fasb.org//1943274/2147479853/942-210-S99-1
| Name: |
us-gaap_Assets |
| Namespace Prefix: |
us-gaap_ |
| Data Type: |
xbrli:monetaryItemType |
| Balance Type: |
debit |
| Period Type: |
instant |
|
| X |
- DefinitionSum of the carrying amounts as of the balance sheet date of all assets that are expected to be realized in cash, sold, or consumed within one year (or the normal operating cycle, if longer). Assets are probable future economic benefits obtained or controlled by an entity as a result of past transactions or events. Reference 1: http://www.xbrl.org/2003/role/disclosureRef
-Topic 810
-SubTopic 10
-Name Accounting Standards Codification
-Section 50
-Paragraph 3
-Subparagraph (bb)
-Publisher FASB
-URI https://asc.fasb.org//1943274/2147481203/810-10-50-3
Reference 2: http://www.xbrl.org/2003/role/disclosureRef
-Topic 810
-SubTopic 10
-Name Accounting Standards Codification
-Section 45
-Paragraph 25
-Subparagraph (a)
-Publisher FASB
-URI https://asc.fasb.org//1943274/2147481231/810-10-45-25
Reference 3: http://www.xbrl.org/2003/role/disclosureRef
-Topic 235
-SubTopic 10
-Name Accounting Standards Codification
-Section S99
-Paragraph 1
-Subparagraph (SX 210.4-08(g)(1)(ii))
-Publisher FASB
-URI https://asc.fasb.org//1943274/2147480678/235-10-S99-1
Reference 4: http://www.xbrl.org/2003/role/disclosureRef
-Topic 323
-SubTopic 10
-Name Accounting Standards Codification
-Section 50
-Paragraph 3
-Subparagraph (c)
-Publisher FASB
-URI https://asc.fasb.org//1943274/2147481687/323-10-50-3
Reference 5: http://www.xbrl.org/2003/role/disclosureRef
-Topic 825
-SubTopic 10
-Name Accounting Standards Codification
-Section 50
-Paragraph 28
-Subparagraph (f)
-Publisher FASB
-URI https://asc.fasb.org//1943274/2147482907/825-10-50-28
Reference 6: http://www.xbrl.org/2003/role/exampleRef
-Topic 852
-SubTopic 10
-Name Accounting Standards Codification
-Section 55
-Paragraph 10
-Publisher FASB
-URI https://asc.fasb.org//1943274/2147481372/852-10-55-10
Reference 7: http://www.xbrl.org/2003/role/disclosureRef
-Topic 210
-SubTopic 10
-Name Accounting Standards Codification
-Section 45
-Paragraph 1
-Publisher FASB
-URI https://asc.fasb.org//1943274/2147483467/210-10-45-1
Reference 8: http://www.xbrl.org/2003/role/disclosureRef
-Topic 210
-SubTopic 10
-Name Accounting Standards Codification
-Section S99
-Paragraph 1
-Subparagraph (SX 210.5-02(9))
-Publisher FASB
-URI https://asc.fasb.org//1943274/2147480566/210-10-S99-1
Reference 9: http://www.xbrl.org/2003/role/disclosureRef
-Topic 470
-SubTopic 10
-Name Accounting Standards Codification
-Section S99
-Paragraph 1A
-Subparagraph (SX 210.13-01(a)(4)(i))
-Publisher FASB
-URI https://asc.fasb.org//1943274/2147480097/470-10-S99-1A
Reference 10: http://www.xbrl.org/2009/role/commonPracticeRef
-Topic 470
-SubTopic 10
-Name Accounting Standards Codification
-Section S99
-Paragraph 1A
-Subparagraph (SX 210.13-01(a)(4)(ii))
-Publisher FASB
-URI https://asc.fasb.org//1943274/2147480097/470-10-S99-1A
Reference 11: http://www.xbrl.org/2009/role/commonPracticeRef
-Topic 470
-SubTopic 10
-Name Accounting Standards Codification
-Section S99
-Paragraph 1A
-Subparagraph (SX 210.13-01(a)(4)(iii))
-Publisher FASB
-URI https://asc.fasb.org//1943274/2147480097/470-10-S99-1A
Reference 12: http://www.xbrl.org/2003/role/disclosureRef
-Topic 470
-SubTopic 10
-Name Accounting Standards Codification
-Section S99
-Paragraph 1A
-Subparagraph (SX 210.13-01(a)(4)(iii)(A))
-Publisher FASB
-URI https://asc.fasb.org//1943274/2147480097/470-10-S99-1A
Reference 13: http://www.xbrl.org/2003/role/disclosureRef
-Topic 470
-SubTopic 10
-Name Accounting Standards Codification
-Section S99
-Paragraph 1A
-Subparagraph (SX 210.13-01(a)(4)(iv))
-Publisher FASB
-URI https://asc.fasb.org//1943274/2147480097/470-10-S99-1A
Reference 14: http://www.xbrl.org/2003/role/disclosureRef
-Topic 470
-SubTopic 10
-Name Accounting Standards Codification
-Section S99
-Paragraph 1A
-Subparagraph (SX 210.13-01(a)(5))
-Publisher FASB
-URI https://asc.fasb.org//1943274/2147480097/470-10-S99-1A
Reference 15: http://www.xbrl.org/2003/role/disclosureRef
-Topic 470
-SubTopic 10
-Name Accounting Standards Codification
-Section S99
-Paragraph 1B
-Subparagraph (SX 210.13-02(a)(4)(i))
-Publisher FASB
-URI https://asc.fasb.org//1943274/2147480097/470-10-S99-1B
Reference 16: http://www.xbrl.org/2003/role/disclosureRef
-Topic 470
-SubTopic 10
-Name Accounting Standards Codification
-Section S99
-Paragraph 1B
-Subparagraph (SX 210.13-02(a)(4)(iii)(A))
-Publisher FASB
-URI https://asc.fasb.org//1943274/2147480097/470-10-S99-1B
Reference 17: http://www.xbrl.org/2003/role/disclosureRef
-Topic 470
-SubTopic 10
-Name Accounting Standards Codification
-Section S99
-Paragraph 1B
-Subparagraph (SX 210.13-02(a)(4)(iii)(B))
-Publisher FASB
-URI https://asc.fasb.org//1943274/2147480097/470-10-S99-1B
Reference 18: http://www.xbrl.org/2003/role/disclosureRef
-Topic 470
-SubTopic 10
-Name Accounting Standards Codification
-Section S99
-Paragraph 1B
-Subparagraph (SX 210.13-02(a)(4)(iv))
-Publisher FASB
-URI https://asc.fasb.org//1943274/2147480097/470-10-S99-1B
Reference 19: http://www.xbrl.org/2003/role/disclosureRef
-Topic 470
-SubTopic 10
-Name Accounting Standards Codification
-Section S99
-Paragraph 1B
-Subparagraph (SX 210.13-02(a)(5))
-Publisher FASB
-URI https://asc.fasb.org//1943274/2147480097/470-10-S99-1B
Reference 20: http://www.xbrl.org/2009/role/commonPracticeRef
-Topic 852
-SubTopic 10
-Name Accounting Standards Codification
-Section 50
-Paragraph 7
-Subparagraph (a)
-Publisher FASB
-URI https://asc.fasb.org//1943274/2147481404/852-10-50-7
| Name: |
us-gaap_AssetsCurrent |
| Namespace Prefix: |
us-gaap_ |
| Data Type: |
xbrli:monetaryItemType |
| Balance Type: |
debit |
| Period Type: |
instant |
|
| X |
- References
+ Details
| Name: |
us-gaap_AssetsCurrentAbstract |
| Namespace Prefix: |
us-gaap_ |
| Data Type: |
xbrli:stringItemType |
| Balance Type: |
na |
| Period Type: |
duration |
|
| X |
- DefinitionAmount of currency on hand as well as demand deposits with banks or financial institutions. Includes other kinds of accounts that have the general characteristics of demand deposits. Also includes short-term, highly liquid investments that are both readily convertible to known amounts of cash and so near their maturity that they present insignificant risk of changes in value because of changes in interest rates. Excludes cash and cash equivalents within disposal group and discontinued operation. Reference 1: http://www.xbrl.org/2003/role/disclosureRef
-Topic 210
-SubTopic 10
-Name Accounting Standards Codification
-Section S99
-Paragraph 1
-Subparagraph (SX 210.5-02(1))
-Publisher FASB
-URI https://asc.fasb.org//1943274/2147480566/210-10-S99-1
Reference 2: http://www.xbrl.org/2003/role/exampleRef
-Topic 210
-SubTopic 10
-Name Accounting Standards Codification
-Section 45
-Paragraph 1
-Subparagraph (a)
-Publisher FASB
-URI https://asc.fasb.org//1943274/2147483467/210-10-45-1
Reference 3: http://fasb.org/us-gaap/role/ref/legacyRef
-Name Accounting Standards Codification
-Topic 230
-SubTopic 10
-Section 45
-Paragraph 4
-Publisher FASB
-URI https://asc.fasb.org//1943274/2147482740/230-10-45-4
| Name: |
us-gaap_CashAndCashEquivalentsAtCarryingValue |
| Namespace Prefix: |
us-gaap_ |
| Data Type: |
xbrli:monetaryItemType |
| Balance Type: |
debit |
| Period Type: |
instant |
|
| X |
- DefinitionRepresents the caption on the face of the balance sheet to indicate that the entity has entered into (1) purchase or supply arrangements that will require expending a portion of its resources to meet the terms thereof, and (2) is exposed to potential losses or, less frequently, gains, arising from (a) possible claims against a company's resources due to future performance under contract terms, and (b) possible losses or likely gains from uncertainties that will ultimately be resolved when one or more future events that are deemed likely to occur do occur or fail to occur. Reference 1: http://www.xbrl.org/2003/role/disclosureRef
-Topic 944
-SubTopic 210
-Name Accounting Standards Codification
-Section S99
-Paragraph 1
-Subparagraph (SX 210.7-03(a)(19))
-Publisher FASB
-URI https://asc.fasb.org//1943274/2147479440/944-210-S99-1
Reference 2: http://www.xbrl.org/2003/role/disclosureRef
-Topic 946
-SubTopic 210
-Name Accounting Standards Codification
-Section S99
-Paragraph 1
-Subparagraph (SX 210.6-04(15))
-Publisher FASB
-URI https://asc.fasb.org//1943274/2147479617/946-210-S99-1
Reference 3: http://fasb.org/us-gaap/role/ref/legacyRef
-Name Accounting Standards Codification
-Topic 942
-SubTopic 210
-Section S99
-Paragraph 1
-Subparagraph (SX 210.9-03.17)
-Publisher FASB
-URI https://asc.fasb.org//1943274/2147479853/942-210-S99-1
Reference 4: http://fasb.org/us-gaap/role/ref/legacyRef
-Name Accounting Standards Codification
-Topic 210
-SubTopic 10
-Section S99
-Paragraph 1
-Subparagraph (SX 210.5-02.25)
-Publisher FASB
-URI https://asc.fasb.org//1943274/2147480566/210-10-S99-1
| Name: |
us-gaap_CommitmentsAndContingencies |
| Namespace Prefix: |
us-gaap_ |
| Data Type: |
xbrli:monetaryItemType |
| Balance Type: |
credit |
| Period Type: |
instant |
|
| X |
- DefinitionAggregate par or stated value of issued nonredeemable common stock (or common stock redeemable solely at the option of the issuer). This item includes treasury stock repurchased by the entity. Note: elements for number of nonredeemable common shares, par value and other disclosure concepts are in another section within stockholders' equity. Reference 1: http://www.xbrl.org/2003/role/exampleRef
-Topic 852
-SubTopic 10
-Name Accounting Standards Codification
-Section 55
-Paragraph 10
-Publisher FASB
-URI https://asc.fasb.org//1943274/2147481372/852-10-55-10
Reference 2: http://www.xbrl.org/2003/role/disclosureRef
-Topic 944
-SubTopic 210
-Name Accounting Standards Codification
-Section S99
-Paragraph 1
-Subparagraph (SX 210.7-03(a)(22))
-Publisher FASB
-URI https://asc.fasb.org//1943274/2147479440/944-210-S99-1
Reference 3: http://fasb.org/us-gaap/role/ref/legacyRef
-Topic 210
-SubTopic 10
-Name Accounting Standards Codification
-Section S99
-Paragraph 1
-Subparagraph (SX 210.5-02(29))
-Publisher FASB
-URI https://asc.fasb.org//1943274/2147480566/210-10-S99-1
| Name: |
us-gaap_CommonStockValue |
| Namespace Prefix: |
us-gaap_ |
| Data Type: |
xbrli:monetaryItemType |
| Balance Type: |
credit |
| Period Type: |
instant |
|
| X |
- DefinitionCarrying value of amounts transferred to third parties for security purposes that are expected to be returned or applied towards payment after one year or beyond the operating cycle, if longer. Reference 1: http://www.xbrl.org/2009/role/commonPracticeRef
-Topic 210
-SubTopic 10
-Name Accounting Standards Codification
-Section S99
-Paragraph 1
-Subparagraph (SX 210.5-02(17))
-Publisher FASB
-URI https://asc.fasb.org//1943274/2147480566/210-10-S99-1
| Name: |
us-gaap_DepositsAssetsNoncurrent |
| Namespace Prefix: |
us-gaap_ |
| Data Type: |
xbrli:monetaryItemType |
| Balance Type: |
debit |
| Period Type: |
instant |
|
| X |
- DefinitionThis item represents the carrying amount on the entity's balance sheet of its investment in common stock of an equity method investee. This is not an indicator of the fair value of the investment, rather it is the initial cost adjusted for the entity's share of earnings and losses of the investee, adjusted for any distributions (dividends) and other than temporary impairment (OTTI) losses recognized. Reference 1: http://www.xbrl.org/2003/role/disclosureRef
-Topic 323
-SubTopic 10
-Name Accounting Standards Codification
-Section 45
-Paragraph 1
-Publisher FASB
-URI https://asc.fasb.org//1943274/2147481664/323-10-45-1
Reference 2: http://www.xbrl.org/2009/role/commonPracticeRef
-Topic 323
-SubTopic 10
-Name Accounting Standards Codification
-Section 50
-Paragraph 3
-Subparagraph (a)(3)
-Publisher FASB
-URI https://asc.fasb.org//1943274/2147481687/323-10-50-3
Reference 3: http://www.xbrl.org/2009/role/commonPracticeRef
-Topic 210
-SubTopic 10
-Name Accounting Standards Codification
-Section S99
-Paragraph 1
-Subparagraph (SX 210.5-02(10))
-Publisher FASB
-URI https://asc.fasb.org//1943274/2147480566/210-10-S99-1
Reference 4: http://www.xbrl.org/2003/role/disclosureRef
-Topic 280
-SubTopic 10
-Name Accounting Standards Codification
-Section 50
-Paragraph 25
-Subparagraph (a)
-Publisher FASB
-URI https://asc.fasb.org//1943274/2147482810/280-10-50-25
| Name: |
us-gaap_EquityMethodInvestments |
| Namespace Prefix: |
us-gaap_ |
| Data Type: |
xbrli:monetaryItemType |
| Balance Type: |
debit |
| Period Type: |
instant |
|
| X |
- DefinitionPresent value of lessee's discounted obligation for lease payments from finance lease, classified as current. Reference 1: http://www.xbrl.org/2003/role/disclosureRef
-Topic 842
-SubTopic 20
-Name Accounting Standards Codification
-Section 45
-Paragraph 1
-Subparagraph (b)
-Publisher FASB
-URI https://asc.fasb.org//1943274/2147479041/842-20-45-1
| Name: |
us-gaap_FinanceLeaseLiabilityCurrent |
| Namespace Prefix: |
us-gaap_ |
| Data Type: |
xbrli:monetaryItemType |
| Balance Type: |
credit |
| Period Type: |
instant |
|
| X |
- DefinitionPresent value of lessee's discounted obligation for lease payments from finance lease, classified as noncurrent. Reference 1: http://www.xbrl.org/2003/role/disclosureRef
-Topic 842
-SubTopic 20
-Name Accounting Standards Codification
-Section 45
-Paragraph 1
-Subparagraph (b)
-Publisher FASB
-URI https://asc.fasb.org//1943274/2147479041/842-20-45-1
| Name: |
us-gaap_FinanceLeaseLiabilityNoncurrent |
| Namespace Prefix: |
us-gaap_ |
| Data Type: |
xbrli:monetaryItemType |
| Balance Type: |
credit |
| Period Type: |
instant |
|
| X |
- DefinitionAmount after accumulated impairment loss of an asset representing future economic benefits arising from other assets acquired in a business combination that are not individually identified and separately recognized. Reference 1: http://www.xbrl.org/2003/role/exampleRef
-Topic 852
-SubTopic 10
-Name Accounting Standards Codification
-Section 55
-Paragraph 10
-Publisher FASB
-URI https://asc.fasb.org//1943274/2147481372/852-10-55-10
Reference 2: http://www.xbrl.org/2003/role/exampleRef
-Topic 350
-SubTopic 20
-Name Accounting Standards Codification
-Section 55
-Paragraph 24
-Publisher FASB
-URI https://asc.fasb.org//1943274/2147482548/350-20-55-24
Reference 3: http://www.xbrl.org/2003/role/disclosureRef
-Topic 210
-SubTopic 10
-Name Accounting Standards Codification
-Section S99
-Paragraph 1
-Subparagraph (SX 210.5-02(15))
-Publisher FASB
-URI https://asc.fasb.org//1943274/2147480566/210-10-S99-1
Reference 4: http://www.xbrl.org/2003/role/disclosureRef
-Topic 350
-SubTopic 20
-Name Accounting Standards Codification
-Section 45
-Paragraph 1
-Publisher FASB
-URI https://asc.fasb.org//1943274/2147482598/350-20-45-1
Reference 5: http://www.xbrl.org/2009/role/commonPracticeRef
-Topic 350
-SubTopic 20
-Name Accounting Standards Codification
-Section 50
-Paragraph 1
-Subparagraph (a)
-Publisher FASB
-URI https://asc.fasb.org//1943274/2147482573/350-20-50-1
Reference 6: http://www.xbrl.org/2009/role/commonPracticeRef
-Topic 350
-SubTopic 20
-Name Accounting Standards Codification
-Section 50
-Paragraph 1
-Subparagraph (h)
-Publisher FASB
-URI https://asc.fasb.org//1943274/2147482573/350-20-50-1
Reference 7: http://www.xbrl.org/2003/role/disclosureRef
-Topic 942
-SubTopic 210
-Name Accounting Standards Codification
-Section S99
-Paragraph 1
-Subparagraph (SX 210.9-03(10)(1))
-Publisher FASB
-URI https://asc.fasb.org//1943274/2147479853/942-210-S99-1
| Name: |
us-gaap_Goodwill |
| Namespace Prefix: |
us-gaap_ |
| Data Type: |
xbrli:monetaryItemType |
| Balance Type: |
debit |
| Period Type: |
instant |
|
| X |
- DefinitionSum of the carrying amounts of all intangible assets, excluding goodwill, as of the balance sheet date, net of accumulated amortization and impairment charges. Reference 1: http://fasb.org/us-gaap/role/ref/legacyRef
-Name Accounting Standards Codification
-Topic 350
-SubTopic 30
-Section 50
-Paragraph 2
-Subparagraph ((a)(1),(b))
-Publisher FASB
-URI https://asc.fasb.org//1943274/2147482665/350-30-50-2
Reference 2: http://fasb.org/us-gaap/role/ref/legacyRef
-Name Accounting Standards Codification
-Topic 350
-SubTopic 30
-Section 45
-Paragraph 1
-Publisher FASB
-URI https://asc.fasb.org//1943274/2147482686/350-30-45-1
| Name: |
us-gaap_IntangibleAssetsNetExcludingGoodwill |
| Namespace Prefix: |
us-gaap_ |
| Data Type: |
xbrli:monetaryItemType |
| Balance Type: |
debit |
| Period Type: |
instant |
|
| X |
- DefinitionAmount after valuation and LIFO reserves of inventory expected to be sold, or consumed within one year or operating cycle, if longer. Reference 1: http://www.xbrl.org/2003/role/exampleRef
-Topic 852
-SubTopic 10
-Name Accounting Standards Codification
-Section 55
-Paragraph 10
-Publisher FASB
-URI https://asc.fasb.org//1943274/2147481372/852-10-55-10
Reference 2: http://www.xbrl.org/2003/role/exampleRef
-Topic 210
-SubTopic 10
-Name Accounting Standards Codification
-Section 45
-Paragraph 1
-Subparagraph (b)
-Publisher FASB
-URI https://asc.fasb.org//1943274/2147483467/210-10-45-1
Reference 3: http://www.xbrl.org/2003/role/disclosureRef
-Topic 210
-SubTopic 10
-Name Accounting Standards Codification
-Section S99
-Paragraph 1
-Subparagraph (SX 210.5-02(6))
-Publisher FASB
-URI https://asc.fasb.org//1943274/2147480566/210-10-S99-1
| Name: |
us-gaap_InventoryNet |
| Namespace Prefix: |
us-gaap_ |
| Data Type: |
xbrli:monetaryItemType |
| Balance Type: |
debit |
| Period Type: |
instant |
|
| X |
- DefinitionSum of the carrying amounts as of the balance sheet date of all liabilities that are recognized. Liabilities are probable future sacrifices of economic benefits arising from present obligations of an entity to transfer assets or provide services to other entities in the future. Reference 1: http://www.xbrl.org/2003/role/disclosureRef
-Topic 810
-SubTopic 10
-Name Accounting Standards Codification
-Section 50
-Paragraph 3
-Subparagraph (c)
-Publisher FASB
-URI https://asc.fasb.org//1943274/2147481203/810-10-50-3
Reference 2: http://www.xbrl.org/2003/role/disclosureRef
-Topic 810
-SubTopic 10
-Name Accounting Standards Codification
-Section 45
-Paragraph 25
-Subparagraph (b)
-Publisher FASB
-URI https://asc.fasb.org//1943274/2147481231/810-10-45-25
Reference 3: http://www.xbrl.org/2003/role/disclosureRef
-Topic 810
-SubTopic 10
-Name Accounting Standards Codification
-Section 50
-Paragraph 3
-Subparagraph (bb)
-Publisher FASB
-URI https://asc.fasb.org//1943274/2147481203/810-10-50-3
Reference 4: http://www.xbrl.org/2003/role/disclosureRef
-Topic 235
-SubTopic 10
-Name Accounting Standards Codification
-Section S99
-Paragraph 1
-Subparagraph (SX 210.4-08(g)(1)(ii))
-Publisher FASB
-URI https://asc.fasb.org//1943274/2147480678/235-10-S99-1
Reference 5: http://www.xbrl.org/2003/role/disclosureRef
-Topic 323
-SubTopic 10
-Name Accounting Standards Codification
-Section 50
-Paragraph 3
-Subparagraph (c)
-Publisher FASB
-URI https://asc.fasb.org//1943274/2147481687/323-10-50-3
Reference 6: http://www.xbrl.org/2003/role/disclosureRef
-Topic 825
-SubTopic 10
-Name Accounting Standards Codification
-Section 50
-Paragraph 28
-Subparagraph (f)
-Publisher FASB
-URI https://asc.fasb.org//1943274/2147482907/825-10-50-28
Reference 7: http://www.xbrl.org/2003/role/exampleRef
-Topic 946
-SubTopic 830
-Name Accounting Standards Codification
-Section 55
-Paragraph 12
-Publisher FASB
-URI https://asc.fasb.org//1943274/2147480167/946-830-55-12
Reference 8: http://www.xbrl.org/2003/role/disclosureRef
-Topic 946
-SubTopic 210
-Name Accounting Standards Codification
-Section S99
-Paragraph 1
-Subparagraph (SX 210.6-04(14))
-Publisher FASB
-URI https://asc.fasb.org//1943274/2147479617/946-210-S99-1
Reference 9: http://www.xbrl.org/2003/role/disclosureRef
-Topic 470
-SubTopic 10
-Name Accounting Standards Codification
-Section S99
-Paragraph 1A
-Subparagraph (SX 210.13-01(a)(4)(i))
-Publisher FASB
-URI https://asc.fasb.org//1943274/2147480097/470-10-S99-1A
Reference 10: http://www.xbrl.org/2009/role/commonPracticeRef
-Topic 470
-SubTopic 10
-Name Accounting Standards Codification
-Section S99
-Paragraph 1A
-Subparagraph (SX 210.13-01(a)(4)(ii))
-Publisher FASB
-URI https://asc.fasb.org//1943274/2147480097/470-10-S99-1A
Reference 11: http://www.xbrl.org/2003/role/disclosureRef
-Topic 470
-SubTopic 10
-Name Accounting Standards Codification
-Section S99
-Paragraph 1A
-Subparagraph (SX 210.13-01(a)(4)(iii)(A))
-Publisher FASB
-URI https://asc.fasb.org//1943274/2147480097/470-10-S99-1A
Reference 12: http://www.xbrl.org/2003/role/disclosureRef
-Topic 470
-SubTopic 10
-Name Accounting Standards Codification
-Section S99
-Paragraph 1A
-Subparagraph (SX 210.13-01(a)(4)(iv))
-Publisher FASB
-URI https://asc.fasb.org//1943274/2147480097/470-10-S99-1A
Reference 13: http://www.xbrl.org/2003/role/disclosureRef
-Topic 470
-SubTopic 10
-Name Accounting Standards Codification
-Section S99
-Paragraph 1A
-Subparagraph (SX 210.13-01(a)(5))
-Publisher FASB
-URI https://asc.fasb.org//1943274/2147480097/470-10-S99-1A
Reference 14: http://www.xbrl.org/2003/role/disclosureRef
-Topic 470
-SubTopic 10
-Name Accounting Standards Codification
-Section S99
-Paragraph 1B
-Subparagraph (SX 210.13-02(a)(4)(i))
-Publisher FASB
-URI https://asc.fasb.org//1943274/2147480097/470-10-S99-1B
Reference 15: http://www.xbrl.org/2003/role/disclosureRef
-Topic 470
-SubTopic 10
-Name Accounting Standards Codification
-Section S99
-Paragraph 1B
-Subparagraph (SX 210.13-02(a)(4)(iii)(A))
-Publisher FASB
-URI https://asc.fasb.org//1943274/2147480097/470-10-S99-1B
Reference 16: http://www.xbrl.org/2003/role/disclosureRef
-Topic 470
-SubTopic 10
-Name Accounting Standards Codification
-Section S99
-Paragraph 1B
-Subparagraph (SX 210.13-02(a)(4)(iii)(B))
-Publisher FASB
-URI https://asc.fasb.org//1943274/2147480097/470-10-S99-1B
Reference 17: http://www.xbrl.org/2003/role/disclosureRef
-Topic 470
-SubTopic 10
-Name Accounting Standards Codification
-Section S99
-Paragraph 1B
-Subparagraph (SX 210.13-02(a)(4)(iv))
-Publisher FASB
-URI https://asc.fasb.org//1943274/2147480097/470-10-S99-1B
Reference 18: http://www.xbrl.org/2003/role/disclosureRef
-Topic 470
-SubTopic 10
-Name Accounting Standards Codification
-Section S99
-Paragraph 1B
-Subparagraph (SX 210.13-02(a)(5))
-Publisher FASB
-URI https://asc.fasb.org//1943274/2147480097/470-10-S99-1B
Reference 19: http://www.xbrl.org/2009/role/commonPracticeRef
-Topic 852
-SubTopic 10
-Name Accounting Standards Codification
-Section 50
-Paragraph 7
-Subparagraph (a)
-Publisher FASB
-URI https://asc.fasb.org//1943274/2147481404/852-10-50-7
Reference 20: http://www.xbrl.org/2009/role/commonPracticeRef
-Topic 852
-SubTopic 10
-Name Accounting Standards Codification
-Section 50
-Paragraph 7
-Subparagraph (b)
-Publisher FASB
-URI https://asc.fasb.org//1943274/2147481404/852-10-50-7
Reference 21: http://www.xbrl.org/2003/role/exampleRef
-Topic 280
-SubTopic 10
-Name Accounting Standards Codification
-Section 50
-Paragraph 30
-Subparagraph (d)
-Publisher FASB
-URI https://asc.fasb.org//1943274/2147482810/280-10-50-30
Reference 22: http://fasb.org/us-gaap/role/ref/legacyRef
-Name Accounting Standards Codification
-Topic 210
-SubTopic 10
-Section S99
-Paragraph 1
-Subparagraph (SX 210.5-02.19-26)
-Publisher FASB
-URI https://asc.fasb.org//1943274/2147480566/210-10-S99-1
| Name: |
us-gaap_Liabilities |
| Namespace Prefix: |
us-gaap_ |
| Data Type: |
xbrli:monetaryItemType |
| Balance Type: |
credit |
| Period Type: |
instant |
|
| X |
- DefinitionAmount of liabilities and equity items, including the portion of equity attributable to noncontrolling interests, if any. Reference 1: http://www.xbrl.org/2003/role/exampleRef
-Topic 852
-SubTopic 10
-Name Accounting Standards Codification
-Section 55
-Paragraph 10
-Publisher FASB
-URI https://asc.fasb.org//1943274/2147481372/852-10-55-10
Reference 2: http://www.xbrl.org/2003/role/disclosureRef
-Topic 944
-SubTopic 210
-Name Accounting Standards Codification
-Section S99
-Paragraph 1
-Subparagraph (SX 210.7-03(a)(25))
-Publisher FASB
-URI https://asc.fasb.org//1943274/2147479440/944-210-S99-1
Reference 3: http://www.xbrl.org/2009/role/commonPracticeRef
-Topic 235
-SubTopic 10
-Name Accounting Standards Codification
-Section S99
-Paragraph 1
-Subparagraph (SX 210.4-08(g)(1)(ii))
-Publisher FASB
-URI https://asc.fasb.org//1943274/2147480678/235-10-S99-1
Reference 4: http://www.xbrl.org/2009/role/commonPracticeRef
-Topic 323
-SubTopic 10
-Name Accounting Standards Codification
-Section 50
-Paragraph 3
-Subparagraph (c)
-Publisher FASB
-URI https://asc.fasb.org//1943274/2147481687/323-10-50-3
Reference 5: http://www.xbrl.org/2009/role/commonPracticeRef
-Topic 825
-SubTopic 10
-Name Accounting Standards Codification
-Section 50
-Paragraph 28
-Subparagraph (f)
-Publisher FASB
-URI https://asc.fasb.org//1943274/2147482907/825-10-50-28
Reference 6: http://fasb.org/us-gaap/role/ref/legacyRef
-Topic 942
-SubTopic 210
-Name Accounting Standards Codification
-Section S99
-Paragraph 1
-Subparagraph (SX 210.9-03(23))
-Publisher FASB
-URI https://asc.fasb.org//1943274/2147479853/942-210-S99-1
Reference 7: http://fasb.org/us-gaap/role/ref/legacyRef
-Topic 210
-SubTopic 10
-Name Accounting Standards Codification
-Section S99
-Paragraph 1
-Subparagraph (SX 210.5-02(32))
-Publisher FASB
-URI https://asc.fasb.org//1943274/2147480566/210-10-S99-1
| Name: |
us-gaap_LiabilitiesAndStockholdersEquity |
| Namespace Prefix: |
us-gaap_ |
| Data Type: |
xbrli:monetaryItemType |
| Balance Type: |
credit |
| Period Type: |
instant |
|
| X |
- DefinitionTotal obligations incurred as part of normal operations that are expected to be paid during the following twelve months or within one business cycle, if longer. Reference 1: http://www.xbrl.org/2003/role/disclosureRef
-Topic 810
-SubTopic 10
-Name Accounting Standards Codification
-Section 50
-Paragraph 3
-Subparagraph (c)
-Publisher FASB
-URI https://asc.fasb.org//1943274/2147481203/810-10-50-3
Reference 2: http://www.xbrl.org/2003/role/disclosureRef
-Topic 810
-SubTopic 10
-Name Accounting Standards Codification
-Section 45
-Paragraph 25
-Subparagraph (b)
-Publisher FASB
-URI https://asc.fasb.org//1943274/2147481231/810-10-45-25
Reference 3: http://www.xbrl.org/2003/role/disclosureRef
-Topic 810
-SubTopic 10
-Name Accounting Standards Codification
-Section 50
-Paragraph 3
-Subparagraph (bb)
-Publisher FASB
-URI https://asc.fasb.org//1943274/2147481203/810-10-50-3
Reference 4: http://www.xbrl.org/2003/role/disclosureRef
-Topic 235
-SubTopic 10
-Name Accounting Standards Codification
-Section S99
-Paragraph 1
-Subparagraph (SX 210.4-08(g)(1)(ii))
-Publisher FASB
-URI https://asc.fasb.org//1943274/2147480678/235-10-S99-1
Reference 5: http://www.xbrl.org/2003/role/disclosureRef
-Topic 323
-SubTopic 10
-Name Accounting Standards Codification
-Section 50
-Paragraph 3
-Subparagraph (c)
-Publisher FASB
-URI https://asc.fasb.org//1943274/2147481687/323-10-50-3
Reference 6: http://www.xbrl.org/2003/role/disclosureRef
-Topic 825
-SubTopic 10
-Name Accounting Standards Codification
-Section 50
-Paragraph 28
-Subparagraph (f)
-Publisher FASB
-URI https://asc.fasb.org//1943274/2147482907/825-10-50-28
Reference 7: http://www.xbrl.org/2003/role/exampleRef
-Topic 852
-SubTopic 10
-Name Accounting Standards Codification
-Section 55
-Paragraph 10
-Publisher FASB
-URI https://asc.fasb.org//1943274/2147481372/852-10-55-10
Reference 8: http://www.xbrl.org/2003/role/disclosureRef
-Topic 210
-SubTopic 10
-Name Accounting Standards Codification
-Section 45
-Paragraph 5
-Publisher FASB
-URI https://asc.fasb.org//1943274/2147483467/210-10-45-5
Reference 9: http://www.xbrl.org/2003/role/disclosureRef
-Topic 470
-SubTopic 10
-Name Accounting Standards Codification
-Section S99
-Paragraph 1A
-Subparagraph (SX 210.13-01(a)(4)(i))
-Publisher FASB
-URI https://asc.fasb.org//1943274/2147480097/470-10-S99-1A
Reference 10: http://www.xbrl.org/2009/role/commonPracticeRef
-Topic 470
-SubTopic 10
-Name Accounting Standards Codification
-Section S99
-Paragraph 1A
-Subparagraph (SX 210.13-01(a)(4)(ii))
-Publisher FASB
-URI https://asc.fasb.org//1943274/2147480097/470-10-S99-1A
Reference 11: http://www.xbrl.org/2003/role/disclosureRef
-Topic 470
-SubTopic 10
-Name Accounting Standards Codification
-Section S99
-Paragraph 1A
-Subparagraph (SX 210.13-01(a)(4)(iii)(A))
-Publisher FASB
-URI https://asc.fasb.org//1943274/2147480097/470-10-S99-1A
Reference 12: http://www.xbrl.org/2003/role/disclosureRef
-Topic 470
-SubTopic 10
-Name Accounting Standards Codification
-Section S99
-Paragraph 1A
-Subparagraph (SX 210.13-01(a)(4)(iv))
-Publisher FASB
-URI https://asc.fasb.org//1943274/2147480097/470-10-S99-1A
Reference 13: http://www.xbrl.org/2003/role/disclosureRef
-Topic 470
-SubTopic 10
-Name Accounting Standards Codification
-Section S99
-Paragraph 1A
-Subparagraph (SX 210.13-01(a)(5))
-Publisher FASB
-URI https://asc.fasb.org//1943274/2147480097/470-10-S99-1A
Reference 14: http://www.xbrl.org/2003/role/disclosureRef
-Topic 470
-SubTopic 10
-Name Accounting Standards Codification
-Section S99
-Paragraph 1B
-Subparagraph (SX 210.13-02(a)(4)(i))
-Publisher FASB
-URI https://asc.fasb.org//1943274/2147480097/470-10-S99-1B
Reference 15: http://www.xbrl.org/2003/role/disclosureRef
-Topic 470
-SubTopic 10
-Name Accounting Standards Codification
-Section S99
-Paragraph 1B
-Subparagraph (SX 210.13-02(a)(4)(iii)(A))
-Publisher FASB
-URI https://asc.fasb.org//1943274/2147480097/470-10-S99-1B
Reference 16: http://www.xbrl.org/2003/role/disclosureRef
-Topic 470
-SubTopic 10
-Name Accounting Standards Codification
-Section S99
-Paragraph 1B
-Subparagraph (SX 210.13-02(a)(4)(iii)(B))
-Publisher FASB
-URI https://asc.fasb.org//1943274/2147480097/470-10-S99-1B
Reference 17: http://www.xbrl.org/2003/role/disclosureRef
-Topic 470
-SubTopic 10
-Name Accounting Standards Codification
-Section S99
-Paragraph 1B
-Subparagraph (SX 210.13-02(a)(4)(iv))
-Publisher FASB
-URI https://asc.fasb.org//1943274/2147480097/470-10-S99-1B
Reference 18: http://www.xbrl.org/2003/role/disclosureRef
-Topic 470
-SubTopic 10
-Name Accounting Standards Codification
-Section S99
-Paragraph 1B
-Subparagraph (SX 210.13-02(a)(5))
-Publisher FASB
-URI https://asc.fasb.org//1943274/2147480097/470-10-S99-1B
Reference 19: http://www.xbrl.org/2009/role/commonPracticeRef
-Topic 852
-SubTopic 10
-Name Accounting Standards Codification
-Section 50
-Paragraph 7
-Subparagraph (a)
-Publisher FASB
-URI https://asc.fasb.org//1943274/2147481404/852-10-50-7
Reference 20: http://www.xbrl.org/2009/role/commonPracticeRef
-Topic 852
-SubTopic 10
-Name Accounting Standards Codification
-Section 50
-Paragraph 7
-Subparagraph (b)
-Publisher FASB
-URI https://asc.fasb.org//1943274/2147481404/852-10-50-7
Reference 21: http://fasb.org/us-gaap/role/ref/legacyRef
-Name Accounting Standards Codification
-Topic 210
-SubTopic 10
-Section S99
-Paragraph 1
-Subparagraph (SX 210.5-02.21)
-Publisher FASB
-URI https://asc.fasb.org//1943274/2147480566/210-10-S99-1
| Name: |
us-gaap_LiabilitiesCurrent |
| Namespace Prefix: |
us-gaap_ |
| Data Type: |
xbrli:monetaryItemType |
| Balance Type: |
credit |
| Period Type: |
instant |
|
| X |
- References
+ Details
| Name: |
us-gaap_LiabilitiesCurrentAbstract |
| Namespace Prefix: |
us-gaap_ |
| Data Type: |
xbrli:stringItemType |
| Balance Type: |
na |
| Period Type: |
duration |
|
| X |
- DefinitionAmount of obligation due after one year or beyond the normal operating cycle, if longer. Reference 1: http://fasb.org/us-gaap/role/ref/legacyRef
-Name Accounting Standards Codification
-Section S99
-Paragraph 1
-Subparagraph (SX 210.5-02(22))
-SubTopic 10
-Topic 210
-Publisher FASB
-URI https://asc.fasb.org//1943274/2147480566/210-10-S99-1
Reference 2: http://www.xbrl.org/2003/role/disclosureRef
-Topic 810
-SubTopic 10
-Name Accounting Standards Codification
-Section 50
-Paragraph 3
-Subparagraph (c)
-Publisher FASB
-URI https://asc.fasb.org//1943274/2147481203/810-10-50-3
Reference 3: http://www.xbrl.org/2003/role/disclosureRef
-Topic 810
-SubTopic 10
-Name Accounting Standards Codification
-Section 45
-Paragraph 25
-Subparagraph (b)
-Publisher FASB
-URI https://asc.fasb.org//1943274/2147481231/810-10-45-25
Reference 4: http://www.xbrl.org/2003/role/disclosureRef
-Topic 810
-SubTopic 10
-Name Accounting Standards Codification
-Section 50
-Paragraph 3
-Subparagraph (bb)
-Publisher FASB
-URI https://asc.fasb.org//1943274/2147481203/810-10-50-3
Reference 5: http://www.xbrl.org/2003/role/disclosureRef
-Topic 235
-SubTopic 10
-Name Accounting Standards Codification
-Section S99
-Paragraph 1
-Subparagraph (SX 210.4-08(g)(1)(ii))
-Publisher FASB
-URI https://asc.fasb.org//1943274/2147480678/235-10-S99-1
Reference 6: http://www.xbrl.org/2003/role/disclosureRef
-Topic 323
-SubTopic 10
-Name Accounting Standards Codification
-Section 50
-Paragraph 3
-Subparagraph (c)
-Publisher FASB
-URI https://asc.fasb.org//1943274/2147481687/323-10-50-3
Reference 7: http://www.xbrl.org/2003/role/disclosureRef
-Topic 825
-SubTopic 10
-Name Accounting Standards Codification
-Section 50
-Paragraph 28
-Subparagraph (f)
-Publisher FASB
-URI https://asc.fasb.org//1943274/2147482907/825-10-50-28
Reference 8: http://www.xbrl.org/2003/role/disclosureRef
-Topic 470
-SubTopic 10
-Name Accounting Standards Codification
-Section S99
-Paragraph 1A
-Subparagraph (SX 210.13-01(a)(4)(i))
-Publisher FASB
-URI https://asc.fasb.org//1943274/2147480097/470-10-S99-1A
Reference 9: http://www.xbrl.org/2009/role/commonPracticeRef
-Topic 470
-SubTopic 10
-Name Accounting Standards Codification
-Section S99
-Paragraph 1A
-Subparagraph (SX 210.13-01(a)(4)(ii))
-Publisher FASB
-URI https://asc.fasb.org//1943274/2147480097/470-10-S99-1A
Reference 10: http://www.xbrl.org/2003/role/disclosureRef
-Topic 470
-SubTopic 10
-Name Accounting Standards Codification
-Section S99
-Paragraph 1A
-Subparagraph (SX 210.13-01(a)(4)(iii)(A))
-Publisher FASB
-URI https://asc.fasb.org//1943274/2147480097/470-10-S99-1A
Reference 11: http://www.xbrl.org/2003/role/disclosureRef
-Topic 470
-SubTopic 10
-Name Accounting Standards Codification
-Section S99
-Paragraph 1A
-Subparagraph (SX 210.13-01(a)(4)(iv))
-Publisher FASB
-URI https://asc.fasb.org//1943274/2147480097/470-10-S99-1A
Reference 12: http://www.xbrl.org/2003/role/disclosureRef
-Topic 470
-SubTopic 10
-Name Accounting Standards Codification
-Section S99
-Paragraph 1A
-Subparagraph (SX 210.13-01(a)(5))
-Publisher FASB
-URI https://asc.fasb.org//1943274/2147480097/470-10-S99-1A
Reference 13: http://www.xbrl.org/2003/role/disclosureRef
-Topic 470
-SubTopic 10
-Name Accounting Standards Codification
-Section S99
-Paragraph 1B
-Subparagraph (SX 210.13-02(a)(4)(i))
-Publisher FASB
-URI https://asc.fasb.org//1943274/2147480097/470-10-S99-1B
Reference 14: http://www.xbrl.org/2003/role/disclosureRef
-Topic 470
-SubTopic 10
-Name Accounting Standards Codification
-Section S99
-Paragraph 1B
-Subparagraph (SX 210.13-02(a)(4)(iii)(A))
-Publisher FASB
-URI https://asc.fasb.org//1943274/2147480097/470-10-S99-1B
Reference 15: http://www.xbrl.org/2003/role/disclosureRef
-Topic 470
-SubTopic 10
-Name Accounting Standards Codification
-Section S99
-Paragraph 1B
-Subparagraph (SX 210.13-02(a)(4)(iii)(B))
-Publisher FASB
-URI https://asc.fasb.org//1943274/2147480097/470-10-S99-1B
Reference 16: http://www.xbrl.org/2003/role/disclosureRef
-Topic 470
-SubTopic 10
-Name Accounting Standards Codification
-Section S99
-Paragraph 1B
-Subparagraph (SX 210.13-02(a)(4)(iv))
-Publisher FASB
-URI https://asc.fasb.org//1943274/2147480097/470-10-S99-1B
Reference 17: http://www.xbrl.org/2003/role/disclosureRef
-Topic 470
-SubTopic 10
-Name Accounting Standards Codification
-Section S99
-Paragraph 1B
-Subparagraph (SX 210.13-02(a)(5))
-Publisher FASB
-URI https://asc.fasb.org//1943274/2147480097/470-10-S99-1B
Reference 18: http://www.xbrl.org/2009/role/commonPracticeRef
-Topic 852
-SubTopic 10
-Name Accounting Standards Codification
-Section 50
-Paragraph 7
-Subparagraph (a)
-Publisher FASB
-URI https://asc.fasb.org//1943274/2147481404/852-10-50-7
Reference 19: http://www.xbrl.org/2009/role/commonPracticeRef
-Topic 852
-SubTopic 10
-Name Accounting Standards Codification
-Section 50
-Paragraph 7
-Subparagraph (b)
-Publisher FASB
-URI https://asc.fasb.org//1943274/2147481404/852-10-50-7
Reference 20: http://fasb.org/us-gaap/role/ref/legacyRef
-Topic 210
-SubTopic 10
-Name Accounting Standards Codification
-Section S99
-Paragraph 1
-Subparagraph (SX 210.5-02(23))
-Publisher FASB
-URI https://asc.fasb.org//1943274/2147480566/210-10-S99-1
Reference 21: http://fasb.org/us-gaap/role/ref/legacyRef
-Topic 210
-SubTopic 10
-Name Accounting Standards Codification
-Section S99
-Paragraph 1
-Subparagraph (SX 201.5-02(24))
-Publisher FASB
-URI https://asc.fasb.org//1943274/2147480566/210-10-S99-1
Reference 22: http://fasb.org/us-gaap/role/ref/legacyRef
-Topic 210
-SubTopic 10
-Name Accounting Standards Codification
-Section S99
-Paragraph 1
-Subparagraph (SX 201.5-02(25))
-Publisher FASB
-URI https://asc.fasb.org//1943274/2147480566/210-10-S99-1
Reference 23: http://fasb.org/us-gaap/role/ref/legacyRef
-Topic 210
-SubTopic 10
-Name Accounting Standards Codification
-Section S99
-Paragraph 1
-Subparagraph (SX 201.5-02(26))
-Publisher FASB
-URI https://asc.fasb.org//1943274/2147480566/210-10-S99-1
| Name: |
us-gaap_LiabilitiesNoncurrent |
| Namespace Prefix: |
us-gaap_ |
| Data Type: |
xbrli:monetaryItemType |
| Balance Type: |
credit |
| Period Type: |
instant |
|
| X |
- DefinitionCarrying value as of the balance sheet date of portion of long-term loans payable due within one year or the operating cycle if longer. Reference 1: http://fasb.org/us-gaap/role/ref/legacyRef
-Name Accounting Standards Codification
-Topic 210
-SubTopic 10
-Section S99
-Paragraph 1
-Subparagraph (SX 210.5-02.20)
-Publisher FASB
-URI https://asc.fasb.org//1943274/2147480566/210-10-S99-1
| Name: |
us-gaap_LoansPayableCurrent |
| Namespace Prefix: |
us-gaap_ |
| Data Type: |
xbrli:monetaryItemType |
| Balance Type: |
credit |
| Period Type: |
instant |
|
| X |
- DefinitionThe carrying value as of the balance sheet date of the noncurrent portion of long-term obligations drawn from a line of credit, which is a bank's commitment to make loans up to a specific amount. Examples of items that might be included in the application of this element may consist of letters of credit, standby letters of credit, and revolving credit arrangements, under which borrowings can be made up to a maximum amount as of any point in time conditional on satisfaction of specified terms before, as of and after the date of drawdowns on the line. Includes short-term obligations that would normally be classified as current liabilities but for which (a) postbalance sheet date issuance of a long term obligation to refinance the short term obligation on a long term basis, or (b) the enterprise has entered into a financing agreement that clearly permits the enterprise to refinance the short-term obligation on a long term basis and the following conditions are met (1) the agreement does not expire within 1 year and is not cancelable by the lender except for violation of an objectively determinable provision, (2) no violation exists at the BS date, and (3) the lender has entered into the financing agreement is expected to be financially capable of honoring the agreement. Reference 1: http://fasb.org/us-gaap/role/ref/legacyRef
-Name Accounting Standards Codification
-Topic 210
-SubTopic 10
-Section S99
-Paragraph 1
-Subparagraph (SX 210.5-02.22)
-Publisher FASB
-URI https://asc.fasb.org//1943274/2147480566/210-10-S99-1
Reference 2: http://fasb.org/us-gaap/role/ref/legacyRef
-Name Accounting Standards Codification
-Topic 470
-SubTopic 10
-Section 45
-Paragraph 13
-Publisher FASB
-URI https://asc.fasb.org//1943274/2147481573/470-10-45-13
Reference 3: http://fasb.org/us-gaap/role/ref/legacyRef
-Name Accounting Standards Codification
-Topic 470
-SubTopic 10
-Section 45
-Paragraph 14
-Publisher FASB
-URI https://asc.fasb.org//1943274/2147481573/470-10-45-14
| Name: |
us-gaap_LongTermLineOfCredit |
| Namespace Prefix: |
us-gaap_ |
| Data Type: |
xbrli:monetaryItemType |
| Balance Type: |
credit |
| Period Type: |
instant |
|
| X |
- DefinitionCarrying value as of the balance sheet date of loans payable (with maturities initially due after one year or beyond the operating cycle if longer), excluding current portion. Reference 1: http://fasb.org/us-gaap/role/ref/legacyRef
-Name Accounting Standards Codification
-Topic 210
-SubTopic 10
-Section S99
-Paragraph 1
-Subparagraph (SX 210.5-02.22)
-Publisher FASB
-URI https://asc.fasb.org//1943274/2147480566/210-10-S99-1
| Name: |
us-gaap_LongTermLoansPayable |
| Namespace Prefix: |
us-gaap_ |
| Data Type: |
xbrli:monetaryItemType |
| Balance Type: |
credit |
| Period Type: |
instant |
|
| X |
- DefinitionCarrying value as of the balance sheet date of notes payable (with maturities initially due after one year or beyond the operating cycle if longer), excluding current portion. Reference 1: http://fasb.org/us-gaap/role/ref/legacyRef
-Name Accounting Standards Codification
-Topic 210
-SubTopic 10
-Section S99
-Paragraph 1
-Subparagraph (SX 210.5-02.22)
-Publisher FASB
-URI https://asc.fasb.org//1943274/2147480566/210-10-S99-1
| Name: |
us-gaap_LongTermNotesPayable |
| Namespace Prefix: |
us-gaap_ |
| Data Type: |
xbrli:monetaryItemType |
| Balance Type: |
credit |
| Period Type: |
instant |
|
| X |
- DefinitionSum of the carrying values as of the balance sheet date of the portions of long-term notes payable due within one year or the operating cycle if longer. Reference 1: http://fasb.org/us-gaap/role/ref/legacyRef
-Name Accounting Standards Codification
-Topic 210
-SubTopic 10
-Section S99
-Paragraph 1
-Subparagraph (SX 210.5-02.19,20)
-Publisher FASB
-URI https://asc.fasb.org//1943274/2147480566/210-10-S99-1
| Name: |
us-gaap_NotesPayableCurrent |
| Namespace Prefix: |
us-gaap_ |
| Data Type: |
xbrli:monetaryItemType |
| Balance Type: |
credit |
| Period Type: |
instant |
|
| X |
- DefinitionPresent value of lessee's discounted obligation for lease payments from operating lease, classified as current. Reference 1: http://www.xbrl.org/2003/role/disclosureRef
-Topic 842
-SubTopic 20
-Name Accounting Standards Codification
-Section 45
-Paragraph 1
-Subparagraph (b)
-Publisher FASB
-URI https://asc.fasb.org//1943274/2147479041/842-20-45-1
| Name: |
us-gaap_OperatingLeaseLiabilityCurrent |
| Namespace Prefix: |
us-gaap_ |
| Data Type: |
xbrli:monetaryItemType |
| Balance Type: |
credit |
| Period Type: |
instant |
|
| X |
- DefinitionPresent value of lessee's discounted obligation for lease payments from operating lease, classified as noncurrent. Reference 1: http://www.xbrl.org/2003/role/disclosureRef
-Topic 842
-SubTopic 20
-Name Accounting Standards Codification
-Section 45
-Paragraph 1
-Subparagraph (b)
-Publisher FASB
-URI https://asc.fasb.org//1943274/2147479041/842-20-45-1
| Name: |
us-gaap_OperatingLeaseLiabilityNoncurrent |
| Namespace Prefix: |
us-gaap_ |
| Data Type: |
xbrli:monetaryItemType |
| Balance Type: |
credit |
| Period Type: |
instant |
|
| X |
- DefinitionAmount of lessee's right to use underlying asset under operating lease. Reference 1: http://www.xbrl.org/2003/role/disclosureRef
-Topic 842
-SubTopic 20
-Name Accounting Standards Codification
-Section 45
-Paragraph 1
-Subparagraph (a)
-Publisher FASB
-URI https://asc.fasb.org//1943274/2147479041/842-20-45-1
| Name: |
us-gaap_OperatingLeaseRightOfUseAsset |
| Namespace Prefix: |
us-gaap_ |
| Data Type: |
xbrli:monetaryItemType |
| Balance Type: |
debit |
| Period Type: |
instant |
|
| X |
- DefinitionAggregate par or stated value of issued nonredeemable preferred stock (or preferred stock redeemable solely at the option of the issuer). This item includes treasury stock repurchased by the entity. Note: elements for number of nonredeemable preferred shares, par value and other disclosure concepts are in another section within stockholders' equity. Reference 1: http://www.xbrl.org/2003/role/exampleRef
-Topic 852
-SubTopic 10
-Name Accounting Standards Codification
-Section 55
-Paragraph 10
-Publisher FASB
-URI https://asc.fasb.org//1943274/2147481372/852-10-55-10
Reference 2: http://www.xbrl.org/2003/role/disclosureRef
-Topic 944
-SubTopic 210
-Name Accounting Standards Codification
-Section S99
-Paragraph 1
-Subparagraph (SX 210.7-03(a)(21))
-Publisher FASB
-URI https://asc.fasb.org//1943274/2147479440/944-210-S99-1
Reference 3: http://fasb.org/us-gaap/role/ref/legacyRef
-Topic 210
-SubTopic 10
-Name Accounting Standards Codification
-Section S99
-Paragraph 1
-Subparagraph (SX 210.5-02(28))
-Publisher FASB
-URI https://asc.fasb.org//1943274/2147480566/210-10-S99-1
| Name: |
us-gaap_PreferredStockValue |
| Namespace Prefix: |
us-gaap_ |
| Data Type: |
xbrli:monetaryItemType |
| Balance Type: |
credit |
| Period Type: |
instant |
|
| X |
- DefinitionAmount of asset related to consideration paid in advance for costs that provide economic benefits in future periods, and amount of other assets that are expected to be realized or consumed within one year or the normal operating cycle, if longer. Reference 1: http://www.xbrl.org/2009/role/commonPracticeRef
-Topic 210
-SubTopic 10
-Name Accounting Standards Codification
-Section S99
-Paragraph 1
-Subparagraph (SX 210.5-02(9))
-Publisher FASB
-URI https://asc.fasb.org//1943274/2147480566/210-10-S99-1
| Name: |
us-gaap_PrepaidExpenseAndOtherAssetsCurrent |
| Namespace Prefix: |
us-gaap_ |
| Data Type: |
xbrli:monetaryItemType |
| Balance Type: |
debit |
| Period Type: |
instant |
|
| X |
- DefinitionAmount after accumulated depreciation, depletion and amortization of physical assets used in the normal conduct of business to produce goods and services and not intended for resale. Examples include, but are not limited to, land, buildings, machinery and equipment, office equipment, and furniture and fixtures. Reference 1: http://fasb.org/us-gaap/role/ref/legacyRef
-Name Accounting Standards Codification
-Section 50
-Paragraph 1
-SubTopic 10
-Topic 360
-Publisher FASB
-URI https://asc.fasb.org//1943274/2147482099/360-10-50-1
Reference 2: http://www.xbrl.org/2003/role/exampleRef
-Topic 852
-SubTopic 10
-Name Accounting Standards Codification
-Section 55
-Paragraph 10
-Publisher FASB
-URI https://asc.fasb.org//1943274/2147481372/852-10-55-10
Reference 3: http://www.xbrl.org/2003/role/disclosureRef
-Topic 944
-SubTopic 210
-Name Accounting Standards Codification
-Section S99
-Paragraph 1
-Subparagraph (SX 210.7-03(a)(8))
-Publisher FASB
-URI https://asc.fasb.org//1943274/2147479440/944-210-S99-1
Reference 4: http://www.xbrl.org/2003/role/disclosureRef
-Topic 942
-SubTopic 360
-Name Accounting Standards Codification
-Section 50
-Paragraph 1
-Publisher FASB
-URI https://asc.fasb.org//1943274/2147480842/942-360-50-1
| Name: |
us-gaap_PropertyPlantAndEquipmentNet |
| Namespace Prefix: |
us-gaap_ |
| Data Type: |
xbrli:monetaryItemType |
| Balance Type: |
debit |
| Period Type: |
instant |
|
| X |
- DefinitionAmount of accumulated undistributed earnings (deficit). Reference 1: http://www.xbrl.org/2003/role/exampleRef
-Topic 852
-SubTopic 10
-Name Accounting Standards Codification
-Section 55
-Paragraph 10
-Publisher FASB
-URI https://asc.fasb.org//1943274/2147481372/852-10-55-10
Reference 2: http://www.xbrl.org/2003/role/disclosureRef
-Topic 944
-SubTopic 40
-Name Accounting Standards Codification
-Section 65
-Paragraph 2
-Subparagraph (g)(2)(i)
-Publisher FASB
-URI https://asc.fasb.org//1943274/2147480016/944-40-65-2
Reference 3: http://www.xbrl.org/2003/role/disclosureRef
-Topic 944
-SubTopic 40
-Name Accounting Standards Codification
-Section 65
-Paragraph 2
-Subparagraph (h)(2)
-Publisher FASB
-URI https://asc.fasb.org//1943274/2147480016/944-40-65-2
Reference 4: http://www.xbrl.org/2003/role/disclosureRef
-Topic 946
-SubTopic 20
-Name Accounting Standards Codification
-Section 50
-Paragraph 11
-Publisher FASB
-URI https://asc.fasb.org//1943274/2147480990/946-20-50-11
Reference 5: http://www.xbrl.org/2003/role/disclosureRef
-Topic 944
-SubTopic 210
-Name Accounting Standards Codification
-Section S99
-Paragraph 1
-Subparagraph (SX 210.7-03(a)(23)(a)(4))
-Publisher FASB
-URI https://asc.fasb.org//1943274/2147479440/944-210-S99-1
Reference 6: http://www.xbrl.org/2003/role/disclosureRef
-Topic 946
-SubTopic 210
-Name Accounting Standards Codification
-Section S99
-Paragraph 1
-Subparagraph (SX 210.6-04(17))
-Publisher FASB
-URI https://asc.fasb.org//1943274/2147479617/946-210-S99-1
Reference 7: http://fasb.org/us-gaap/role/ref/legacyRef
-Topic 505
-SubTopic 10
-Name Accounting Standards Codification
-Section S99
-Paragraph 1
-Subparagraph (SX 210.3-04)
-Publisher FASB
-URI https://asc.fasb.org//1943274/2147480008/505-10-S99-1
Reference 8: http://fasb.org/us-gaap/role/ref/legacyRef
-Topic 210
-SubTopic 10
-Name Accounting Standards Codification
-Section S99
-Paragraph 1
-Subparagraph (SX 210.5-02(30)(a)(3))
-Publisher FASB
-URI https://asc.fasb.org//1943274/2147480566/210-10-S99-1
| Name: |
us-gaap_RetainedEarningsAccumulatedDeficit |
| Namespace Prefix: |
us-gaap_ |
| Data Type: |
xbrli:monetaryItemType |
| Balance Type: |
credit |
| Period Type: |
instant |
|
| X |
- DefinitionAmount of equity (deficit) attributable to parent. Excludes temporary equity and equity attributable to noncontrolling interest. Reference 1: http://www.xbrl.org/2003/role/exampleRef
-Topic 852
-SubTopic 10
-Name Accounting Standards Codification
-Section 55
-Paragraph 10
-Publisher FASB
-URI https://asc.fasb.org//1943274/2147481372/852-10-55-10
Reference 2: http://www.xbrl.org/2003/role/exampleRef
-Topic 946
-SubTopic 830
-Name Accounting Standards Codification
-Section 55
-Paragraph 12
-Publisher FASB
-URI https://asc.fasb.org//1943274/2147480167/946-830-55-12
Reference 3: http://www.xbrl.org/2003/role/disclosureRef
-Topic 946
-SubTopic 210
-Name Accounting Standards Codification
-Section S99
-Paragraph 1
-Subparagraph (SX 210.6-04(19))
-Publisher FASB
-URI https://asc.fasb.org//1943274/2147479617/946-210-S99-1
Reference 4: http://www.xbrl.org/2003/role/disclosureRef
-Topic 946
-SubTopic 210
-Name Accounting Standards Codification
-Section S99
-Paragraph 2
-Subparagraph (SX 210.6-05(4))
-Publisher FASB
-URI https://asc.fasb.org//1943274/2147479617/946-210-S99-2
Reference 5: http://www.xbrl.org/2009/role/commonPracticeRef
-Topic 946
-SubTopic 220
-Name Accounting Standards Codification
-Section S99
-Paragraph 3
-Subparagraph (SX 210.6-09(4)(b))
-Publisher FASB
-URI https://asc.fasb.org//1943274/2147483575/946-220-S99-3
Reference 6: http://www.xbrl.org/2003/role/disclosureRef
-Topic 946
-SubTopic 220
-Name Accounting Standards Codification
-Section S99
-Paragraph 3
-Subparagraph (SX 210.6-09(6))
-Publisher FASB
-URI https://asc.fasb.org//1943274/2147483575/946-220-S99-3
Reference 7: http://www.xbrl.org/2003/role/disclosureRef
-Topic 946
-SubTopic 220
-Name Accounting Standards Codification
-Section S99
-Paragraph 3
-Subparagraph (SX 210.6-09(7))
-Publisher FASB
-URI https://asc.fasb.org//1943274/2147483575/946-220-S99-3
Reference 8: http://www.xbrl.org/2009/role/commonPracticeRef
-Topic 235
-SubTopic 10
-Name Accounting Standards Codification
-Section S99
-Paragraph 1
-Subparagraph (SX 210.4-08(g)(1)(ii))
-Publisher FASB
-URI https://asc.fasb.org//1943274/2147480678/235-10-S99-1
Reference 9: http://www.xbrl.org/2009/role/commonPracticeRef
-Topic 323
-SubTopic 10
-Name Accounting Standards Codification
-Section 50
-Paragraph 3
-Subparagraph (c)
-Publisher FASB
-URI https://asc.fasb.org//1943274/2147481687/323-10-50-3
Reference 10: http://www.xbrl.org/2009/role/commonPracticeRef
-Topic 825
-SubTopic 10
-Name Accounting Standards Codification
-Section 50
-Paragraph 28
-Subparagraph (f)
-Publisher FASB
-URI https://asc.fasb.org//1943274/2147482907/825-10-50-28
Reference 11: http://fasb.org/us-gaap/role/ref/legacyRef
-Topic 210
-SubTopic 10
-Name Accounting Standards Codification
-Section S99
-Paragraph 1
-Subparagraph (SX 210.5-02(29))
-Publisher FASB
-URI https://asc.fasb.org//1943274/2147480566/210-10-S99-1
Reference 12: http://fasb.org/us-gaap/role/ref/legacyRef
-Topic 210
-SubTopic 10
-Name Accounting Standards Codification
-Section S99
-Paragraph 1
-Subparagraph (SX 210.5-02(31))
-Publisher FASB
-URI https://asc.fasb.org//1943274/2147480566/210-10-S99-1
Reference 13: http://fasb.org/us-gaap/role/ref/legacyRef
-Topic 210
-SubTopic 10
-Name Accounting Standards Codification
-Section S99
-Paragraph 1
-Subparagraph (SX 210.5-02(30))
-Publisher FASB
-URI https://asc.fasb.org//1943274/2147480566/210-10-S99-1
Reference 14: http://fasb.org/us-gaap/role/ref/legacyRef
-Topic 310
-SubTopic 10
-Name Accounting Standards Codification
-Section S99
-Paragraph 2
-Subparagraph (SAB Topic 4.E)
-Publisher FASB
-URI https://asc.fasb.org//1943274/2147480418/310-10-S99-2
| Name: |
us-gaap_StockholdersEquity |
| Namespace Prefix: |
us-gaap_ |
| Data Type: |
xbrli:monetaryItemType |
| Balance Type: |
credit |
| Period Type: |
instant |
|
| X |
- References
+ Details
| Name: |
us-gaap_StockholdersEquityAbstract |
| Namespace Prefix: |
us-gaap_ |
| Data Type: |
xbrli:stringItemType |
| Balance Type: |
na |
| Period Type: |
duration |
|
| X |
- DefinitionThe amount allocated to treasury stock. Treasury stock is common and preferred shares of an entity that were issued, repurchased by the entity, and are held in its treasury. Reference 1: http://fasb.org/us-gaap/role/ref/legacyRef
-Name Accounting Standards Codification
-Topic 505
-SubTopic 30
-Section 50
-Paragraph 4
-Publisher FASB
-URI https://asc.fasb.org//1943274/2147481520/505-30-50-4
Reference 2: http://fasb.org/us-gaap/role/ref/legacyRef
-Name Accounting Standards Codification
-Topic 505
-SubTopic 30
-Section 45
-Paragraph 1
-Publisher FASB
-URI https://asc.fasb.org//1943274/2147481549/505-30-45-1
Reference 3: http://fasb.org/us-gaap/role/ref/legacyRef
-Name Accounting Standards Codification
-Topic 210
-SubTopic 10
-Section S99
-Paragraph 1
-Subparagraph (SX 210.5-02.29,30)
-Publisher FASB
-URI https://asc.fasb.org//1943274/2147480566/210-10-S99-1
| Name: |
us-gaap_TreasuryStockValue |
| Namespace Prefix: |
us-gaap_ |
| Data Type: |
xbrli:monetaryItemType |
| Balance Type: |
debit |
| Period Type: |
instant |
|
| X |
- Details
| Name: |
us-gaap_StatementClassOfStockAxis=us-gaap_SeriesAPreferredStockMember |
| Namespace Prefix: |
|
| Data Type: |
na |
| Balance Type: |
|
| Period Type: |
|
|
| X |
- Details
| Name: |
us-gaap_StatementClassOfStockAxis=us-gaap_SeriesBPreferredStockMember |
| Namespace Prefix: |
|
| Data Type: |
na |
| Balance Type: |
|
| Period Type: |
|
|
v3.23.2
Condensed Consolidated Balance Sheets (Parenthetical) - USD ($)
|
Jul. 31, 2023 |
Jan. 31, 2023 |
| Net of debt discount, current |
$ 49,022
|
$ 60,082
|
| Preferred stock, par value |
$ 0.00001
|
$ 0.00001
|
| Preferred stock, shares authorized |
19,680,000
|
19,680,000
|
| Preferred stock, shares issued |
0
|
0
|
| Preferred stock, shares outstanding |
0
|
0
|
| Common stock, shares authorized |
250,000,000
|
250,000,000
|
| Common stock, shares issued |
37,343,387
|
36,317,857
|
| Common stock, shares outstanding |
37,343,387
|
36,317,857
|
| Treasury stock, shares |
230,000
|
230,000
|
| Series A Preferred Stock [Member] |
|
|
| Preferred stock, par value |
$ 0.00001
|
$ 0.00001
|
| Preferred stock, shares authorized |
120,000
|
120,000
|
| Preferred stock, shares issued |
23,400
|
23,400
|
| Preferred stock, shares outstanding |
0
|
0
|
| Series B Preferred Stock [Member] |
|
|
| Preferred stock, par value |
$ 0.00001
|
$ 0.00001
|
| Preferred stock, shares authorized |
200,000
|
200,000
|
| Preferred stock, shares issued |
0
|
54,600
|
| Preferred stock, shares outstanding |
0
|
54,600
|
| X |
- DefinitionThe maximum number of common shares permitted to be issued by an entity's charter and bylaws. Reference 1: http://www.xbrl.org/2003/role/disclosureRef
-Topic 946
-SubTopic 210
-Name Accounting Standards Codification
-Section S99
-Paragraph 1
-Subparagraph (SX 210.6-04(16)(a))
-Publisher FASB
-URI https://asc.fasb.org//1943274/2147479617/946-210-S99-1
Reference 2: http://fasb.org/us-gaap/role/ref/legacyRef
-Topic 210
-SubTopic 10
-Name Accounting Standards Codification
-Section S99
-Paragraph 1
-Subparagraph (SX 210.5-02(29))
-Publisher FASB
-URI https://asc.fasb.org//1943274/2147480566/210-10-S99-1
| Name: |
us-gaap_CommonStockSharesAuthorized |
| Namespace Prefix: |
us-gaap_ |
| Data Type: |
xbrli:sharesItemType |
| Balance Type: |
na |
| Period Type: |
instant |
|
| X |
- DefinitionTotal number of common shares of an entity that have been sold or granted to shareholders (includes common shares that were issued, repurchased and remain in the treasury). These shares represent capital invested by the firm's shareholders and owners, and may be all or only a portion of the number of shares authorized. Shares issued include shares outstanding and shares held in the treasury. Reference 1: http://fasb.org/us-gaap/role/ref/legacyRef
-Topic 210
-SubTopic 10
-Name Accounting Standards Codification
-Section S99
-Paragraph 1
-Subparagraph (SX 210.5-02(29))
-Publisher FASB
-URI https://asc.fasb.org//1943274/2147480566/210-10-S99-1
| Name: |
us-gaap_CommonStockSharesIssued |
| Namespace Prefix: |
us-gaap_ |
| Data Type: |
xbrli:sharesItemType |
| Balance Type: |
na |
| Period Type: |
instant |
|
| X |
- DefinitionNumber of shares of common stock outstanding. Common stock represent the ownership interest in a corporation. Reference 1: http://fasb.org/us-gaap/role/ref/legacyRef
-Name Accounting Standards Codification
-Section 50
-Paragraph 2
-SubTopic 10
-Topic 505
-Publisher FASB
-URI https://asc.fasb.org//1943274/2147481112/505-10-50-2
Reference 2: http://www.xbrl.org/2003/role/disclosureRef
-Topic 946
-SubTopic 210
-Name Accounting Standards Codification
-Section S99
-Paragraph 2
-Subparagraph (SX 210.6-05(4))
-Publisher FASB
-URI https://asc.fasb.org//1943274/2147479617/946-210-S99-2
Reference 3: http://www.xbrl.org/2009/role/commonPracticeRef
-Topic 946
-SubTopic 220
-Name Accounting Standards Codification
-Section S99
-Paragraph 3
-Subparagraph (SX 210.6-09(4)(b))
-Publisher FASB
-URI https://asc.fasb.org//1943274/2147483575/946-220-S99-3
Reference 4: http://www.xbrl.org/2003/role/disclosureRef
-Topic 946
-SubTopic 210
-Name Accounting Standards Codification
-Section S99
-Paragraph 1
-Subparagraph (SX 210.6-04(16)(a))
-Publisher FASB
-URI https://asc.fasb.org//1943274/2147479617/946-210-S99-1
Reference 5: http://www.xbrl.org/2009/role/commonPracticeRef
-Topic 946
-SubTopic 220
-Name Accounting Standards Codification
-Section S99
-Paragraph 3
-Subparagraph (SX 210.6-09(7))
-Publisher FASB
-URI https://asc.fasb.org//1943274/2147483575/946-220-S99-3
Reference 6: http://fasb.org/us-gaap/role/ref/legacyRef
-Topic 210
-SubTopic 10
-Name Accounting Standards Codification
-Section S99
-Paragraph 1
-Subparagraph (SX 210.5-02(29))
-Publisher FASB
-URI https://asc.fasb.org//1943274/2147480566/210-10-S99-1
| Name: |
us-gaap_CommonStockSharesOutstanding |
| Namespace Prefix: |
us-gaap_ |
| Data Type: |
xbrli:sharesItemType |
| Balance Type: |
na |
| Period Type: |
instant |
|
| X |
- DefinitionAmount of debt discount to be amortized within one year or within the normal operating cycle, if longer. Reference 1: http://fasb.org/us-gaap/role/ref/legacyRef
-Name Accounting Standards Codification
-Topic 835
-SubTopic 30
-Section 45
-Paragraph 1A
-Publisher FASB
-URI https://asc.fasb.org//1943274/2147482925/835-30-45-1A
Reference 2: http://fasb.org/us-gaap/role/ref/legacyRef
-Name Accounting Standards Codification
-Topic 835
-SubTopic 30
-Section 55
-Paragraph 8
-Publisher FASB
-URI https://asc.fasb.org//1943274/2147482949/835-30-55-8
| Name: |
us-gaap_DebtInstrumentUnamortizedDiscountCurrent |
| Namespace Prefix: |
us-gaap_ |
| Data Type: |
xbrli:monetaryItemType |
| Balance Type: |
debit |
| Period Type: |
instant |
|
| X |
- DefinitionFace amount or stated value per share of preferred stock nonredeemable or redeemable solely at the option of the issuer. Reference 1: http://www.xbrl.org/2003/role/disclosureRef
-Topic 505
-SubTopic 10
-Name Accounting Standards Codification
-Section 50
-Paragraph 13
-Subparagraph (a)
-Publisher FASB
-URI https://asc.fasb.org//1943274/2147481112/505-10-50-13
Reference 2: http://fasb.org/us-gaap/role/ref/legacyRef
-Topic 210
-SubTopic 10
-Name Accounting Standards Codification
-Section S99
-Paragraph 1
-Subparagraph (SX 210.5-02(28))
-Publisher FASB
-URI https://asc.fasb.org//1943274/2147480566/210-10-S99-1
| Name: |
us-gaap_PreferredStockParOrStatedValuePerShare |
| Namespace Prefix: |
us-gaap_ |
| Data Type: |
dtr-types:perShareItemType |
| Balance Type: |
na |
| Period Type: |
instant |
|
| X |
- DefinitionThe maximum number of nonredeemable preferred shares (or preferred stock redeemable solely at the option of the issuer) permitted to be issued by an entity's charter and bylaws. Reference 1: http://www.xbrl.org/2003/role/disclosureRef
-Topic 946
-SubTopic 210
-Name Accounting Standards Codification
-Section S99
-Paragraph 1
-Subparagraph (SX 210.6-04(16)(a))
-Publisher FASB
-URI https://asc.fasb.org//1943274/2147479617/946-210-S99-1
Reference 2: http://fasb.org/us-gaap/role/ref/legacyRef
-Topic 210
-SubTopic 10
-Name Accounting Standards Codification
-Section S99
-Paragraph 1
-Subparagraph (SX 210.5-02(28))
-Publisher FASB
-URI https://asc.fasb.org//1943274/2147480566/210-10-S99-1
| Name: |
us-gaap_PreferredStockSharesAuthorized |
| Namespace Prefix: |
us-gaap_ |
| Data Type: |
xbrli:sharesItemType |
| Balance Type: |
na |
| Period Type: |
instant |
|
| X |
- DefinitionTotal number of nonredeemable preferred shares (or preferred stock redeemable solely at the option of the issuer) issued to shareholders (includes related preferred shares that were issued, repurchased, and remain in the treasury). May be all or portion of the number of preferred shares authorized. Excludes preferred shares that are classified as debt. Reference 1: http://www.xbrl.org/2003/role/disclosureRef
-Topic 505
-SubTopic 10
-Name Accounting Standards Codification
-Section 50
-Paragraph 13
-Subparagraph (a)
-Publisher FASB
-URI https://asc.fasb.org//1943274/2147481112/505-10-50-13
Reference 2: http://fasb.org/us-gaap/role/ref/legacyRef
-Topic 210
-SubTopic 10
-Name Accounting Standards Codification
-Section S99
-Paragraph 1
-Subparagraph (SX 210.5-02(28))
-Publisher FASB
-URI https://asc.fasb.org//1943274/2147480566/210-10-S99-1
| Name: |
us-gaap_PreferredStockSharesIssued |
| Namespace Prefix: |
us-gaap_ |
| Data Type: |
xbrli:sharesItemType |
| Balance Type: |
na |
| Period Type: |
instant |
|
| X |
- DefinitionAggregate share number for all nonredeemable preferred stock (or preferred stock redeemable solely at the option of the issuer) held by stockholders. Does not include preferred shares that have been repurchased. Reference 1: http://www.xbrl.org/2003/role/disclosureRef
-Topic 946
-SubTopic 210
-Name Accounting Standards Codification
-Section S99
-Paragraph 2
-Subparagraph (SX 210.6-05(4))
-Publisher FASB
-URI https://asc.fasb.org//1943274/2147479617/946-210-S99-2
Reference 2: http://www.xbrl.org/2009/role/commonPracticeRef
-Topic 946
-SubTopic 220
-Name Accounting Standards Codification
-Section S99
-Paragraph 3
-Subparagraph (SX 210.6-09(4)(b))
-Publisher FASB
-URI https://asc.fasb.org//1943274/2147483575/946-220-S99-3
Reference 3: http://www.xbrl.org/2003/role/disclosureRef
-Topic 946
-SubTopic 210
-Name Accounting Standards Codification
-Section S99
-Paragraph 1
-Subparagraph (SX 210.6-04(16)(a))
-Publisher FASB
-URI https://asc.fasb.org//1943274/2147479617/946-210-S99-1
Reference 4: http://www.xbrl.org/2009/role/commonPracticeRef
-Topic 946
-SubTopic 220
-Name Accounting Standards Codification
-Section S99
-Paragraph 3
-Subparagraph (SX 210.6-09(7))
-Publisher FASB
-URI https://asc.fasb.org//1943274/2147483575/946-220-S99-3
Reference 5: http://fasb.org/us-gaap/role/ref/legacyRef
-Topic 210
-SubTopic 10
-Name Accounting Standards Codification
-Section S99
-Paragraph 1
-Subparagraph (SX 210.5-02(28))
-Publisher FASB
-URI https://asc.fasb.org//1943274/2147480566/210-10-S99-1
| Name: |
us-gaap_PreferredStockSharesOutstanding |
| Namespace Prefix: |
us-gaap_ |
| Data Type: |
xbrli:sharesItemType |
| Balance Type: |
na |
| Period Type: |
instant |
|
| X |
- DefinitionNumber of previously issued common shares repurchased by the issuing entity and held in treasury. Reference 1: http://fasb.org/us-gaap/role/ref/legacyRef
-Name Accounting Standards Codification
-Topic 505
-SubTopic 30
-Section 45
-Paragraph 1
-Publisher FASB
-URI https://asc.fasb.org//1943274/2147481549/505-30-45-1
| Name: |
us-gaap_TreasuryStockCommonShares |
| Namespace Prefix: |
us-gaap_ |
| Data Type: |
xbrli:sharesItemType |
| Balance Type: |
na |
| Period Type: |
instant |
|
| X |
- Details
| Name: |
us-gaap_StatementClassOfStockAxis=us-gaap_SeriesAPreferredStockMember |
| Namespace Prefix: |
|
| Data Type: |
na |
| Balance Type: |
|
| Period Type: |
|
|
| X |
- Details
| Name: |
us-gaap_StatementClassOfStockAxis=us-gaap_SeriesBPreferredStockMember |
| Namespace Prefix: |
|
| Data Type: |
na |
| Balance Type: |
|
| Period Type: |
|
|
v3.23.2
Condensed Consolidated Statements of Operations (Unaudited) - USD ($)
|
3 Months Ended |
6 Months Ended |
Jul. 31, 2023 |
Jul. 31, 2022 |
Jul. 31, 2023 |
Jul. 31, 2022 |
| Income Statement [Abstract] |
|
|
|
|
| Net sales |
$ 24,790,085
|
$ 22,846,474
|
$ 47,910,901
|
$ 44,677,054
|
| Costs of sales |
17,283,847
|
20,119,862
|
34,033,663
|
38,090,179
|
| Gross profit |
7,506,238
|
2,726,612
|
13,877,238
|
6,586,875
|
| Operating expenses: |
|
|
|
|
| Research and development |
94,871
|
41,792
|
166,056
|
68,327
|
| Selling, general and administrative |
5,135,537
|
3,516,115
|
9,492,568
|
7,088,870
|
| Total operating expenses |
5,230,408
|
3,557,907
|
9,658,624
|
7,157,197
|
| Income (loss) from operations |
2,275,830
|
(831,295)
|
4,218,614
|
(570,322)
|
| Other income (expenses) |
|
|
|
|
| Interest, net |
(181,658)
|
(139,064)
|
(359,052)
|
(263,315)
|
| Amortization of debt discount |
(5,530)
|
(3,015)
|
(11,060)
|
(6,655)
|
| Other income |
7,449
|
2,596
|
27,449
|
2,596
|
| Total other expenses |
(179,739)
|
(139,483)
|
(342,663)
|
(267,374)
|
| Net income (loss) before income tax provision and income from equity method investment |
2,096,091
|
(970,778)
|
3,875,951
|
(837,696)
|
| Income from equity method investment |
77,584
|
18,540
|
223,342
|
18,540
|
| Income tax (provision) benefit |
(429,764)
|
208,992
|
(954,456)
|
179,607
|
| Net income (loss) |
1,743,911
|
(743,246)
|
3,144,837
|
(639,549)
|
| Less: series B preferred dividends |
(21,233)
|
|
(48,533)
|
|
| Net Income available to common stockholders |
$ 1,722,678
|
$ (743,246)
|
$ 3,096,304
|
$ (639,549)
|
| Net income (loss) per common share |
|
|
|
|
| – basic |
$ 0.05
|
$ (0.02)
|
$ 0.09
|
$ (0.02)
|
| – diluted |
$ 0.05
|
$ (0.02)
|
$ 0.08
|
$ (0.02)
|
| Weighted average common shares outstanding |
|
|
|
|
| – basic |
36,855,181
|
35,811,087
|
36,628,429
|
35,785,719
|
| – diluted |
37,490,567
|
35,811,087
|
37,195,314
|
35,785,719
|
| X |
- DefinitionAmount of noncash expense included in interest expense to amortize debt discount and premium associated with the related debt instruments. Excludes amortization of financing costs. Alternate captions include noncash interest expense. Reference 1: http://fasb.org/us-gaap/role/ref/legacyRef
-Name Accounting Standards Codification
-Section 45
-Paragraph 28
-Subparagraph (b)
-SubTopic 10
-Topic 230
-Publisher FASB
-URI https://asc.fasb.org//1943274/2147482740/230-10-45-28
Reference 2: http://www.xbrl.org/2003/role/disclosureRef
-Topic 470
-SubTopic 20
-Name Accounting Standards Codification
-Section 50
-Paragraph 1F
-Subparagraph (b)(2)
-Publisher FASB
-URI https://asc.fasb.org//1943274/2147481139/470-20-50-1F
Reference 3: http://fasb.org/us-gaap/role/ref/legacyRef
-Name Accounting Standards Codification
-Topic 835
-SubTopic 30
-Section 45
-Paragraph 1A
-Publisher FASB
-URI https://asc.fasb.org//1943274/2147482925/835-30-45-1A
Reference 4: http://fasb.org/us-gaap/role/ref/legacyRef
-Topic 220
-SubTopic 10
-Name Accounting Standards Codification
-Section S99
-Paragraph 2
-Subparagraph (SX 210.5-03.8)
-Publisher FASB
-URI https://asc.fasb.org//1943274/2147483621/220-10-S99-2
| Name: |
us-gaap_AmortizationOfDebtDiscountPremium |
| Namespace Prefix: |
us-gaap_ |
| Data Type: |
xbrli:monetaryItemType |
| Balance Type: |
debit |
| Period Type: |
duration |
|
| X |
- DefinitionThe aggregate costs related to goods produced and sold and services rendered by an entity during the reporting period. This excludes costs incurred during the reporting period related to financial services rendered and other revenue generating activities. Reference 1: http://www.xbrl.org/2003/role/disclosureRef
-Topic 924
-SubTopic 10
-Name Accounting Standards Codification
-Section S99
-Paragraph 1
-Subparagraph (SAB Topic 11.L)
-Publisher FASB
-URI https://asc.fasb.org//1943274/2147479941/924-10-S99-1
Reference 2: http://fasb.org/us-gaap/role/ref/legacyRef
-Topic 220
-SubTopic 10
-Name Accounting Standards Codification
-Section S99
-Paragraph 2
-Subparagraph (SX 210.5-03.2(a),(d))
-Publisher FASB
-URI https://asc.fasb.org//1943274/2147483621/220-10-S99-2
| Name: |
us-gaap_CostOfGoodsAndServicesSold |
| Namespace Prefix: |
us-gaap_ |
| Data Type: |
xbrli:monetaryItemType |
| Balance Type: |
debit |
| Period Type: |
duration |
|
| X |
- References
+ Details
| Name: |
us-gaap_EarningsPerShareAbstract |
| Namespace Prefix: |
us-gaap_ |
| Data Type: |
xbrli:stringItemType |
| Balance Type: |
na |
| Period Type: |
duration |
|
| X |
- DefinitionThe amount of net income (loss) for the period per each share of common stock or unit outstanding during the reporting period. Reference 1: http://www.xbrl.org/2003/role/disclosureRef
-Topic 250
-SubTopic 10
-Name Accounting Standards Codification
-Section 50
-Paragraph 3
-Publisher FASB
-URI https://asc.fasb.org//1943274/2147483443/250-10-50-3
Reference 2: http://www.xbrl.org/2003/role/disclosureRef
-Topic 260
-SubTopic 10
-Name Accounting Standards Codification
-Section 55
-Paragraph 15
-Publisher FASB
-URI https://asc.fasb.org//1943274/2147482635/260-10-55-15
Reference 3: http://www.xbrl.org/2003/role/disclosureRef
-Topic 815
-SubTopic 40
-Name Accounting Standards Codification
-Section 65
-Paragraph 1
-Subparagraph (e)(4)
-Publisher FASB
-URI https://asc.fasb.org//1943274/2147480175/815-40-65-1
Reference 4: http://www.xbrl.org/2003/role/disclosureRef
-Topic 815
-SubTopic 40
-Name Accounting Standards Codification
-Section 65
-Paragraph 1
-Subparagraph (f)
-Publisher FASB
-URI https://asc.fasb.org//1943274/2147480175/815-40-65-1
Reference 5: http://www.xbrl.org/2003/role/disclosureRef
-Topic 250
-SubTopic 10
-Name Accounting Standards Codification
-Section 50
-Paragraph 11
-Subparagraph (a)
-Publisher FASB
-URI https://asc.fasb.org//1943274/2147483443/250-10-50-11
Reference 6: http://www.xbrl.org/2003/role/disclosureRef
-Topic 250
-SubTopic 10
-Name Accounting Standards Codification
-Section 50
-Paragraph 11
-Subparagraph (b)
-Publisher FASB
-URI https://asc.fasb.org//1943274/2147483443/250-10-50-11
Reference 7: http://www.xbrl.org/2003/role/disclosureRef
-Topic 250
-SubTopic 10
-Name Accounting Standards Codification
-Section 50
-Paragraph 7
-Subparagraph (a)
-Publisher FASB
-URI https://asc.fasb.org//1943274/2147483443/250-10-50-7
Reference 8: http://www.xbrl.org/2003/role/disclosureRef
-Topic 260
-SubTopic 10
-Name Accounting Standards Codification
-Section 45
-Paragraph 2
-Publisher FASB
-URI https://asc.fasb.org//1943274/2147482689/260-10-45-2
Reference 9: http://www.xbrl.org/2003/role/disclosureRef
-Topic 260
-SubTopic 10
-Name Accounting Standards Codification
-Section 45
-Paragraph 60B
-Subparagraph (d)
-Publisher FASB
-URI https://asc.fasb.org//1943274/2147482689/260-10-45-60B
Reference 10: http://www.xbrl.org/2003/role/disclosureRef
-Topic 250
-SubTopic 10
-Name Accounting Standards Codification
-Section 50
-Paragraph 4
-Publisher FASB
-URI https://asc.fasb.org//1943274/2147483443/250-10-50-4
Reference 11: http://www.xbrl.org/2003/role/disclosureRef
-Topic 260
-SubTopic 10
-Name Accounting Standards Codification
-Section 50
-Paragraph 1
-Subparagraph (a)
-Publisher FASB
-URI https://asc.fasb.org//1943274/2147482662/260-10-50-1
Reference 12: http://www.xbrl.org/2003/role/disclosureRef
-Topic 260
-SubTopic 10
-Name Accounting Standards Codification
-Section 45
-Paragraph 10
-Publisher FASB
-URI https://asc.fasb.org//1943274/2147482689/260-10-45-10
Reference 13: http://www.xbrl.org/2003/role/disclosureRef
-Topic 220
-SubTopic 10
-Name Accounting Standards Codification
-Section S99
-Paragraph 2
-Subparagraph (SX 210.5-03(25))
-Publisher FASB
-URI https://asc.fasb.org//1943274/2147483621/220-10-S99-2
Reference 14: http://www.xbrl.org/2003/role/disclosureRef
-Topic 942
-SubTopic 220
-Name Accounting Standards Codification
-Section S99
-Paragraph 1
-Subparagraph (SX 210.9-04(27))
-Publisher FASB
-URI https://asc.fasb.org//1943274/2147483589/942-220-S99-1
Reference 15: http://www.xbrl.org/2003/role/disclosureRef
-Topic 944
-SubTopic 220
-Name Accounting Standards Codification
-Section S99
-Paragraph 1
-Subparagraph (SX 210.7-04(23))
-Publisher FASB
-URI https://asc.fasb.org//1943274/2147483586/944-220-S99-1
Reference 16: http://www.xbrl.org/2003/role/exampleRef
-Topic 260
-SubTopic 10
-Name Accounting Standards Codification
-Section 55
-Paragraph 52
-Publisher FASB
-URI https://asc.fasb.org//1943274/2147482635/260-10-55-52
Reference 17: http://www.xbrl.org/2003/role/disclosureRef
-Topic 260
-SubTopic 10
-Name Accounting Standards Codification
-Section 45
-Paragraph 7
-Publisher FASB
-URI https://asc.fasb.org//1943274/2147482689/260-10-45-7
| Name: |
us-gaap_EarningsPerShareBasic |
| Namespace Prefix: |
us-gaap_ |
| Data Type: |
dtr-types:perShareItemType |
| Balance Type: |
na |
| Period Type: |
duration |
|
| X |
- DefinitionThe amount of net income (loss) for the period available to each share of common stock or common unit outstanding during the reporting period and to each share or unit that would have been outstanding assuming the issuance of common shares or units for all dilutive potential common shares or units outstanding during the reporting period. Reference 1: http://www.xbrl.org/2003/role/disclosureRef
-Topic 250
-SubTopic 10
-Name Accounting Standards Codification
-Section 50
-Paragraph 3
-Publisher FASB
-URI https://asc.fasb.org//1943274/2147483443/250-10-50-3
Reference 2: http://www.xbrl.org/2003/role/disclosureRef
-Topic 260
-SubTopic 10
-Name Accounting Standards Codification
-Section 55
-Paragraph 15
-Publisher FASB
-URI https://asc.fasb.org//1943274/2147482635/260-10-55-15
Reference 3: http://www.xbrl.org/2003/role/disclosureRef
-Topic 815
-SubTopic 40
-Name Accounting Standards Codification
-Section 65
-Paragraph 1
-Subparagraph (e)(4)
-Publisher FASB
-URI https://asc.fasb.org//1943274/2147480175/815-40-65-1
Reference 4: http://www.xbrl.org/2003/role/disclosureRef
-Topic 815
-SubTopic 40
-Name Accounting Standards Codification
-Section 65
-Paragraph 1
-Subparagraph (f)
-Publisher FASB
-URI https://asc.fasb.org//1943274/2147480175/815-40-65-1
Reference 5: http://www.xbrl.org/2003/role/disclosureRef
-Topic 250
-SubTopic 10
-Name Accounting Standards Codification
-Section 50
-Paragraph 11
-Subparagraph (a)
-Publisher FASB
-URI https://asc.fasb.org//1943274/2147483443/250-10-50-11
Reference 6: http://www.xbrl.org/2003/role/disclosureRef
-Topic 250
-SubTopic 10
-Name Accounting Standards Codification
-Section 50
-Paragraph 11
-Subparagraph (b)
-Publisher FASB
-URI https://asc.fasb.org//1943274/2147483443/250-10-50-11
Reference 7: http://www.xbrl.org/2003/role/disclosureRef
-Topic 250
-SubTopic 10
-Name Accounting Standards Codification
-Section 50
-Paragraph 7
-Subparagraph (a)
-Publisher FASB
-URI https://asc.fasb.org//1943274/2147483443/250-10-50-7
Reference 8: http://www.xbrl.org/2003/role/disclosureRef
-Topic 260
-SubTopic 10
-Name Accounting Standards Codification
-Section 45
-Paragraph 2
-Publisher FASB
-URI https://asc.fasb.org//1943274/2147482689/260-10-45-2
Reference 9: http://www.xbrl.org/2003/role/disclosureRef
-Topic 260
-SubTopic 10
-Name Accounting Standards Codification
-Section 45
-Paragraph 60B
-Subparagraph (d)
-Publisher FASB
-URI https://asc.fasb.org//1943274/2147482689/260-10-45-60B
Reference 10: http://www.xbrl.org/2003/role/disclosureRef
-Topic 250
-SubTopic 10
-Name Accounting Standards Codification
-Section 50
-Paragraph 4
-Publisher FASB
-URI https://asc.fasb.org//1943274/2147483443/250-10-50-4
Reference 11: http://www.xbrl.org/2003/role/disclosureRef
-Topic 260
-SubTopic 10
-Name Accounting Standards Codification
-Section 50
-Paragraph 1
-Subparagraph (a)
-Publisher FASB
-URI https://asc.fasb.org//1943274/2147482662/260-10-50-1
Reference 12: http://www.xbrl.org/2003/role/disclosureRef
-Topic 220
-SubTopic 10
-Name Accounting Standards Codification
-Section S99
-Paragraph 2
-Subparagraph (SX 210.5-03(25))
-Publisher FASB
-URI https://asc.fasb.org//1943274/2147483621/220-10-S99-2
Reference 13: http://www.xbrl.org/2003/role/disclosureRef
-Topic 942
-SubTopic 220
-Name Accounting Standards Codification
-Section S99
-Paragraph 1
-Subparagraph (SX 210.9-04(27))
-Publisher FASB
-URI https://asc.fasb.org//1943274/2147483589/942-220-S99-1
Reference 14: http://www.xbrl.org/2003/role/disclosureRef
-Topic 944
-SubTopic 220
-Name Accounting Standards Codification
-Section S99
-Paragraph 1
-Subparagraph (SX 210.7-04(23))
-Publisher FASB
-URI https://asc.fasb.org//1943274/2147483586/944-220-S99-1
Reference 15: http://www.xbrl.org/2003/role/exampleRef
-Topic 260
-SubTopic 10
-Name Accounting Standards Codification
-Section 55
-Paragraph 52
-Publisher FASB
-URI https://asc.fasb.org//1943274/2147482635/260-10-55-52
Reference 16: http://www.xbrl.org/2003/role/disclosureRef
-Topic 260
-SubTopic 10
-Name Accounting Standards Codification
-Section 45
-Paragraph 7
-Publisher FASB
-URI https://asc.fasb.org//1943274/2147482689/260-10-45-7
| Name: |
us-gaap_EarningsPerShareDiluted |
| Namespace Prefix: |
us-gaap_ |
| Data Type: |
dtr-types:perShareItemType |
| Balance Type: |
na |
| Period Type: |
duration |
|
| X |
- DefinitionThe aggregate total of expenses of managing and administering the affairs of an entity, including affiliates of the reporting entity, which are not directly or indirectly associated with the manufacture, sale or creation of a product or product line. Reference 1: http://www.xbrl.org/2003/role/disclosureRef
-Topic 946
-SubTopic 220
-Name Accounting Standards Codification
-Section S99
-Paragraph 1
-Subparagraph (SX 210.6-07(2)(a))
-Publisher FASB
-URI https://asc.fasb.org//1943274/2147483575/946-220-S99-1
Reference 2: http://fasb.org/us-gaap/role/ref/legacyRef
-Topic 220
-SubTopic 10
-Name Accounting Standards Codification
-Section S99
-Paragraph 2
-Subparagraph (SX 210.5-03.4)
-Publisher FASB
-URI https://asc.fasb.org//1943274/2147483621/220-10-S99-2
| Name: |
us-gaap_GeneralAndAdministrativeExpense |
| Namespace Prefix: |
us-gaap_ |
| Data Type: |
xbrli:monetaryItemType |
| Balance Type: |
debit |
| Period Type: |
duration |
|
| X |
- DefinitionAggregate revenue less cost of goods and services sold or operating expenses directly attributable to the revenue generation activity. Reference 1: http://www.xbrl.org/2003/role/disclosureRef
-Topic 235
-SubTopic 10
-Name Accounting Standards Codification
-Section S99
-Paragraph 1
-Subparagraph (SX 210.4-08(g)(1)(ii))
-Publisher FASB
-URI https://asc.fasb.org//1943274/2147480678/235-10-S99-1
Reference 2: http://www.xbrl.org/2003/role/disclosureRef
-Topic 323
-SubTopic 10
-Name Accounting Standards Codification
-Section 50
-Paragraph 3
-Subparagraph (c)
-Publisher FASB
-URI https://asc.fasb.org//1943274/2147481687/323-10-50-3
Reference 3: http://www.xbrl.org/2003/role/disclosureRef
-Topic 825
-SubTopic 10
-Name Accounting Standards Codification
-Section 50
-Paragraph 28
-Subparagraph (f)
-Publisher FASB
-URI https://asc.fasb.org//1943274/2147482907/825-10-50-28
Reference 4: http://www.xbrl.org/2003/role/disclosureRef
-Topic 280
-SubTopic 10
-Name Accounting Standards Codification
-Section 50
-Paragraph 22
-Publisher FASB
-URI https://asc.fasb.org//1943274/2147482810/280-10-50-22
Reference 5: http://www.xbrl.org/2003/role/disclosureRef
-Topic 470
-SubTopic 10
-Name Accounting Standards Codification
-Section S99
-Paragraph 1A
-Subparagraph (SX 210.13-01(a)(4)(i))
-Publisher FASB
-URI https://asc.fasb.org//1943274/2147480097/470-10-S99-1A
Reference 6: http://www.xbrl.org/2009/role/commonPracticeRef
-Topic 470
-SubTopic 10
-Name Accounting Standards Codification
-Section S99
-Paragraph 1A
-Subparagraph (SX 210.13-01(a)(4)(ii))
-Publisher FASB
-URI https://asc.fasb.org//1943274/2147480097/470-10-S99-1A
Reference 7: http://www.xbrl.org/2003/role/disclosureRef
-Topic 470
-SubTopic 10
-Name Accounting Standards Codification
-Section S99
-Paragraph 1A
-Subparagraph (SX 210.13-01(a)(4)(iii)(A))
-Publisher FASB
-URI https://asc.fasb.org//1943274/2147480097/470-10-S99-1A
Reference 8: http://www.xbrl.org/2003/role/disclosureRef
-Topic 470
-SubTopic 10
-Name Accounting Standards Codification
-Section S99
-Paragraph 1A
-Subparagraph (SX 210.13-01(a)(4)(iv))
-Publisher FASB
-URI https://asc.fasb.org//1943274/2147480097/470-10-S99-1A
Reference 9: http://www.xbrl.org/2003/role/disclosureRef
-Topic 470
-SubTopic 10
-Name Accounting Standards Codification
-Section S99
-Paragraph 1A
-Subparagraph (SX 210.13-01(a)(5))
-Publisher FASB
-URI https://asc.fasb.org//1943274/2147480097/470-10-S99-1A
Reference 10: http://www.xbrl.org/2003/role/disclosureRef
-Topic 470
-SubTopic 10
-Name Accounting Standards Codification
-Section S99
-Paragraph 1B
-Subparagraph (SX 210.13-02(a)(4)(i))
-Publisher FASB
-URI https://asc.fasb.org//1943274/2147480097/470-10-S99-1B
Reference 11: http://www.xbrl.org/2003/role/disclosureRef
-Topic 470
-SubTopic 10
-Name Accounting Standards Codification
-Section S99
-Paragraph 1B
-Subparagraph (SX 210.13-02(a)(4)(iii)(A))
-Publisher FASB
-URI https://asc.fasb.org//1943274/2147480097/470-10-S99-1B
Reference 12: http://www.xbrl.org/2003/role/disclosureRef
-Topic 470
-SubTopic 10
-Name Accounting Standards Codification
-Section S99
-Paragraph 1B
-Subparagraph (SX 210.13-02(a)(4)(iii)(B))
-Publisher FASB
-URI https://asc.fasb.org//1943274/2147480097/470-10-S99-1B
Reference 13: http://www.xbrl.org/2003/role/disclosureRef
-Topic 470
-SubTopic 10
-Name Accounting Standards Codification
-Section S99
-Paragraph 1B
-Subparagraph (SX 210.13-02(a)(4)(iv))
-Publisher FASB
-URI https://asc.fasb.org//1943274/2147480097/470-10-S99-1B
Reference 14: http://www.xbrl.org/2003/role/disclosureRef
-Topic 470
-SubTopic 10
-Name Accounting Standards Codification
-Section S99
-Paragraph 1B
-Subparagraph (SX 210.13-02(a)(5))
-Publisher FASB
-URI https://asc.fasb.org//1943274/2147480097/470-10-S99-1B
Reference 15: http://www.xbrl.org/2003/role/disclosureRef
-Topic 280
-SubTopic 10
-Name Accounting Standards Codification
-Section 50
-Paragraph 30
-Subparagraph (b)
-Publisher FASB
-URI https://asc.fasb.org//1943274/2147482810/280-10-50-30
Reference 16: http://www.xbrl.org/2003/role/disclosureRef
-Topic 280
-SubTopic 10
-Name Accounting Standards Codification
-Section 50
-Paragraph 32
-Subparagraph (f)
-Publisher FASB
-URI https://asc.fasb.org//1943274/2147482810/280-10-50-32
Reference 17: http://www.xbrl.org/2003/role/exampleRef
-Topic 280
-SubTopic 10
-Name Accounting Standards Codification
-Section 50
-Paragraph 31
-Publisher FASB
-URI https://asc.fasb.org//1943274/2147482810/280-10-50-31
Reference 18: http://www.xbrl.org/2003/role/disclosureRef
-Topic 280
-SubTopic 10
-Name Accounting Standards Codification
-Section 50
-Paragraph 32
-Subparagraph (c)
-Publisher FASB
-URI https://asc.fasb.org//1943274/2147482810/280-10-50-32
Reference 19: http://fasb.org/us-gaap/role/ref/legacyRef
-Topic 220
-SubTopic 10
-Name Accounting Standards Codification
-Section S99
-Paragraph 2
-Subparagraph (SX 210.5-03.1,2)
-Publisher FASB
-URI https://asc.fasb.org//1943274/2147483621/220-10-S99-2
| Name: |
us-gaap_GrossProfit |
| Namespace Prefix: |
us-gaap_ |
| Data Type: |
xbrli:monetaryItemType |
| Balance Type: |
credit |
| Period Type: |
duration |
|
| X |
- DefinitionAmount of income (loss) for proportionate share of equity method investee's income (loss). Reference 1: http://fasb.org/us-gaap/role/ref/legacyRef
-Name Accounting Standards Codification
-Section 45
-Paragraph 28
-Subparagraph (b)
-SubTopic 10
-Topic 230
-Publisher FASB
-URI https://asc.fasb.org//1943274/2147482740/230-10-45-28
Reference 2: http://www.xbrl.org/2003/role/disclosureRef
-Topic 944
-SubTopic 220
-Name Accounting Standards Codification
-Section S99
-Paragraph 1
-Subparagraph (SX 210.7-04(10))
-Publisher FASB
-URI https://asc.fasb.org//1943274/2147483586/944-220-S99-1
Reference 3: http://www.xbrl.org/2003/role/disclosureRef
-Topic 323
-SubTopic 10
-Name Accounting Standards Codification
-Section 45
-Paragraph 1
-Publisher FASB
-URI https://asc.fasb.org//1943274/2147481664/323-10-45-1
Reference 4: http://www.xbrl.org/2003/role/disclosureRef
-Topic 280
-SubTopic 10
-Name Accounting Standards Codification
-Section 50
-Paragraph 22
-Subparagraph (g)
-Publisher FASB
-URI https://asc.fasb.org//1943274/2147482810/280-10-50-22
Reference 5: http://fasb.org/us-gaap/role/ref/legacyRef
-Topic 220
-SubTopic 10
-Name Accounting Standards Codification
-Section S99
-Paragraph 2
-Subparagraph (SX 210.5-03(12))
-Publisher FASB
-URI https://asc.fasb.org//1943274/2147483621/220-10-S99-2
Reference 6: http://fasb.org/us-gaap/role/ref/legacyRef
-Topic 942
-SubTopic 220
-Name Accounting Standards Codification
-Section S99
-Paragraph 1
-Subparagraph (SX 210.9-04(13)(f))
-Publisher FASB
-URI https://asc.fasb.org//1943274/2147483589/942-220-S99-1
| Name: |
us-gaap_IncomeLossFromEquityMethodInvestments |
| Namespace Prefix: |
us-gaap_ |
| Data Type: |
xbrli:monetaryItemType |
| Balance Type: |
credit |
| Period Type: |
duration |
|
| X |
- References
+ Details
| Name: |
us-gaap_IncomeStatementAbstract |
| Namespace Prefix: |
us-gaap_ |
| Data Type: |
xbrli:stringItemType |
| Balance Type: |
na |
| Period Type: |
duration |
|
| X |
- DefinitionRepresents the portion of interest incurred in the period on debt arrangements that was charged against earnings, excluding amortization of debt discount (premium) and financing costs. Reference 1: http://www.xbrl.org/2003/role/exampleRef
-Topic 470
-SubTopic 20
-Name Accounting Standards Codification
-Section 55
-Paragraph 69E
-Publisher FASB
-URI https://asc.fasb.org//1943274/2147481568/470-20-55-69E
Reference 2: http://www.xbrl.org/2003/role/exampleRef
-Topic 470
-SubTopic 20
-Name Accounting Standards Codification
-Section 55
-Paragraph 69F
-Publisher FASB
-URI https://asc.fasb.org//1943274/2147481568/470-20-55-69F
Reference 3: http://www.xbrl.org/2003/role/disclosureRef
-Topic 470
-SubTopic 20
-Name Accounting Standards Codification
-Section 50
-Paragraph 1F
-Subparagraph (b)(1)
-Publisher FASB
-URI https://asc.fasb.org//1943274/2147481139/470-20-50-1F
Reference 4: http://fasb.org/us-gaap/role/ref/legacyRef
-Topic 220
-SubTopic 10
-Name Accounting Standards Codification
-Section S99
-Paragraph 2
-Subparagraph 8
-Publisher FASB
-URI https://asc.fasb.org//1943274/2147483621/220-10-S99-2
| Name: |
us-gaap_InterestExpenseDebtExcludingAmortization |
| Namespace Prefix: |
us-gaap_ |
| Data Type: |
xbrli:monetaryItemType |
| Balance Type: |
debit |
| Period Type: |
duration |
|
| X |
- DefinitionThe portion of profit or loss for the period, net of income taxes, which is attributable to the parent. Reference 1: http://www.xbrl.org/2003/role/disclosureRef
-Topic 235
-SubTopic 10
-Name Accounting Standards Codification
-Section S99
-Paragraph 1
-Subparagraph (SX 210.4-08(g)(1)(ii))
-Publisher FASB
-URI https://asc.fasb.org//1943274/2147480678/235-10-S99-1
Reference 2: http://www.xbrl.org/2003/role/disclosureRef
-Topic 323
-SubTopic 10
-Name Accounting Standards Codification
-Section 50
-Paragraph 3
-Subparagraph (c)
-Publisher FASB
-URI https://asc.fasb.org//1943274/2147481687/323-10-50-3
Reference 3: http://www.xbrl.org/2003/role/disclosureRef
-Topic 825
-SubTopic 10
-Name Accounting Standards Codification
-Section 50
-Paragraph 28
-Subparagraph (f)
-Publisher FASB
-URI https://asc.fasb.org//1943274/2147482907/825-10-50-28
Reference 4: http://www.xbrl.org/2003/role/disclosureRef
-Topic 220
-SubTopic 10
-Name Accounting Standards Codification
-Section 50
-Paragraph 6
-Publisher FASB
-URI https://asc.fasb.org//1943274/2147482765/220-10-50-6
Reference 5: http://www.xbrl.org/2003/role/disclosureRef
-Topic 250
-SubTopic 10
-Name Accounting Standards Codification
-Section 50
-Paragraph 3
-Publisher FASB
-URI https://asc.fasb.org//1943274/2147483443/250-10-50-3
Reference 6: http://www.xbrl.org/2003/role/disclosureRef
-Topic 250
-SubTopic 10
-Name Accounting Standards Codification
-Section 50
-Paragraph 1
-Subparagraph (b)(2)
-Publisher FASB
-URI https://asc.fasb.org//1943274/2147483443/250-10-50-1
Reference 7: http://www.xbrl.org/2003/role/disclosureRef
-Topic 815
-SubTopic 40
-Name Accounting Standards Codification
-Section 65
-Paragraph 1
-Subparagraph (f)
-Publisher FASB
-URI https://asc.fasb.org//1943274/2147480175/815-40-65-1
Reference 8: http://www.xbrl.org/2003/role/disclosureRef
-Topic 250
-SubTopic 10
-Name Accounting Standards Codification
-Section 50
-Paragraph 8
-Publisher FASB
-URI https://asc.fasb.org//1943274/2147483443/250-10-50-8
Reference 9: http://www.xbrl.org/2003/role/disclosureRef
-Topic 250
-SubTopic 10
-Name Accounting Standards Codification
-Section 50
-Paragraph 9
-Publisher FASB
-URI https://asc.fasb.org//1943274/2147483443/250-10-50-9
Reference 10: http://www.xbrl.org/2003/role/disclosureRef
-Topic 250
-SubTopic 10
-Name Accounting Standards Codification
-Section 50
-Paragraph 11
-Subparagraph (a)
-Publisher FASB
-URI https://asc.fasb.org//1943274/2147483443/250-10-50-11
Reference 11: http://www.xbrl.org/2003/role/disclosureRef
-Topic 250
-SubTopic 10
-Name Accounting Standards Codification
-Section 50
-Paragraph 11
-Subparagraph (b)
-Publisher FASB
-URI https://asc.fasb.org//1943274/2147483443/250-10-50-11
Reference 12: http://www.xbrl.org/2003/role/disclosureRef
-Topic 250
-SubTopic 10
-Name Accounting Standards Codification
-Section 50
-Paragraph 4
-Publisher FASB
-URI https://asc.fasb.org//1943274/2147483443/250-10-50-4
Reference 13: http://www.xbrl.org/2003/role/exampleRef
-Topic 946
-SubTopic 830
-Name Accounting Standards Codification
-Section 55
-Paragraph 10
-Publisher FASB
-URI https://asc.fasb.org//1943274/2147480167/946-830-55-10
Reference 14: http://www.xbrl.org/2003/role/disclosureRef
-Topic 946
-SubTopic 220
-Name Accounting Standards Codification
-Section 45
-Paragraph 7
-Publisher FASB
-URI https://asc.fasb.org//1943274/2147483581/946-220-45-7
Reference 15: http://www.xbrl.org/2003/role/disclosureRef
-Topic 944
-SubTopic 220
-Name Accounting Standards Codification
-Section S99
-Paragraph 1
-Subparagraph (SX 210.7-04(18))
-Publisher FASB
-URI https://asc.fasb.org//1943274/2147483586/944-220-S99-1
Reference 16: http://www.xbrl.org/2003/role/disclosureRef
-Topic 280
-SubTopic 10
-Name Accounting Standards Codification
-Section 50
-Paragraph 22
-Publisher FASB
-URI https://asc.fasb.org//1943274/2147482810/280-10-50-22
Reference 17: http://www.xbrl.org/2003/role/disclosureRef
-Topic 946
-SubTopic 220
-Name Accounting Standards Codification
-Section S99
-Paragraph 1
-Subparagraph (SX 210.6-07(9))
-Publisher FASB
-URI https://asc.fasb.org//1943274/2147483575/946-220-S99-1
Reference 18: http://www.xbrl.org/2003/role/disclosureRef
-Topic 946
-SubTopic 220
-Name Accounting Standards Codification
-Section S99
-Paragraph 3
-Subparagraph (SX 210.6-09(1)(d))
-Publisher FASB
-URI https://asc.fasb.org//1943274/2147483575/946-220-S99-3
Reference 19: http://www.xbrl.org/2003/role/disclosureRef
-Topic 470
-SubTopic 10
-Name Accounting Standards Codification
-Section S99
-Paragraph 1A
-Subparagraph (SX 210.13-01(a)(4)(i))
-Publisher FASB
-URI https://asc.fasb.org//1943274/2147480097/470-10-S99-1A
Reference 20: http://www.xbrl.org/2009/role/commonPracticeRef
-Topic 470
-SubTopic 10
-Name Accounting Standards Codification
-Section S99
-Paragraph 1A
-Subparagraph (SX 210.13-01(a)(4)(ii))
-Publisher FASB
-URI https://asc.fasb.org//1943274/2147480097/470-10-S99-1A
Reference 21: http://www.xbrl.org/2003/role/disclosureRef
-Topic 470
-SubTopic 10
-Name Accounting Standards Codification
-Section S99
-Paragraph 1A
-Subparagraph (SX 210.13-01(a)(4)(iii)(A))
-Publisher FASB
-URI https://asc.fasb.org//1943274/2147480097/470-10-S99-1A
Reference 22: http://www.xbrl.org/2003/role/disclosureRef
-Topic 470
-SubTopic 10
-Name Accounting Standards Codification
-Section S99
-Paragraph 1A
-Subparagraph (SX 210.13-01(a)(4)(iv))
-Publisher FASB
-URI https://asc.fasb.org//1943274/2147480097/470-10-S99-1A
Reference 23: http://www.xbrl.org/2003/role/disclosureRef
-Topic 470
-SubTopic 10
-Name Accounting Standards Codification
-Section S99
-Paragraph 1A
-Subparagraph (SX 210.13-01(a)(5))
-Publisher FASB
-URI https://asc.fasb.org//1943274/2147480097/470-10-S99-1A
Reference 24: http://www.xbrl.org/2003/role/disclosureRef
-Topic 470
-SubTopic 10
-Name Accounting Standards Codification
-Section S99
-Paragraph 1B
-Subparagraph (SX 210.13-02(a)(4)(i))
-Publisher FASB
-URI https://asc.fasb.org//1943274/2147480097/470-10-S99-1B
Reference 25: http://www.xbrl.org/2003/role/disclosureRef
-Topic 470
-SubTopic 10
-Name Accounting Standards Codification
-Section S99
-Paragraph 1B
-Subparagraph (SX 210.13-02(a)(4)(iii)(A))
-Publisher FASB
-URI https://asc.fasb.org//1943274/2147480097/470-10-S99-1B
Reference 26: http://www.xbrl.org/2003/role/disclosureRef
-Topic 470
-SubTopic 10
-Name Accounting Standards Codification
-Section S99
-Paragraph 1B
-Subparagraph (SX 210.13-02(a)(4)(iii)(B))
-Publisher FASB
-URI https://asc.fasb.org//1943274/2147480097/470-10-S99-1B
Reference 27: http://www.xbrl.org/2003/role/disclosureRef
-Topic 470
-SubTopic 10
-Name Accounting Standards Codification
-Section S99
-Paragraph 1B
-Subparagraph (SX 210.13-02(a)(4)(iv))
-Publisher FASB
-URI https://asc.fasb.org//1943274/2147480097/470-10-S99-1B
Reference 28: http://www.xbrl.org/2003/role/disclosureRef
-Topic 470
-SubTopic 10
-Name Accounting Standards Codification
-Section S99
-Paragraph 1B
-Subparagraph (SX 210.13-02(a)(5))
-Publisher FASB
-URI https://asc.fasb.org//1943274/2147480097/470-10-S99-1B
Reference 29: http://www.xbrl.org/2003/role/disclosureRef
-Topic 280
-SubTopic 10
-Name Accounting Standards Codification
-Section 50
-Paragraph 30
-Subparagraph (b)
-Publisher FASB
-URI https://asc.fasb.org//1943274/2147482810/280-10-50-30
Reference 30: http://www.xbrl.org/2003/role/disclosureRef
-Topic 280
-SubTopic 10
-Name Accounting Standards Codification
-Section 50
-Paragraph 32
-Subparagraph (f)
-Publisher FASB
-URI https://asc.fasb.org//1943274/2147482810/280-10-50-32
Reference 31: http://www.xbrl.org/2003/role/disclosureRef
-Topic 260
-SubTopic 10
-Name Accounting Standards Codification
-Section 45
-Paragraph 60B
-Subparagraph (a)
-Publisher FASB
-URI https://asc.fasb.org//1943274/2147482689/260-10-45-60B
Reference 32: http://www.xbrl.org/2003/role/exampleRef
-Topic 280
-SubTopic 10
-Name Accounting Standards Codification
-Section 50
-Paragraph 31
-Publisher FASB
-URI https://asc.fasb.org//1943274/2147482810/280-10-50-31
Reference 33: http://www.xbrl.org/2003/role/disclosureRef
-Topic 280
-SubTopic 10
-Name Accounting Standards Codification
-Section 50
-Paragraph 32
-Subparagraph (c)
-Publisher FASB
-URI https://asc.fasb.org//1943274/2147482810/280-10-50-32
Reference 34: http://www.xbrl.org/2003/role/disclosureRef
-Topic 205
-SubTopic 20
-Name Accounting Standards Codification
-Section 50
-Paragraph 7
-Publisher FASB
-URI https://asc.fasb.org//1943274/2147483499/205-20-50-7
Reference 35: http://fasb.org/us-gaap/role/ref/legacyRef
-Topic 230
-SubTopic 10
-Name Accounting Standards Codification
-Section 45
-Paragraph 28
-Publisher FASB
-URI https://asc.fasb.org//1943274/2147482740/230-10-45-28
Reference 36: http://www.xbrl.org/2003/role/disclosureRef
-Topic 220
-SubTopic 10
-Name Accounting Standards Codification
-Section 45
-Paragraph 1A
-Subparagraph (a)
-Publisher FASB
-URI https://asc.fasb.org//1943274/2147482790/220-10-45-1A
Reference 37: http://www.xbrl.org/2003/role/disclosureRef
-Topic 220
-SubTopic 10
-Name Accounting Standards Codification
-Section 45
-Paragraph 1B
-Subparagraph (a)
-Publisher FASB
-URI https://asc.fasb.org//1943274/2147482790/220-10-45-1B
Reference 38: http://fasb.org/us-gaap/role/ref/legacyRef
-Topic 220
-SubTopic 10
-Name Accounting Standards Codification
-Section S99
-Paragraph 2
-Subparagraph (SX 210.5-03(20))
-Publisher FASB
-URI https://asc.fasb.org//1943274/2147483621/220-10-S99-2
Reference 39: http://fasb.org/us-gaap/role/ref/legacyRef
-Topic 942
-SubTopic 220
-Name Accounting Standards Codification
-Section S99
-Paragraph 1
-Subparagraph (SX 210.9-04(22))
-Publisher FASB
-URI https://asc.fasb.org//1943274/2147483589/942-220-S99-1
| Name: |
us-gaap_NetIncomeLoss |
| Namespace Prefix: |
us-gaap_ |
| Data Type: |
xbrli:monetaryItemType |
| Balance Type: |
credit |
| Period Type: |
duration |
|
| X |
- DefinitionAmount, after deduction of tax, noncontrolling interests, dividends on preferred stock and participating securities; of income (loss) available to common shareholders. Reference 1: http://www.xbrl.org/2003/role/disclosureRef
-Topic 250
-SubTopic 10
-Name Accounting Standards Codification
-Section 50
-Paragraph 3
-Publisher FASB
-URI https://asc.fasb.org//1943274/2147483443/250-10-50-3
Reference 2: http://www.xbrl.org/2003/role/disclosureRef
-Topic 250
-SubTopic 10
-Name Accounting Standards Codification
-Section 50
-Paragraph 11
-Subparagraph (a)
-Publisher FASB
-URI https://asc.fasb.org//1943274/2147483443/250-10-50-11
Reference 3: http://www.xbrl.org/2003/role/disclosureRef
-Topic 250
-SubTopic 10
-Name Accounting Standards Codification
-Section 50
-Paragraph 11
-Subparagraph (b)
-Publisher FASB
-URI https://asc.fasb.org//1943274/2147483443/250-10-50-11
Reference 4: http://www.xbrl.org/2003/role/disclosureRef
-Topic 250
-SubTopic 10
-Name Accounting Standards Codification
-Section 50
-Paragraph 4
-Publisher FASB
-URI https://asc.fasb.org//1943274/2147483443/250-10-50-4
Reference 5: http://www.xbrl.org/2003/role/disclosureRef
-Topic 220
-SubTopic 10
-Name Accounting Standards Codification
-Section S99
-Paragraph 5
-Subparagraph (SAB Topic 6.B)
-Publisher FASB
-URI https://asc.fasb.org//1943274/2147483621/220-10-S99-5
Reference 6: http://www.xbrl.org/2003/role/disclosureRef
-Topic 280
-SubTopic 10
-Name Accounting Standards Codification
-Section 50
-Paragraph 22
-Publisher FASB
-URI https://asc.fasb.org//1943274/2147482810/280-10-50-22
Reference 7: http://www.xbrl.org/2003/role/disclosureRef
-Topic 260
-SubTopic 10
-Name Accounting Standards Codification
-Section 50
-Paragraph 1
-Subparagraph (a)
-Publisher FASB
-URI https://asc.fasb.org//1943274/2147482662/260-10-50-1
Reference 8: http://www.xbrl.org/2003/role/disclosureRef
-Topic 280
-SubTopic 10
-Name Accounting Standards Codification
-Section 50
-Paragraph 30
-Subparagraph (b)
-Publisher FASB
-URI https://asc.fasb.org//1943274/2147482810/280-10-50-30
Reference 9: http://www.xbrl.org/2003/role/disclosureRef
-Topic 280
-SubTopic 10
-Name Accounting Standards Codification
-Section 50
-Paragraph 32
-Subparagraph (f)
-Publisher FASB
-URI https://asc.fasb.org//1943274/2147482810/280-10-50-32
Reference 10: http://www.xbrl.org/2003/role/disclosureRef
-Topic 260
-SubTopic 10
-Name Accounting Standards Codification
-Section 45
-Paragraph 10
-Publisher FASB
-URI https://asc.fasb.org//1943274/2147482689/260-10-45-10
Reference 11: http://www.xbrl.org/2003/role/exampleRef
-Topic 280
-SubTopic 10
-Name Accounting Standards Codification
-Section 50
-Paragraph 31
-Publisher FASB
-URI https://asc.fasb.org//1943274/2147482810/280-10-50-31
Reference 12: http://www.xbrl.org/2003/role/disclosureRef
-Topic 280
-SubTopic 10
-Name Accounting Standards Codification
-Section 50
-Paragraph 32
-Subparagraph (c)
-Publisher FASB
-URI https://asc.fasb.org//1943274/2147482810/280-10-50-32
Reference 13: http://www.xbrl.org/2003/role/disclosureRef
-Topic 260
-SubTopic 10
-Name Accounting Standards Codification
-Section 45
-Paragraph 11
-Publisher FASB
-URI https://asc.fasb.org//1943274/2147482689/260-10-45-11
Reference 14: http://www.xbrl.org/2003/role/disclosureRef
-Topic 260
-SubTopic 10
-Name Accounting Standards Codification
-Section 45
-Paragraph 60B
-Subparagraph (c)
-Publisher FASB
-URI https://asc.fasb.org//1943274/2147482689/260-10-45-60B
| Name: |
us-gaap_NetIncomeLossAvailableToCommonStockholdersBasic |
| Namespace Prefix: |
us-gaap_ |
| Data Type: |
xbrli:monetaryItemType |
| Balance Type: |
credit |
| Period Type: |
duration |
|
| X |
- DefinitionThe aggregate amount of income or expense from ancillary business-related activities (that is to say, excluding major activities considered part of the normal operations of the business). Reference 1: http://fasb.org/us-gaap/role/ref/legacyRef
-Topic 220
-SubTopic 10
-Name Accounting Standards Codification
-Section S99
-Paragraph 2
-Subparagraph (SX 210.5-03.7)
-Publisher FASB
-URI https://asc.fasb.org//1943274/2147483621/220-10-S99-2
| Name: |
us-gaap_NonoperatingIncomeExpense |
| Namespace Prefix: |
us-gaap_ |
| Data Type: |
xbrli:monetaryItemType |
| Balance Type: |
credit |
| Period Type: |
duration |
|
| X |
- References
+ Details
| Name: |
us-gaap_NonoperatingIncomeExpenseAbstract |
| Namespace Prefix: |
us-gaap_ |
| Data Type: |
xbrli:stringItemType |
| Balance Type: |
na |
| Period Type: |
duration |
|
| X |
- DefinitionGenerally recurring costs associated with normal operations except for the portion of these expenses which can be clearly related to production and included in cost of sales or services. Includes selling, general and administrative expense.
| Name: |
us-gaap_OperatingExpenses |
| Namespace Prefix: |
us-gaap_ |
| Data Type: |
xbrli:monetaryItemType |
| Balance Type: |
debit |
| Period Type: |
duration |
|
| X |
- References
+ Details
| Name: |
us-gaap_OperatingExpensesAbstract |
| Namespace Prefix: |
us-gaap_ |
| Data Type: |
xbrli:stringItemType |
| Balance Type: |
na |
| Period Type: |
duration |
|
| X |
- DefinitionThe net result for the period of deducting operating expenses from operating revenues. Reference 1: http://www.xbrl.org/2003/role/disclosureRef
-Topic 280
-SubTopic 10
-Name Accounting Standards Codification
-Section 50
-Paragraph 22
-Publisher FASB
-URI https://asc.fasb.org//1943274/2147482810/280-10-50-22
Reference 2: http://www.xbrl.org/2003/role/disclosureRef
-Topic 280
-SubTopic 10
-Name Accounting Standards Codification
-Section 50
-Paragraph 30
-Subparagraph (b)
-Publisher FASB
-URI https://asc.fasb.org//1943274/2147482810/280-10-50-30
Reference 3: http://www.xbrl.org/2003/role/disclosureRef
-Topic 280
-SubTopic 10
-Name Accounting Standards Codification
-Section 50
-Paragraph 32
-Subparagraph (f)
-Publisher FASB
-URI https://asc.fasb.org//1943274/2147482810/280-10-50-32
Reference 4: http://www.xbrl.org/2003/role/exampleRef
-Topic 280
-SubTopic 10
-Name Accounting Standards Codification
-Section 50
-Paragraph 31
-Publisher FASB
-URI https://asc.fasb.org//1943274/2147482810/280-10-50-31
Reference 5: http://www.xbrl.org/2003/role/disclosureRef
-Topic 280
-SubTopic 10
-Name Accounting Standards Codification
-Section 50
-Paragraph 32
-Subparagraph (c)
-Publisher FASB
-URI https://asc.fasb.org//1943274/2147482810/280-10-50-32
| Name: |
us-gaap_OperatingIncomeLoss |
| Namespace Prefix: |
us-gaap_ |
| Data Type: |
xbrli:monetaryItemType |
| Balance Type: |
credit |
| Period Type: |
duration |
|
| X |
- DefinitionAmount of income related to nonoperating activities, classified as other. Reference 1: http://www.xbrl.org/2003/role/disclosureRef
-Topic 220
-SubTopic 10
-Name Accounting Standards Codification
-Section S99
-Paragraph 2
-Subparagraph (SX 210.5-03(7)(d))
-Publisher FASB
-URI https://asc.fasb.org//1943274/2147483621/220-10-S99-2
| Name: |
us-gaap_OtherNonoperatingIncome |
| Namespace Prefix: |
us-gaap_ |
| Data Type: |
xbrli:monetaryItemType |
| Balance Type: |
credit |
| Period Type: |
duration |
|
| X |
- DefinitionThe amount of preferred stock dividends that is an adjustment to net income apportioned to common stockholders.
| Name: |
us-gaap_PreferredStockDividendsIncomeStatementImpact |
| Namespace Prefix: |
us-gaap_ |
| Data Type: |
xbrli:monetaryItemType |
| Balance Type: |
debit |
| Period Type: |
duration |
|
| X |
- DefinitionThe aggregate costs incurred (1) in a planned search or critical investigation aimed at discovery of new knowledge with the hope that such knowledge will be useful in developing a new product or service, a new process or technique, or in bringing about a significant improvement to an existing product or process; or (2) to translate research findings or other knowledge into a plan or design for a new product or process or for a significant improvement to an existing product or process whether intended for sale or the entity's use, during the reporting period charged to research and development projects, including the costs of developing computer software up to the point in time of achieving technological feasibility, and costs allocated in accounting for a business combination to in-process projects deemed to have no alternative future use. Reference 1: http://www.xbrl.org/2003/role/disclosureRef
-Topic 730
-SubTopic 10
-Name Accounting Standards Codification
-Section 50
-Paragraph 1
-Publisher FASB
-URI https://asc.fasb.org//1943274/2147482916/730-10-50-1
Reference 2: http://www.xbrl.org/2009/role/commonPracticeRef
-Topic 912
-SubTopic 730
-Name Accounting Standards Codification
-Section 25
-Paragraph 1
-Publisher FASB
-URI https://asc.fasb.org//1943274/2147482517/912-730-25-1
Reference 3: http://fasb.org/us-gaap/role/ref/legacyRef
-Name Accounting Standards Codification
-Topic 985
-SubTopic 20
-Section 50
-Paragraph 1
-Publisher FASB
-URI https://asc.fasb.org//1943274/2147481283/985-20-50-1
| Name: |
us-gaap_ResearchAndDevelopmentExpense |
| Namespace Prefix: |
us-gaap_ |
| Data Type: |
xbrli:monetaryItemType |
| Balance Type: |
debit |
| Period Type: |
duration |
|
| X |
- DefinitionAmount, excluding tax collected from customer, of revenue from satisfaction of performance obligation by transferring promised good or service to customer. Tax collected from customer is tax assessed by governmental authority that is both imposed on and concurrent with specific revenue-producing transaction, including, but not limited to, sales, use, value added and excise. Reference 1: http://www.xbrl.org/2003/role/disclosureRef
-Topic 924
-SubTopic 10
-Name Accounting Standards Codification
-Section S99
-Paragraph 1
-Subparagraph (SAB Topic 11.L)
-Publisher FASB
-URI https://asc.fasb.org//1943274/2147479941/924-10-S99-1
Reference 2: http://www.xbrl.org/2003/role/disclosureRef
-Topic 606
-SubTopic 10
-Name Accounting Standards Codification
-Section 50
-Paragraph 5
-Publisher FASB
-URI https://asc.fasb.org//1943274/2147479806/606-10-50-5
Reference 3: http://www.xbrl.org/2003/role/disclosureRef
-Topic 280
-SubTopic 10
-Name Accounting Standards Codification
-Section 50
-Paragraph 30
-Subparagraph (a)
-Publisher FASB
-URI https://asc.fasb.org//1943274/2147482810/280-10-50-30
Reference 4: http://www.xbrl.org/2003/role/disclosureRef
-Topic 280
-SubTopic 10
-Name Accounting Standards Codification
-Section 50
-Paragraph 42
-Publisher FASB
-URI https://asc.fasb.org//1943274/2147482810/280-10-50-42
Reference 5: http://www.xbrl.org/2003/role/disclosureRef
-Topic 280
-SubTopic 10
-Name Accounting Standards Codification
-Section 50
-Paragraph 22
-Subparagraph (b)
-Publisher FASB
-URI https://asc.fasb.org//1943274/2147482810/280-10-50-22
Reference 6: http://www.xbrl.org/2003/role/disclosureRef
-Topic 280
-SubTopic 10
-Name Accounting Standards Codification
-Section 50
-Paragraph 32
-Subparagraph (b)
-Publisher FASB
-URI https://asc.fasb.org//1943274/2147482810/280-10-50-32
Reference 7: http://www.xbrl.org/2003/role/disclosureRef
-Topic 280
-SubTopic 10
-Name Accounting Standards Codification
-Section 50
-Paragraph 40
-Publisher FASB
-URI https://asc.fasb.org//1943274/2147482810/280-10-50-40
Reference 8: http://www.xbrl.org/2003/role/disclosureRef
-Topic 280
-SubTopic 10
-Name Accounting Standards Codification
-Section 50
-Paragraph 22
-Subparagraph (a)
-Publisher FASB
-URI https://asc.fasb.org//1943274/2147482810/280-10-50-22
Reference 9: http://www.xbrl.org/2003/role/disclosureRef
-Topic 280
-SubTopic 10
-Name Accounting Standards Codification
-Section 50
-Paragraph 32
-Subparagraph (a)
-Publisher FASB
-URI https://asc.fasb.org//1943274/2147482810/280-10-50-32
Reference 10: http://www.xbrl.org/2003/role/disclosureRef
-Topic 280
-SubTopic 10
-Name Accounting Standards Codification
-Section 50
-Paragraph 41
-Subparagraph (a)
-Publisher FASB
-URI https://asc.fasb.org//1943274/2147482810/280-10-50-41
Reference 11: http://www.xbrl.org/2003/role/disclosureRef
-Topic 606
-SubTopic 10
-Name Accounting Standards Codification
-Section 50
-Paragraph 4
-Subparagraph (a)
-Publisher FASB
-URI https://asc.fasb.org//1943274/2147479806/606-10-50-4
| Name: |
us-gaap_RevenueFromContractWithCustomerExcludingAssessedTax |
| Namespace Prefix: |
us-gaap_ |
| Data Type: |
xbrli:monetaryItemType |
| Balance Type: |
credit |
| Period Type: |
duration |
|
| X |
- DefinitionThe average number of shares or units issued and outstanding that are used in calculating diluted EPS or earnings per unit (EPU), determined based on the timing of issuance of shares or units in the period. Reference 1: http://www.xbrl.org/2003/role/disclosureRef
-Topic 260
-SubTopic 10
-Name Accounting Standards Codification
-Section 50
-Paragraph 1
-Subparagraph (a)
-Publisher FASB
-URI https://asc.fasb.org//1943274/2147482662/260-10-50-1
Reference 2: http://www.xbrl.org/2003/role/disclosureRef
-Topic 260
-SubTopic 10
-Name Accounting Standards Codification
-Section 45
-Paragraph 16
-Publisher FASB
-URI https://asc.fasb.org//1943274/2147482689/260-10-45-16
| Name: |
us-gaap_WeightedAverageNumberOfDilutedSharesOutstanding |
| Namespace Prefix: |
us-gaap_ |
| Data Type: |
xbrli:sharesItemType |
| Balance Type: |
na |
| Period Type: |
duration |
|
| X |
- References
+ Details
| Name: |
us-gaap_WeightedAverageNumberOfSharesOutstandingAbstract |
| Namespace Prefix: |
us-gaap_ |
| Data Type: |
xbrli:stringItemType |
| Balance Type: |
na |
| Period Type: |
duration |
|
| X |
- DefinitionNumber of [basic] shares or units, after adjustment for contingently issuable shares or units and other shares or units not deemed outstanding, determined by relating the portion of time within a reporting period that common shares or units have been outstanding to the total time in that period. Reference 1: http://www.xbrl.org/2003/role/disclosureRef
-Topic 260
-SubTopic 10
-Name Accounting Standards Codification
-Section 50
-Paragraph 1
-Subparagraph (a)
-Publisher FASB
-URI https://asc.fasb.org//1943274/2147482662/260-10-50-1
Reference 2: http://www.xbrl.org/2003/role/disclosureRef
-Topic 260
-SubTopic 10
-Name Accounting Standards Codification
-Section 45
-Paragraph 10
-Publisher FASB
-URI https://asc.fasb.org//1943274/2147482689/260-10-45-10
| Name: |
us-gaap_WeightedAverageNumberOfSharesOutstandingBasic |
| Namespace Prefix: |
us-gaap_ |
| Data Type: |
xbrli:sharesItemType |
| Balance Type: |
na |
| Period Type: |
duration |
|
v3.23.2
Condensed Consolidated Statements of Changes in Stockholders' Equity (Unaudited) - USD ($)
|
Preferred Stock [Member]
Series A Preferred Stock [Member]
|
Preferred Stock [Member]
Series B Preferred Stock [Member]
|
Common Stock [Member] |
Treasury Stock, Common [Member] |
Additional Paid-in Capital [Member] |
Retained Earnings [Member] |
Total |
| Beginning balance, value at Jan. 31, 2022 |
|
|
$ 359
|
$ (149,500)
|
$ 20,587,789
|
$ (12,328,830)
|
$ 8,109,818
|
| Beginning balance, shares at Jan. 31, 2022 |
|
|
35,758,792
|
(230,000)
|
|
|
|
| Net income (loss) |
|
|
|
|
|
(639,549)
|
(639,549)
|
| Stock issued for the exercise of options |
|
|
|
|
26,250
|
|
26,250
|
| Stock issued for the exercise of options, shares |
|
|
57,093
|
|
|
|
|
| Stock options issued for services |
|
|
|
|
12,333
|
|
12,333
|
| Stock issued for the acquisition of equity investment in Chef Inspirational |
|
|
$ 5
|
|
699,995
|
|
700,000
|
| Stock issued for the acquisition of equity investment in Chef Inspirational, shares |
|
|
501,972
|
|
|
|
|
| Ending balance, value at Jul. 31, 2022 |
|
|
$ 364
|
$ (149,500)
|
21,326,367
|
(12,968,379)
|
8,208,852
|
| Ending balance, shares at Jul. 31, 2022 |
|
|
36,317,857
|
(230,000)
|
|
|
|
| Beginning balance, value at Apr. 30, 2022 |
|
|
$ 359
|
$ (149,500)
|
20,587,789
|
(12,225,133)
|
8,213,515
|
| Beginning balance, shares at Apr. 30, 2022 |
|
|
35,774,468
|
(230,000)
|
|
|
|
| Net income (loss) |
|
|
|
|
|
(743,246)
|
(743,246)
|
| Stock issued for the exercise of options |
|
|
|
|
26,250
|
|
26,250
|
| Stock issued for the exercise of options, shares |
|
|
41,417
|
|
|
|
|
| Stock options issued for services |
|
|
|
|
12,333
|
|
12,333
|
| Stock issued for the acquisition of equity investment in Chef Inspirational |
|
|
$ 5
|
|
699,995
|
|
700,000
|
| Stock issued for the acquisition of equity investment in Chef Inspirational, shares |
|
|
501,972
|
|
|
|
|
| Ending balance, value at Jul. 31, 2022 |
|
|
$ 364
|
$ (149,500)
|
21,326,367
|
(12,968,379)
|
8,208,852
|
| Ending balance, shares at Jul. 31, 2022 |
|
|
36,317,857
|
(230,000)
|
|
|
|
| Beginning balance, value at Jan. 31, 2023 |
|
|
$ 364
|
$ (149,500)
|
22,724,440
|
(10,060,226)
|
12,515,078
|
| Beginning balance, shares at Jan. 31, 2023 |
|
54,600
|
36,317,857
|
(230,000)
|
|
|
|
| Stock based compensation |
|
|
|
|
160,173
|
|
160,173
|
| Stock based compensation, shares |
|
|
19,960
|
|
|
|
|
| Stock issued for the exercise of options and warrants |
|
|
$ 2
|
|
27,778
|
|
27,780
|
| Stock issued for the exercise of options and warrants, shares |
|
|
186,570
|
|
|
|
|
| Conversion of series B preferred stock to common stock |
|
|
$ 8
|
|
(8)
|
|
|
| Conversion of series B preferred stock to common stock, shares |
|
(54,600)
|
819,000
|
|
|
|
|
| Series B Preferred dividend |
|
|
|
|
|
(48,533)
|
(48,533)
|
| Net income (loss) |
|
|
|
|
|
3,144,837
|
$ 3,144,837
|
| Stock issued for the exercise of options, shares |
|
|
|
|
|
|
206,000
|
| Ending balance, value at Jul. 31, 2023 |
|
|
$ 374
|
$ (149,500)
|
22,912,383
|
(6,963,922)
|
$ 15,799,335
|
| Ending balance, shares at Jul. 31, 2023 |
|
|
37,343,387
|
(230,000)
|
|
|
|
| Beginning balance, value at Apr. 30, 2023 |
|
|
$ 366
|
$ (149,500)
|
22,799,322
|
(8,686,600)
|
13,963,588
|
| Beginning balance, shares at Apr. 30, 2023 |
|
54,600
|
36,484,777
|
(230,000)
|
|
|
|
| Stock based compensation |
|
|
|
|
104,789
|
|
104,789
|
| Stock based compensation, shares |
|
|
19,960
|
|
|
|
|
| Stock issued for the exercise of options and warrants |
|
|
|
|
8,280
|
|
8,280
|
| Stock issued for the exercise of options and warrants, shares |
|
|
19,650
|
|
|
|
|
| Conversion of series B preferred stock to common stock |
|
|
$ 8
|
|
(8)
|
|
|
| Conversion of series B preferred stock to common stock, shares |
|
(54,600)
|
819,000
|
|
|
|
|
| Series B Preferred dividend |
|
|
|
|
|
(21,233)
|
(21,233)
|
| Net income (loss) |
|
|
|
|
|
1,743,911
|
$ 1,743,911
|
| Stock issued for the exercise of options, shares |
|
|
|
|
|
|
6,000
|
| Ending balance, value at Jul. 31, 2023 |
|
|
$ 374
|
$ (149,500)
|
$ 22,912,383
|
$ (6,963,922)
|
$ 15,799,335
|
| Ending balance, shares at Jul. 31, 2023 |
|
|
37,343,387
|
(230,000)
|
|
|
|
| X |
- DefinitionThe portion of profit or loss for the period, net of income taxes, which is attributable to the parent. Reference 1: http://www.xbrl.org/2003/role/disclosureRef
-Topic 235
-SubTopic 10
-Name Accounting Standards Codification
-Section S99
-Paragraph 1
-Subparagraph (SX 210.4-08(g)(1)(ii))
-Publisher FASB
-URI https://asc.fasb.org//1943274/2147480678/235-10-S99-1
Reference 2: http://www.xbrl.org/2003/role/disclosureRef
-Topic 323
-SubTopic 10
-Name Accounting Standards Codification
-Section 50
-Paragraph 3
-Subparagraph (c)
-Publisher FASB
-URI https://asc.fasb.org//1943274/2147481687/323-10-50-3
Reference 3: http://www.xbrl.org/2003/role/disclosureRef
-Topic 825
-SubTopic 10
-Name Accounting Standards Codification
-Section 50
-Paragraph 28
-Subparagraph (f)
-Publisher FASB
-URI https://asc.fasb.org//1943274/2147482907/825-10-50-28
Reference 4: http://www.xbrl.org/2003/role/disclosureRef
-Topic 220
-SubTopic 10
-Name Accounting Standards Codification
-Section 50
-Paragraph 6
-Publisher FASB
-URI https://asc.fasb.org//1943274/2147482765/220-10-50-6
Reference 5: http://www.xbrl.org/2003/role/disclosureRef
-Topic 250
-SubTopic 10
-Name Accounting Standards Codification
-Section 50
-Paragraph 3
-Publisher FASB
-URI https://asc.fasb.org//1943274/2147483443/250-10-50-3
Reference 6: http://www.xbrl.org/2003/role/disclosureRef
-Topic 250
-SubTopic 10
-Name Accounting Standards Codification
-Section 50
-Paragraph 1
-Subparagraph (b)(2)
-Publisher FASB
-URI https://asc.fasb.org//1943274/2147483443/250-10-50-1
Reference 7: http://www.xbrl.org/2003/role/disclosureRef
-Topic 815
-SubTopic 40
-Name Accounting Standards Codification
-Section 65
-Paragraph 1
-Subparagraph (f)
-Publisher FASB
-URI https://asc.fasb.org//1943274/2147480175/815-40-65-1
Reference 8: http://www.xbrl.org/2003/role/disclosureRef
-Topic 250
-SubTopic 10
-Name Accounting Standards Codification
-Section 50
-Paragraph 8
-Publisher FASB
-URI https://asc.fasb.org//1943274/2147483443/250-10-50-8
Reference 9: http://www.xbrl.org/2003/role/disclosureRef
-Topic 250
-SubTopic 10
-Name Accounting Standards Codification
-Section 50
-Paragraph 9
-Publisher FASB
-URI https://asc.fasb.org//1943274/2147483443/250-10-50-9
Reference 10: http://www.xbrl.org/2003/role/disclosureRef
-Topic 250
-SubTopic 10
-Name Accounting Standards Codification
-Section 50
-Paragraph 11
-Subparagraph (a)
-Publisher FASB
-URI https://asc.fasb.org//1943274/2147483443/250-10-50-11
Reference 11: http://www.xbrl.org/2003/role/disclosureRef
-Topic 250
-SubTopic 10
-Name Accounting Standards Codification
-Section 50
-Paragraph 11
-Subparagraph (b)
-Publisher FASB
-URI https://asc.fasb.org//1943274/2147483443/250-10-50-11
Reference 12: http://www.xbrl.org/2003/role/disclosureRef
-Topic 250
-SubTopic 10
-Name Accounting Standards Codification
-Section 50
-Paragraph 4
-Publisher FASB
-URI https://asc.fasb.org//1943274/2147483443/250-10-50-4
Reference 13: http://www.xbrl.org/2003/role/exampleRef
-Topic 946
-SubTopic 830
-Name Accounting Standards Codification
-Section 55
-Paragraph 10
-Publisher FASB
-URI https://asc.fasb.org//1943274/2147480167/946-830-55-10
Reference 14: http://www.xbrl.org/2003/role/disclosureRef
-Topic 946
-SubTopic 220
-Name Accounting Standards Codification
-Section 45
-Paragraph 7
-Publisher FASB
-URI https://asc.fasb.org//1943274/2147483581/946-220-45-7
Reference 15: http://www.xbrl.org/2003/role/disclosureRef
-Topic 944
-SubTopic 220
-Name Accounting Standards Codification
-Section S99
-Paragraph 1
-Subparagraph (SX 210.7-04(18))
-Publisher FASB
-URI https://asc.fasb.org//1943274/2147483586/944-220-S99-1
Reference 16: http://www.xbrl.org/2003/role/disclosureRef
-Topic 280
-SubTopic 10
-Name Accounting Standards Codification
-Section 50
-Paragraph 22
-Publisher FASB
-URI https://asc.fasb.org//1943274/2147482810/280-10-50-22
Reference 17: http://www.xbrl.org/2003/role/disclosureRef
-Topic 946
-SubTopic 220
-Name Accounting Standards Codification
-Section S99
-Paragraph 1
-Subparagraph (SX 210.6-07(9))
-Publisher FASB
-URI https://asc.fasb.org//1943274/2147483575/946-220-S99-1
Reference 18: http://www.xbrl.org/2003/role/disclosureRef
-Topic 946
-SubTopic 220
-Name Accounting Standards Codification
-Section S99
-Paragraph 3
-Subparagraph (SX 210.6-09(1)(d))
-Publisher FASB
-URI https://asc.fasb.org//1943274/2147483575/946-220-S99-3
Reference 19: http://www.xbrl.org/2003/role/disclosureRef
-Topic 470
-SubTopic 10
-Name Accounting Standards Codification
-Section S99
-Paragraph 1A
-Subparagraph (SX 210.13-01(a)(4)(i))
-Publisher FASB
-URI https://asc.fasb.org//1943274/2147480097/470-10-S99-1A
Reference 20: http://www.xbrl.org/2009/role/commonPracticeRef
-Topic 470
-SubTopic 10
-Name Accounting Standards Codification
-Section S99
-Paragraph 1A
-Subparagraph (SX 210.13-01(a)(4)(ii))
-Publisher FASB
-URI https://asc.fasb.org//1943274/2147480097/470-10-S99-1A
Reference 21: http://www.xbrl.org/2003/role/disclosureRef
-Topic 470
-SubTopic 10
-Name Accounting Standards Codification
-Section S99
-Paragraph 1A
-Subparagraph (SX 210.13-01(a)(4)(iii)(A))
-Publisher FASB
-URI https://asc.fasb.org//1943274/2147480097/470-10-S99-1A
Reference 22: http://www.xbrl.org/2003/role/disclosureRef
-Topic 470
-SubTopic 10
-Name Accounting Standards Codification
-Section S99
-Paragraph 1A
-Subparagraph (SX 210.13-01(a)(4)(iv))
-Publisher FASB
-URI https://asc.fasb.org//1943274/2147480097/470-10-S99-1A
Reference 23: http://www.xbrl.org/2003/role/disclosureRef
-Topic 470
-SubTopic 10
-Name Accounting Standards Codification
-Section S99
-Paragraph 1A
-Subparagraph (SX 210.13-01(a)(5))
-Publisher FASB
-URI https://asc.fasb.org//1943274/2147480097/470-10-S99-1A
Reference 24: http://www.xbrl.org/2003/role/disclosureRef
-Topic 470
-SubTopic 10
-Name Accounting Standards Codification
-Section S99
-Paragraph 1B
-Subparagraph (SX 210.13-02(a)(4)(i))
-Publisher FASB
-URI https://asc.fasb.org//1943274/2147480097/470-10-S99-1B
Reference 25: http://www.xbrl.org/2003/role/disclosureRef
-Topic 470
-SubTopic 10
-Name Accounting Standards Codification
-Section S99
-Paragraph 1B
-Subparagraph (SX 210.13-02(a)(4)(iii)(A))
-Publisher FASB
-URI https://asc.fasb.org//1943274/2147480097/470-10-S99-1B
Reference 26: http://www.xbrl.org/2003/role/disclosureRef
-Topic 470
-SubTopic 10
-Name Accounting Standards Codification
-Section S99
-Paragraph 1B
-Subparagraph (SX 210.13-02(a)(4)(iii)(B))
-Publisher FASB
-URI https://asc.fasb.org//1943274/2147480097/470-10-S99-1B
Reference 27: http://www.xbrl.org/2003/role/disclosureRef
-Topic 470
-SubTopic 10
-Name Accounting Standards Codification
-Section S99
-Paragraph 1B
-Subparagraph (SX 210.13-02(a)(4)(iv))
-Publisher FASB
-URI https://asc.fasb.org//1943274/2147480097/470-10-S99-1B
Reference 28: http://www.xbrl.org/2003/role/disclosureRef
-Topic 470
-SubTopic 10
-Name Accounting Standards Codification
-Section S99
-Paragraph 1B
-Subparagraph (SX 210.13-02(a)(5))
-Publisher FASB
-URI https://asc.fasb.org//1943274/2147480097/470-10-S99-1B
Reference 29: http://www.xbrl.org/2003/role/disclosureRef
-Topic 280
-SubTopic 10
-Name Accounting Standards Codification
-Section 50
-Paragraph 30
-Subparagraph (b)
-Publisher FASB
-URI https://asc.fasb.org//1943274/2147482810/280-10-50-30
Reference 30: http://www.xbrl.org/2003/role/disclosureRef
-Topic 280
-SubTopic 10
-Name Accounting Standards Codification
-Section 50
-Paragraph 32
-Subparagraph (f)
-Publisher FASB
-URI https://asc.fasb.org//1943274/2147482810/280-10-50-32
Reference 31: http://www.xbrl.org/2003/role/disclosureRef
-Topic 260
-SubTopic 10
-Name Accounting Standards Codification
-Section 45
-Paragraph 60B
-Subparagraph (a)
-Publisher FASB
-URI https://asc.fasb.org//1943274/2147482689/260-10-45-60B
Reference 32: http://www.xbrl.org/2003/role/exampleRef
-Topic 280
-SubTopic 10
-Name Accounting Standards Codification
-Section 50
-Paragraph 31
-Publisher FASB
-URI https://asc.fasb.org//1943274/2147482810/280-10-50-31
Reference 33: http://www.xbrl.org/2003/role/disclosureRef
-Topic 280
-SubTopic 10
-Name Accounting Standards Codification
-Section 50
-Paragraph 32
-Subparagraph (c)
-Publisher FASB
-URI https://asc.fasb.org//1943274/2147482810/280-10-50-32
Reference 34: http://www.xbrl.org/2003/role/disclosureRef
-Topic 205
-SubTopic 20
-Name Accounting Standards Codification
-Section 50
-Paragraph 7
-Publisher FASB
-URI https://asc.fasb.org//1943274/2147483499/205-20-50-7
Reference 35: http://fasb.org/us-gaap/role/ref/legacyRef
-Topic 230
-SubTopic 10
-Name Accounting Standards Codification
-Section 45
-Paragraph 28
-Publisher FASB
-URI https://asc.fasb.org//1943274/2147482740/230-10-45-28
Reference 36: http://www.xbrl.org/2003/role/disclosureRef
-Topic 220
-SubTopic 10
-Name Accounting Standards Codification
-Section 45
-Paragraph 1A
-Subparagraph (a)
-Publisher FASB
-URI https://asc.fasb.org//1943274/2147482790/220-10-45-1A
Reference 37: http://www.xbrl.org/2003/role/disclosureRef
-Topic 220
-SubTopic 10
-Name Accounting Standards Codification
-Section 45
-Paragraph 1B
-Subparagraph (a)
-Publisher FASB
-URI https://asc.fasb.org//1943274/2147482790/220-10-45-1B
Reference 38: http://fasb.org/us-gaap/role/ref/legacyRef
-Topic 220
-SubTopic 10
-Name Accounting Standards Codification
-Section S99
-Paragraph 2
-Subparagraph (SX 210.5-03(20))
-Publisher FASB
-URI https://asc.fasb.org//1943274/2147483621/220-10-S99-2
Reference 39: http://fasb.org/us-gaap/role/ref/legacyRef
-Topic 942
-SubTopic 220
-Name Accounting Standards Codification
-Section S99
-Paragraph 1
-Subparagraph (SX 210.9-04(22))
-Publisher FASB
-URI https://asc.fasb.org//1943274/2147483589/942-220-S99-1
| Name: |
us-gaap_NetIncomeLoss |
| Namespace Prefix: |
us-gaap_ |
| Data Type: |
xbrli:monetaryItemType |
| Balance Type: |
credit |
| Period Type: |
duration |
|
| X |
- DefinitionNumber of shares issued which are neither cancelled nor held in the treasury.
| Name: |
us-gaap_SharesOutstanding |
| Namespace Prefix: |
us-gaap_ |
| Data Type: |
xbrli:sharesItemType |
| Balance Type: |
na |
| Period Type: |
instant |
|
| X |
- DefinitionNumber of shares of stock issued during the period pursuant to acquisitions. Reference 1: http://fasb.org/us-gaap/role/ref/legacyRef
-Topic 210
-SubTopic 10
-Name Accounting Standards Codification
-Section S99
-Paragraph 1
-Subparagraph (SX 210.5-02(28))
-Publisher FASB
-URI https://asc.fasb.org//1943274/2147480566/210-10-S99-1
Reference 2: http://fasb.org/us-gaap/role/ref/legacyRef
-Topic 505
-SubTopic 10
-Name Accounting Standards Codification
-Section S99
-Paragraph 1
-Subparagraph (SX 210.3-04)
-Publisher FASB
-URI https://asc.fasb.org//1943274/2147480008/505-10-S99-1
Reference 3: http://fasb.org/us-gaap/role/ref/legacyRef
-Topic 210
-SubTopic 10
-Name Accounting Standards Codification
-Section S99
-Paragraph 1
-Subparagraph (SX 210.5-02(29))
-Publisher FASB
-URI https://asc.fasb.org//1943274/2147480566/210-10-S99-1
| Name: |
us-gaap_StockIssuedDuringPeriodSharesAcquisitions |
| Namespace Prefix: |
us-gaap_ |
| Data Type: |
xbrli:sharesItemType |
| Balance Type: |
na |
| Period Type: |
duration |
|
| X |
- DefinitionNumber of shares issued during the period as a result of the conversion of convertible securities. Reference 1: http://fasb.org/us-gaap/role/ref/legacyRef
-Name Accounting Standards Codification
-Section 50
-Paragraph 2
-SubTopic 10
-Topic 505
-Publisher FASB
-URI https://asc.fasb.org//1943274/2147481112/505-10-50-2
Reference 2: http://www.xbrl.org/2003/role/disclosureRef
-Topic 470
-SubTopic 20
-Name Accounting Standards Codification
-Section 50
-Paragraph 1E
-Subparagraph (c)
-Publisher FASB
-URI https://asc.fasb.org//1943274/2147481139/470-20-50-1E
Reference 3: http://fasb.org/us-gaap/role/ref/legacyRef
-Topic 505
-SubTopic 10
-Name Accounting Standards Codification
-Section S99
-Paragraph 1
-Subparagraph (SX 210.3-04)
-Publisher FASB
-URI https://asc.fasb.org//1943274/2147480008/505-10-S99-1
Reference 4: http://fasb.org/us-gaap/role/ref/legacyRef
-Name Accounting Standards Codification
-Topic 505
-SubTopic 10
-Section 50
-Paragraph 3
-Publisher FASB
-URI https://asc.fasb.org//1943274/2147481112/505-10-50-3
Reference 5: http://fasb.org/us-gaap/role/ref/legacyRef
-Name Accounting Standards Codification
-Topic 210
-SubTopic 10
-Section S99
-Paragraph 1
-Subparagraph (SX 210.5-02.29-30)
-Publisher FASB
-URI https://asc.fasb.org//1943274/2147480566/210-10-S99-1
| Name: |
us-gaap_StockIssuedDuringPeriodSharesConversionOfConvertibleSecurities |
| Namespace Prefix: |
us-gaap_ |
| Data Type: |
xbrli:sharesItemType |
| Balance Type: |
na |
| Period Type: |
duration |
|
| X |
- DefinitionNumber of shares of stock issued attributable to transactions classified as other.
| Name: |
us-gaap_StockIssuedDuringPeriodSharesOther |
| Namespace Prefix: |
us-gaap_ |
| Data Type: |
xbrli:sharesItemType |
| Balance Type: |
na |
| Period Type: |
duration |
|
| X |
- DefinitionNumber, after forfeiture, of shares or units issued under share-based payment arrangement. Excludes shares or units issued under employee stock ownership plan (ESOP). Reference 1: http://fasb.org/us-gaap/role/ref/legacyRef
-Name Accounting Standards Codification
-Section 50
-Paragraph 2
-SubTopic 10
-Topic 505
-Publisher FASB
-URI https://asc.fasb.org//1943274/2147481112/505-10-50-2
Reference 2: http://fasb.org/us-gaap/role/ref/legacyRef
-Topic 210
-SubTopic 10
-Name Accounting Standards Codification
-Section S99
-Paragraph 1
-Subparagraph (SX 210.5-02(28))
-Publisher FASB
-URI https://asc.fasb.org//1943274/2147480566/210-10-S99-1
Reference 3: http://fasb.org/us-gaap/role/ref/legacyRef
-Topic 505
-SubTopic 10
-Name Accounting Standards Codification
-Section S99
-Paragraph 1
-Subparagraph (SX 210.3-04)
-Publisher FASB
-URI https://asc.fasb.org//1943274/2147480008/505-10-S99-1
Reference 4: http://fasb.org/us-gaap/role/ref/legacyRef
-Topic 210
-SubTopic 10
-Name Accounting Standards Codification
-Section S99
-Paragraph 1
-Subparagraph (SX 210.5-02(29))
-Publisher FASB
-URI https://asc.fasb.org//1943274/2147480566/210-10-S99-1
| Name: |
us-gaap_StockIssuedDuringPeriodSharesShareBasedCompensation |
| Namespace Prefix: |
us-gaap_ |
| Data Type: |
xbrli:sharesItemType |
| Balance Type: |
na |
| Period Type: |
duration |
|
| X |
- DefinitionNumber of share options (or share units) exercised during the current period. Reference 1: http://fasb.org/us-gaap/role/ref/legacyRef
-Name Accounting Standards Codification
-Section 50
-Paragraph 2
-SubTopic 10
-Topic 505
-Publisher FASB
-URI https://asc.fasb.org//1943274/2147481112/505-10-50-2
Reference 2: http://www.xbrl.org/2003/role/disclosureRef
-Topic 718
-SubTopic 10
-Name Accounting Standards Codification
-Section 50
-Paragraph 2
-Subparagraph (c)(1)(iv)(02)
-Publisher FASB
-URI https://asc.fasb.org//1943274/2147480429/718-10-50-2
Reference 3: http://fasb.org/us-gaap/role/ref/legacyRef
-Topic 210
-SubTopic 10
-Name Accounting Standards Codification
-Section S99
-Paragraph 1
-Subparagraph (SX 210.5-02(28))
-Publisher FASB
-URI https://asc.fasb.org//1943274/2147480566/210-10-S99-1
Reference 4: http://fasb.org/us-gaap/role/ref/legacyRef
-Topic 505
-SubTopic 10
-Name Accounting Standards Codification
-Section S99
-Paragraph 1
-Subparagraph (SX 210.3-04)
-Publisher FASB
-URI https://asc.fasb.org//1943274/2147480008/505-10-S99-1
Reference 5: http://fasb.org/us-gaap/role/ref/legacyRef
-Topic 210
-SubTopic 10
-Name Accounting Standards Codification
-Section S99
-Paragraph 1
-Subparagraph (SX 210.5-02(29))
-Publisher FASB
-URI https://asc.fasb.org//1943274/2147480566/210-10-S99-1
| Name: |
us-gaap_StockIssuedDuringPeriodSharesStockOptionsExercised |
| Namespace Prefix: |
us-gaap_ |
| Data Type: |
xbrli:sharesItemType |
| Balance Type: |
na |
| Period Type: |
duration |
|
| X |
- DefinitionValue of stock issued pursuant to acquisitions during the period. Reference 1: http://fasb.org/us-gaap/role/ref/legacyRef
-Name Accounting Standards Codification
-Section 50
-Paragraph 2
-SubTopic 10
-Topic 505
-Publisher FASB
-URI https://asc.fasb.org//1943274/2147481112/505-10-50-2
Reference 2: http://fasb.org/us-gaap/role/ref/legacyRef
-Topic 505
-SubTopic 10
-Name Accounting Standards Codification
-Section S99
-Paragraph 1
-Subparagraph (SX 210.3-04)
-Publisher FASB
-URI https://asc.fasb.org//1943274/2147480008/505-10-S99-1
Reference 3: http://fasb.org/us-gaap/role/ref/legacyRef
-Name Accounting Standards Codification
-Topic 210
-SubTopic 10
-Section S99
-Paragraph 1
-Subparagraph (SX 210.5-02.29-31)
-Publisher FASB
-URI https://asc.fasb.org//1943274/2147480566/210-10-S99-1
| Name: |
us-gaap_StockIssuedDuringPeriodValueAcquisitions |
| Namespace Prefix: |
us-gaap_ |
| Data Type: |
xbrli:monetaryItemType |
| Balance Type: |
credit |
| Period Type: |
duration |
|
| X |
- DefinitionThe gross value of stock issued during the period upon the conversion of convertible securities. Reference 1: http://fasb.org/us-gaap/role/ref/legacyRef
-Name Accounting Standards Codification
-Section 50
-Paragraph 2
-SubTopic 10
-Topic 505
-Publisher FASB
-URI https://asc.fasb.org//1943274/2147481112/505-10-50-2
Reference 2: http://fasb.org/us-gaap/role/ref/legacyRef
-Topic 505
-SubTopic 10
-Name Accounting Standards Codification
-Section S99
-Paragraph 1
-Subparagraph (SX 210.3-04)
-Publisher FASB
-URI https://asc.fasb.org//1943274/2147480008/505-10-S99-1
Reference 3: http://fasb.org/us-gaap/role/ref/legacyRef
-Name Accounting Standards Codification
-Topic 210
-SubTopic 10
-Section S99
-Paragraph 1
-Subparagraph (SX 210.5-02.29-31)
-Publisher FASB
-URI https://asc.fasb.org//1943274/2147480566/210-10-S99-1
| Name: |
us-gaap_StockIssuedDuringPeriodValueConversionOfConvertibleSecurities |
| Namespace Prefix: |
us-gaap_ |
| Data Type: |
xbrli:monetaryItemType |
| Balance Type: |
credit |
| Period Type: |
duration |
|
| X |
- DefinitionValue of stock issued in lieu of cash for services contributed to the entity. Value of the stock issued includes, but is not limited to, services contributed by vendors and founders.
| Name: |
us-gaap_StockIssuedDuringPeriodValueIssuedForServices |
| Namespace Prefix: |
us-gaap_ |
| Data Type: |
xbrli:monetaryItemType |
| Balance Type: |
credit |
| Period Type: |
duration |
|
| X |
- DefinitionValue of shares of stock issued attributable to transactions classified as other.
| Name: |
us-gaap_StockIssuedDuringPeriodValueOther |
| Namespace Prefix: |
us-gaap_ |
| Data Type: |
xbrli:monetaryItemType |
| Balance Type: |
credit |
| Period Type: |
duration |
|
| X |
- DefinitionValue, after forfeiture, of shares issued under share-based payment arrangement. Excludes employee stock ownership plan (ESOP). Reference 1: http://fasb.org/us-gaap/role/ref/legacyRef
-Topic 210
-SubTopic 10
-Name Accounting Standards Codification
-Section S99
-Paragraph 1
-Subparagraph (SX 210.5-02(28))
-Publisher FASB
-URI https://asc.fasb.org//1943274/2147480566/210-10-S99-1
Reference 2: http://fasb.org/us-gaap/role/ref/legacyRef
-Topic 505
-SubTopic 10
-Name Accounting Standards Codification
-Section S99
-Paragraph 1
-Subparagraph (SX 210.3-04)
-Publisher FASB
-URI https://asc.fasb.org//1943274/2147480008/505-10-S99-1
Reference 3: http://fasb.org/us-gaap/role/ref/legacyRef
-Topic 210
-SubTopic 10
-Name Accounting Standards Codification
-Section S99
-Paragraph 1
-Subparagraph (SX 210.5-02(29))
-Publisher FASB
-URI https://asc.fasb.org//1943274/2147480566/210-10-S99-1
Reference 4: http://fasb.org/us-gaap/role/ref/legacyRef
-Name Accounting Standards Codification
-Topic 718
-SubTopic 10
-Section 50
-Paragraph 2
-Subparagraph (d)(1)
-Publisher FASB
-URI https://asc.fasb.org//1943274/2147480429/718-10-50-2
| Name: |
us-gaap_StockIssuedDuringPeriodValueShareBasedCompensation |
| Namespace Prefix: |
us-gaap_ |
| Data Type: |
xbrli:monetaryItemType |
| Balance Type: |
credit |
| Period Type: |
duration |
|
| X |
- DefinitionValue of stock issued to shareholders as a dividend during the period. Reference 1: http://fasb.org/us-gaap/role/ref/legacyRef
-Name Accounting Standards Codification
-Section 50
-Paragraph 2
-SubTopic 10
-Topic 505
-Publisher FASB
-URI https://asc.fasb.org//1943274/2147481112/505-10-50-2
Reference 2: http://fasb.org/us-gaap/role/ref/legacyRef
-Topic 505
-SubTopic 10
-Name Accounting Standards Codification
-Section S99
-Paragraph 1
-Subparagraph (SX 210.3-04)
-Publisher FASB
-URI https://asc.fasb.org//1943274/2147480008/505-10-S99-1
Reference 3: http://fasb.org/us-gaap/role/ref/legacyRef
-Name Accounting Standards Codification
-Topic 210
-SubTopic 10
-Section S99
-Paragraph 1
-Subparagraph (SX 210.5-02.29-31)
-Publisher FASB
-URI https://asc.fasb.org//1943274/2147480566/210-10-S99-1
| Name: |
us-gaap_StockIssuedDuringPeriodValueStockDividend |
| Namespace Prefix: |
us-gaap_ |
| Data Type: |
xbrli:monetaryItemType |
| Balance Type: |
credit |
| Period Type: |
duration |
|
| X |
- DefinitionValue of stock issued as a result of the exercise of stock options. Reference 1: http://fasb.org/us-gaap/role/ref/legacyRef
-Name Accounting Standards Codification
-Section 50
-Paragraph 2
-SubTopic 10
-Topic 505
-Publisher FASB
-URI https://asc.fasb.org//1943274/2147481112/505-10-50-2
Reference 2: http://fasb.org/us-gaap/role/ref/legacyRef
-Topic 505
-SubTopic 10
-Name Accounting Standards Codification
-Section S99
-Paragraph 1
-Subparagraph (SX 210.3-04)
-Publisher FASB
-URI https://asc.fasb.org//1943274/2147480008/505-10-S99-1
Reference 3: http://fasb.org/us-gaap/role/ref/legacyRef
-Name Accounting Standards Codification
-Topic 210
-SubTopic 10
-Section S99
-Paragraph 1
-Subparagraph (SX 210.5-02.29-31)
-Publisher FASB
-URI https://asc.fasb.org//1943274/2147480566/210-10-S99-1
| Name: |
us-gaap_StockIssuedDuringPeriodValueStockOptionsExercised |
| Namespace Prefix: |
us-gaap_ |
| Data Type: |
xbrli:monetaryItemType |
| Balance Type: |
credit |
| Period Type: |
duration |
|
| X |
- DefinitionAmount of equity (deficit) attributable to parent. Excludes temporary equity and equity attributable to noncontrolling interest. Reference 1: http://www.xbrl.org/2003/role/exampleRef
-Topic 852
-SubTopic 10
-Name Accounting Standards Codification
-Section 55
-Paragraph 10
-Publisher FASB
-URI https://asc.fasb.org//1943274/2147481372/852-10-55-10
Reference 2: http://www.xbrl.org/2003/role/exampleRef
-Topic 946
-SubTopic 830
-Name Accounting Standards Codification
-Section 55
-Paragraph 12
-Publisher FASB
-URI https://asc.fasb.org//1943274/2147480167/946-830-55-12
Reference 3: http://www.xbrl.org/2003/role/disclosureRef
-Topic 946
-SubTopic 210
-Name Accounting Standards Codification
-Section S99
-Paragraph 1
-Subparagraph (SX 210.6-04(19))
-Publisher FASB
-URI https://asc.fasb.org//1943274/2147479617/946-210-S99-1
Reference 4: http://www.xbrl.org/2003/role/disclosureRef
-Topic 946
-SubTopic 210
-Name Accounting Standards Codification
-Section S99
-Paragraph 2
-Subparagraph (SX 210.6-05(4))
-Publisher FASB
-URI https://asc.fasb.org//1943274/2147479617/946-210-S99-2
Reference 5: http://www.xbrl.org/2009/role/commonPracticeRef
-Topic 946
-SubTopic 220
-Name Accounting Standards Codification
-Section S99
-Paragraph 3
-Subparagraph (SX 210.6-09(4)(b))
-Publisher FASB
-URI https://asc.fasb.org//1943274/2147483575/946-220-S99-3
Reference 6: http://www.xbrl.org/2003/role/disclosureRef
-Topic 946
-SubTopic 220
-Name Accounting Standards Codification
-Section S99
-Paragraph 3
-Subparagraph (SX 210.6-09(6))
-Publisher FASB
-URI https://asc.fasb.org//1943274/2147483575/946-220-S99-3
Reference 7: http://www.xbrl.org/2003/role/disclosureRef
-Topic 946
-SubTopic 220
-Name Accounting Standards Codification
-Section S99
-Paragraph 3
-Subparagraph (SX 210.6-09(7))
-Publisher FASB
-URI https://asc.fasb.org//1943274/2147483575/946-220-S99-3
Reference 8: http://www.xbrl.org/2009/role/commonPracticeRef
-Topic 235
-SubTopic 10
-Name Accounting Standards Codification
-Section S99
-Paragraph 1
-Subparagraph (SX 210.4-08(g)(1)(ii))
-Publisher FASB
-URI https://asc.fasb.org//1943274/2147480678/235-10-S99-1
Reference 9: http://www.xbrl.org/2009/role/commonPracticeRef
-Topic 323
-SubTopic 10
-Name Accounting Standards Codification
-Section 50
-Paragraph 3
-Subparagraph (c)
-Publisher FASB
-URI https://asc.fasb.org//1943274/2147481687/323-10-50-3
Reference 10: http://www.xbrl.org/2009/role/commonPracticeRef
-Topic 825
-SubTopic 10
-Name Accounting Standards Codification
-Section 50
-Paragraph 28
-Subparagraph (f)
-Publisher FASB
-URI https://asc.fasb.org//1943274/2147482907/825-10-50-28
Reference 11: http://fasb.org/us-gaap/role/ref/legacyRef
-Topic 210
-SubTopic 10
-Name Accounting Standards Codification
-Section S99
-Paragraph 1
-Subparagraph (SX 210.5-02(29))
-Publisher FASB
-URI https://asc.fasb.org//1943274/2147480566/210-10-S99-1
Reference 12: http://fasb.org/us-gaap/role/ref/legacyRef
-Topic 210
-SubTopic 10
-Name Accounting Standards Codification
-Section S99
-Paragraph 1
-Subparagraph (SX 210.5-02(31))
-Publisher FASB
-URI https://asc.fasb.org//1943274/2147480566/210-10-S99-1
Reference 13: http://fasb.org/us-gaap/role/ref/legacyRef
-Topic 210
-SubTopic 10
-Name Accounting Standards Codification
-Section S99
-Paragraph 1
-Subparagraph (SX 210.5-02(30))
-Publisher FASB
-URI https://asc.fasb.org//1943274/2147480566/210-10-S99-1
Reference 14: http://fasb.org/us-gaap/role/ref/legacyRef
-Topic 310
-SubTopic 10
-Name Accounting Standards Codification
-Section S99
-Paragraph 2
-Subparagraph (SAB Topic 4.E)
-Publisher FASB
-URI https://asc.fasb.org//1943274/2147480418/310-10-S99-2
| Name: |
us-gaap_StockholdersEquity |
| Namespace Prefix: |
us-gaap_ |
| Data Type: |
xbrli:monetaryItemType |
| Balance Type: |
credit |
| Period Type: |
instant |
|
v3.23.2
Condensed Consolidated Statements of Cash Flows (Unaudited) - USD ($)
|
6 Months Ended |
Jul. 31, 2023 |
Jul. 31, 2022 |
| CASH FLOWS FROM OPERATING ACTIVITIES: |
|
|
| Net income (loss) |
$ 3,144,837
|
$ (639,549)
|
| Adjustments to reconcile net income to net cash provided by operating activities: |
|
|
| Depreciation |
511,589
|
401,126
|
| Amortization of debt discount |
11,060
|
6,655
|
| Amortization of right of use assets |
112,241
|
182,862
|
| Amortization of intangibles |
303,949
|
230,156
|
| Stock-based compensation |
110,173
|
12,333
|
| Allowance for obsolete inventory |
93,238
|
|
| Change in deferred tax asset |
649,651
|
(188,080)
|
| Income from equity method investment |
(223,342)
|
(18,540)
|
| Paid in kind interest |
|
53,356
|
| Changes in operating assets and liabilities: |
|
|
| Allowance for doubtful accounts |
140,442
|
|
| Accounts receivable |
1,126,867
|
749,959
|
| Inventories |
234,130
|
(1,302,933)
|
| Prepaid expenses and other current assets |
346,709
|
(248,113)
|
| Security deposits |
(17,941)
|
|
| Accounts payable and accrued expenses |
(3,049,114)
|
1,170,280
|
| Operating lease liability |
(134,862)
|
(176,534)
|
| Net Cash Provided by Operating Activities |
3,359,627
|
232,978
|
| CASH FLOWS FROM INVESTING ACTIVITIES: |
|
|
| Cash paid for fixed assets |
(252,853)
|
(305,547)
|
| Cash paid for investment in Chef Inspirational Foods, LLC, net |
(645,641)
|
(500,000)
|
| Net Cash (Used in) Investing Activities |
(898,494)
|
(805,547)
|
| CASH FLOWS FROM FINANCING ACTIVITIES: |
|
|
| Proceeds in advance of preferred stock offering |
|
515,000
|
| Repayment of term loan |
(775,863)
|
(517,241)
|
| (Repayment) borrowings of line of credit, net |
(390,000)
|
1,725,000
|
| Repayment of finance lease obligations |
(92,724)
|
(130,626)
|
| Payment of Series B Preferred dividends |
(48,533)
|
|
| Proceeds from exercise of options |
27,780
|
26,250
|
| Net Cash (Used in) Provided by Financing Activities |
(1,279,340)
|
1,618,383
|
| Net Increase in Cash |
1,181,793
|
1,045,814
|
| Cash - Beginning of Period |
4,378,383
|
850,598
|
| Cash - End of Period |
5,560,176
|
1,896,412
|
| SUPPLEMENTARY CASH FLOW INFORMATION: |
|
|
| Income taxes |
112,500
|
|
| Interest |
313,488
|
182,873
|
| SUPPLEMENTARY DISCLOSURE OF NON-CASH INVESTING AND FINANCING ACTIVITIES: |
|
|
| Conversion of series b preferred stock to common stock |
8
|
|
| Finance lease asset additions |
903,288
|
34,268
|
| Related party debt incurred for purchase of Chef Inspirational Foods, LLC |
2,700,000
|
|
| Non-cash consideration paid in common stock for equity investment in Chef Inspirational |
|
700,000
|
| Settlement of liability in common stock |
$ 50,000
|
|
| X |
- DefinitionAllowance for obsolete inventory.
| Name: |
MAMA_AllowanceForObsoleteInventory |
| Namespace Prefix: |
MAMA_ |
| Data Type: |
xbrli:monetaryItemType |
| Balance Type: |
debit |
| Period Type: |
duration |
|
| X |
- DefinitionFinance Lease Asset Additions.
| Name: |
MAMA_FinanceLeaseAssetAdditions |
| Namespace Prefix: |
MAMA_ |
| Data Type: |
xbrli:monetaryItemType |
| Balance Type: |
credit |
| Period Type: |
duration |
|
| X |
- DefinitionIncrease decrease in allowance for doubtful accounts.
| Name: |
MAMA_IncreaseDecreaseInAllowanceForDoubtfulAccounts |
| Namespace Prefix: |
MAMA_ |
| Data Type: |
xbrli:monetaryItemType |
| Balance Type: |
credit |
| Period Type: |
duration |
|
| X |
- DefinitionNon-cash consideration paid in common stock for equity investment in Chef Inspirational.
| Name: |
MAMA_NoncashConsiderationPaidInCommonStockForEquityInvestment |
| Namespace Prefix: |
MAMA_ |
| Data Type: |
xbrli:monetaryItemType |
| Balance Type: |
credit |
| Period Type: |
duration |
|
| X |
- DefinitionSettlement of liability in common stock.
| Name: |
MAMA_SettlementOfLiabilityInCommonStock |
| Namespace Prefix: |
MAMA_ |
| Data Type: |
xbrli:monetaryItemType |
| Balance Type: |
credit |
| Period Type: |
duration |
|
| X |
- References
+ Details
| Name: |
us-gaap_AdjustmentsToReconcileNetIncomeLossToCashProvidedByUsedInOperatingActivitiesAbstract |
| Namespace Prefix: |
us-gaap_ |
| Data Type: |
xbrli:stringItemType |
| Balance Type: |
na |
| Period Type: |
duration |
|
| X |
- DefinitionAmount of noncash expense included in interest expense to amortize debt discount and premium associated with the related debt instruments. Excludes amortization of financing costs. Alternate captions include noncash interest expense. Reference 1: http://fasb.org/us-gaap/role/ref/legacyRef
-Name Accounting Standards Codification
-Section 45
-Paragraph 28
-Subparagraph (b)
-SubTopic 10
-Topic 230
-Publisher FASB
-URI https://asc.fasb.org//1943274/2147482740/230-10-45-28
Reference 2: http://www.xbrl.org/2003/role/disclosureRef
-Topic 470
-SubTopic 20
-Name Accounting Standards Codification
-Section 50
-Paragraph 1F
-Subparagraph (b)(2)
-Publisher FASB
-URI https://asc.fasb.org//1943274/2147481139/470-20-50-1F
Reference 3: http://fasb.org/us-gaap/role/ref/legacyRef
-Name Accounting Standards Codification
-Topic 835
-SubTopic 30
-Section 45
-Paragraph 1A
-Publisher FASB
-URI https://asc.fasb.org//1943274/2147482925/835-30-45-1A
Reference 4: http://fasb.org/us-gaap/role/ref/legacyRef
-Topic 220
-SubTopic 10
-Name Accounting Standards Codification
-Section S99
-Paragraph 2
-Subparagraph (SX 210.5-03.8)
-Publisher FASB
-URI https://asc.fasb.org//1943274/2147483621/220-10-S99-2
| Name: |
us-gaap_AmortizationOfDebtDiscountPremium |
| Namespace Prefix: |
us-gaap_ |
| Data Type: |
xbrli:monetaryItemType |
| Balance Type: |
debit |
| Period Type: |
duration |
|
| X |
- DefinitionThe aggregate expense charged against earnings to allocate the cost of intangible assets (nonphysical assets not used in production) in a systematic and rational manner to the periods expected to benefit from such assets. As a noncash expense, this element is added back to net income when calculating cash provided by or used in operations using the indirect method. Reference 1: http://fasb.org/us-gaap/role/ref/legacyRef
-Name Accounting Standards Codification
-Section 45
-Paragraph 28
-Subparagraph (b)
-SubTopic 10
-Topic 230
-Publisher FASB
-URI https://asc.fasb.org//1943274/2147482740/230-10-45-28
Reference 2: http://fasb.org/us-gaap/role/ref/legacyRef
-Name Accounting Standards Codification
-Topic 350
-SubTopic 30
-Section 45
-Paragraph 2
-Publisher FASB
-URI https://asc.fasb.org//1943274/2147482686/350-30-45-2
Reference 3: http://fasb.org/us-gaap/role/ref/legacyRef
-Name Accounting Standards Codification
-Topic 350
-SubTopic 30
-Section 50
-Paragraph 2
-Subparagraph (a)(2)
-Publisher FASB
-URI https://asc.fasb.org//1943274/2147482665/350-30-50-2
| Name: |
us-gaap_AmortizationOfIntangibleAssets |
| Namespace Prefix: |
us-gaap_ |
| Data Type: |
xbrli:monetaryItemType |
| Balance Type: |
debit |
| Period Type: |
duration |
|
| X |
- DefinitionAmount of cash and cash equivalents, and cash and cash equivalents restricted to withdrawal or usage; including, but not limited to, disposal group and discontinued operations. Cash includes, but is not limited to, currency on hand, demand deposits with banks or financial institutions, and other accounts with general characteristics of demand deposits. Cash equivalents include, but are not limited to, short-term, highly liquid investments that are both readily convertible to known amounts of cash and so near their maturity that they present insignificant risk of changes in value because of changes in interest rates. Reference 1: http://www.xbrl.org/2003/role/disclosureRef
-Topic 230
-SubTopic 10
-Name Accounting Standards Codification
-Section 50
-Paragraph 8
-Publisher FASB
-URI https://asc.fasb.org//1943274/2147482913/230-10-50-8
Reference 2: http://fasb.org/us-gaap/role/ref/legacyRef
-Topic 230
-SubTopic 10
-Name Accounting Standards Codification
-Section 45
-Paragraph 24
-Publisher FASB
-URI https://asc.fasb.org//1943274/2147482740/230-10-45-24
Reference 3: http://fasb.org/us-gaap/role/ref/legacyRef
-Name Accounting Standards Codification
-Topic 230
-SubTopic 10
-Section 45
-Paragraph 4
-Publisher FASB
-URI https://asc.fasb.org//1943274/2147482740/230-10-45-4
| Name: |
us-gaap_CashCashEquivalentsRestrictedCashAndRestrictedCashEquivalentsIncludingDisposalGroupAndDiscontinuedOperations |
| Namespace Prefix: |
us-gaap_ |
| Data Type: |
xbrli:monetaryItemType |
| Balance Type: |
debit |
| Period Type: |
instant |
|
| X |
- DefinitionAmount of increase (decrease) in cash, cash equivalents, and cash and cash equivalents restricted to withdrawal or usage; including effect from exchange rate change. Cash includes, but is not limited to, currency on hand, demand deposits with banks or financial institutions, and other accounts with general characteristics of demand deposits. Cash equivalents include, but are not limited to, short-term, highly liquid investments that are both readily convertible to known amounts of cash and so near their maturity that they present insignificant risk of changes in value because of changes in interest rates. Reference 1: http://fasb.org/us-gaap/role/ref/legacyRef
-Topic 230
-SubTopic 10
-Name Accounting Standards Codification
-Section 45
-Paragraph 24
-Publisher FASB
-URI https://asc.fasb.org//1943274/2147482740/230-10-45-24
Reference 2: http://fasb.org/us-gaap/role/ref/legacyRef
-Name Accounting Standards Codification
-Section 45
-Paragraph 1
-SubTopic 230
-Topic 830
-Publisher FASB
-URI https://asc.fasb.org//1943274/2147481877/830-230-45-1
| Name: |
us-gaap_CashCashEquivalentsRestrictedCashAndRestrictedCashEquivalentsPeriodIncreaseDecreaseIncludingExchangeRateEffect |
| Namespace Prefix: |
us-gaap_ |
| Data Type: |
xbrli:monetaryItemType |
| Balance Type: |
debit |
| Period Type: |
duration |
|
| X |
- References
+ Details
| Name: |
us-gaap_CashFlowNoncashInvestingAndFinancingActivitiesDisclosureAbstract |
| Namespace Prefix: |
us-gaap_ |
| Data Type: |
xbrli:stringItemType |
| Balance Type: |
na |
| Period Type: |
duration |
|
| X |
- DefinitionThe value of the stock converted in a noncash (or part noncash) transaction. Noncash is defined as transactions during a period that do not result in cash receipts or cash payments in the period. "Part noncash" refers to that portion of the transaction not resulting in cash receipts or cash payments in the period. Reference 1: http://fasb.org/us-gaap/role/ref/legacyRef
-Name Accounting Standards Codification
-Topic 230
-SubTopic 10
-Section 50
-Paragraph 4
-Publisher FASB
-URI https://asc.fasb.org//1943274/2147482913/230-10-50-4
Reference 2: http://fasb.org/us-gaap/role/ref/legacyRef
-Name Accounting Standards Codification
-Topic 230
-SubTopic 10
-Section 50
-Paragraph 3
-Publisher FASB
-URI https://asc.fasb.org//1943274/2147482913/230-10-50-3
Reference 3: http://fasb.org/us-gaap/role/ref/legacyRef
-Name Accounting Standards Codification
-Topic 230
-SubTopic 10
-Section 50
-Paragraph 5
-Publisher FASB
-URI https://asc.fasb.org//1943274/2147482913/230-10-50-5
| Name: |
us-gaap_ConversionOfStockAmountConverted1 |
| Namespace Prefix: |
us-gaap_ |
| Data Type: |
xbrli:monetaryItemType |
| Balance Type: |
debit |
| Period Type: |
duration |
|
| X |
- DefinitionThe amount of expense recognized in the current period that reflects the allocation of the cost of tangible assets over the assets' useful lives. Includes production and non-production related depreciation. Reference 1: http://fasb.org/us-gaap/role/ref/legacyRef
-Name Accounting Standards Codification
-Section 45
-Paragraph 28
-Subparagraph (b)
-SubTopic 10
-Topic 230
-Publisher FASB
-URI https://asc.fasb.org//1943274/2147482740/230-10-45-28
Reference 2: http://fasb.org/us-gaap/role/ref/legacyRef
-Name Accounting Standards Codification
-Topic 360
-SubTopic 10
-Section 50
-Paragraph 1
-Subparagraph (a)
-Publisher FASB
-URI https://asc.fasb.org//1943274/2147482099/360-10-50-1
| Name: |
us-gaap_Depreciation |
| Namespace Prefix: |
us-gaap_ |
| Data Type: |
xbrli:monetaryItemType |
| Balance Type: |
debit |
| Period Type: |
duration |
|
| X |
- DefinitionAmount of cash outflow for principal payment on finance lease. Reference 1: http://www.xbrl.org/2003/role/disclosureRef
-Topic 842
-SubTopic 20
-Name Accounting Standards Codification
-Section 50
-Paragraph 4
-Subparagraph (g)(1)
-Publisher FASB
-URI https://asc.fasb.org//1943274/2147478964/842-20-50-4
Reference 2: http://www.xbrl.org/2003/role/disclosureRef
-Topic 842
-SubTopic 20
-Name Accounting Standards Codification
-Section 45
-Paragraph 5
-Subparagraph (a)
-Publisher FASB
-URI https://asc.fasb.org//1943274/2147479041/842-20-45-5
| Name: |
us-gaap_FinanceLeasePrincipalPayments |
| Namespace Prefix: |
us-gaap_ |
| Data Type: |
xbrli:monetaryItemType |
| Balance Type: |
credit |
| Period Type: |
duration |
|
| X |
- DefinitionAmount of income (loss) for proportionate share of equity method investee's income (loss). Reference 1: http://fasb.org/us-gaap/role/ref/legacyRef
-Name Accounting Standards Codification
-Section 45
-Paragraph 28
-Subparagraph (b)
-SubTopic 10
-Topic 230
-Publisher FASB
-URI https://asc.fasb.org//1943274/2147482740/230-10-45-28
Reference 2: http://www.xbrl.org/2003/role/disclosureRef
-Topic 944
-SubTopic 220
-Name Accounting Standards Codification
-Section S99
-Paragraph 1
-Subparagraph (SX 210.7-04(10))
-Publisher FASB
-URI https://asc.fasb.org//1943274/2147483586/944-220-S99-1
Reference 3: http://www.xbrl.org/2003/role/disclosureRef
-Topic 323
-SubTopic 10
-Name Accounting Standards Codification
-Section 45
-Paragraph 1
-Publisher FASB
-URI https://asc.fasb.org//1943274/2147481664/323-10-45-1
Reference 4: http://www.xbrl.org/2003/role/disclosureRef
-Topic 280
-SubTopic 10
-Name Accounting Standards Codification
-Section 50
-Paragraph 22
-Subparagraph (g)
-Publisher FASB
-URI https://asc.fasb.org//1943274/2147482810/280-10-50-22
Reference 5: http://fasb.org/us-gaap/role/ref/legacyRef
-Topic 220
-SubTopic 10
-Name Accounting Standards Codification
-Section S99
-Paragraph 2
-Subparagraph (SX 210.5-03(12))
-Publisher FASB
-URI https://asc.fasb.org//1943274/2147483621/220-10-S99-2
Reference 6: http://fasb.org/us-gaap/role/ref/legacyRef
-Topic 942
-SubTopic 220
-Name Accounting Standards Codification
-Section S99
-Paragraph 1
-Subparagraph (SX 210.9-04(13)(f))
-Publisher FASB
-URI https://asc.fasb.org//1943274/2147483589/942-220-S99-1
| Name: |
us-gaap_IncomeLossFromEquityMethodInvestments |
| Namespace Prefix: |
us-gaap_ |
| Data Type: |
xbrli:monetaryItemType |
| Balance Type: |
credit |
| Period Type: |
duration |
|
| X |
- DefinitionThe increase (decrease) during the reporting period in the amounts payable to vendors for goods and services received and the amount of obligations and expenses incurred but not paid. Reference 1: http://fasb.org/us-gaap/role/ref/legacyRef
-Name Accounting Standards Codification
-Section 45
-Paragraph 28
-Subparagraph (a)
-SubTopic 10
-Topic 230
-Publisher FASB
-URI https://asc.fasb.org//1943274/2147482740/230-10-45-28
| Name: |
us-gaap_IncreaseDecreaseInAccountsPayableAndAccruedLiabilities |
| Namespace Prefix: |
us-gaap_ |
| Data Type: |
xbrli:monetaryItemType |
| Balance Type: |
debit |
| Period Type: |
duration |
|
| X |
- DefinitionThe increase (decrease) during the reporting period in amount due within one year (or one business cycle) from customers for the credit sale of goods and services. Reference 1: http://fasb.org/us-gaap/role/ref/legacyRef
-Name Accounting Standards Codification
-Section 45
-Paragraph 28
-Subparagraph (a)
-SubTopic 10
-Topic 230
-Publisher FASB
-URI https://asc.fasb.org//1943274/2147482740/230-10-45-28
| Name: |
us-gaap_IncreaseDecreaseInAccountsReceivable |
| Namespace Prefix: |
us-gaap_ |
| Data Type: |
xbrli:monetaryItemType |
| Balance Type: |
credit |
| Period Type: |
duration |
|
| X |
- DefinitionThe increase (decrease) during the reporting period in the aggregate value of all inventory held by the reporting entity, associated with underlying transactions that are classified as operating activities. Reference 1: http://fasb.org/us-gaap/role/ref/legacyRef
-Name Accounting Standards Codification
-Section 45
-Paragraph 28
-Subparagraph (a)
-SubTopic 10
-Topic 230
-Publisher FASB
-URI https://asc.fasb.org//1943274/2147482740/230-10-45-28
| Name: |
us-gaap_IncreaseDecreaseInInventories |
| Namespace Prefix: |
us-gaap_ |
| Data Type: |
xbrli:monetaryItemType |
| Balance Type: |
credit |
| Period Type: |
duration |
|
| X |
- References
+ Details
| Name: |
us-gaap_IncreaseDecreaseInOperatingCapitalAbstract |
| Namespace Prefix: |
us-gaap_ |
| Data Type: |
xbrli:stringItemType |
| Balance Type: |
na |
| Period Type: |
duration |
|
| X |
- DefinitionAmount of increase (decrease) in obligation for operating lease. Reference 1: http://www.xbrl.org/2009/role/commonPracticeRef
-Topic 230
-SubTopic 10
-Name Accounting Standards Codification
-Section 45
-Paragraph 28
-Subparagraph (a)
-Publisher FASB
-URI https://asc.fasb.org//1943274/2147482740/230-10-45-28
Reference 2: http://www.xbrl.org/2009/role/commonPracticeRef
-Name Accounting Standards Codification
-Section 50
-Paragraph 4
-Subparagraph (g)(1)
-SubTopic 20
-Topic 842
-Publisher FASB
-URI https://asc.fasb.org//1943274/2147478964/842-20-50-4
| Name: |
us-gaap_IncreaseDecreaseInOperatingLeaseLiability |
| Namespace Prefix: |
us-gaap_ |
| Data Type: |
xbrli:monetaryItemType |
| Balance Type: |
debit |
| Period Type: |
duration |
|
| X |
- DefinitionAmount of increase (decrease) in prepaid expenses, and assets classified as other. Reference 1: http://fasb.org/us-gaap/role/ref/legacyRef
-Name Accounting Standards Codification
-Section 45
-Paragraph 28
-Subparagraph (a)
-SubTopic 10
-Topic 230
-Publisher FASB
-URI https://asc.fasb.org//1943274/2147482740/230-10-45-28
| Name: |
us-gaap_IncreaseDecreaseInPrepaidDeferredExpenseAndOtherAssets |
| Namespace Prefix: |
us-gaap_ |
| Data Type: |
xbrli:monetaryItemType |
| Balance Type: |
credit |
| Period Type: |
duration |
|
| X |
- DefinitionThe increase (decrease) during the reporting period in security deposits. Reference 1: http://fasb.org/us-gaap/role/ref/legacyRef
-Name Accounting Standards Codification
-Section 45
-Paragraph 28
-Subparagraph (a)
-SubTopic 10
-Topic 230
-Publisher FASB
-URI https://asc.fasb.org//1943274/2147482740/230-10-45-28
| Name: |
us-gaap_IncreaseDecreaseInSecurityDeposits |
| Namespace Prefix: |
us-gaap_ |
| Data Type: |
xbrli:monetaryItemType |
| Balance Type: |
debit |
| Period Type: |
duration |
|
| X |
- DefinitionAmount of cash paid for interest, excluding capitalized interest, classified as operating activity. Includes, but is not limited to, payment to settle zero-coupon bond for accreted interest of debt discount and debt instrument with insignificant coupon interest rate in relation to effective interest rate of borrowing attributable to accreted interest of debt discount. Reference 1: http://www.xbrl.org/2003/role/disclosureRef
-Topic 230
-SubTopic 10
-Name Accounting Standards Codification
-Section 45
-Paragraph 17
-Subparagraph (d)
-Publisher FASB
-URI https://asc.fasb.org//1943274/2147482740/230-10-45-17
Reference 2: http://www.xbrl.org/2003/role/disclosureRef
-Topic 230
-SubTopic 10
-Name Accounting Standards Codification
-Section 45
-Paragraph 25
-Subparagraph (e)
-Publisher FASB
-URI https://asc.fasb.org//1943274/2147482740/230-10-45-25
Reference 3: http://www.xbrl.org/2003/role/disclosureRef
-Topic 230
-SubTopic 10
-Name Accounting Standards Codification
-Section 50
-Paragraph 2
-Publisher FASB
-URI https://asc.fasb.org//1943274/2147482913/230-10-50-2
| Name: |
us-gaap_InterestPaidNet |
| Namespace Prefix: |
us-gaap_ |
| Data Type: |
xbrli:monetaryItemType |
| Balance Type: |
credit |
| Period Type: |
duration |
|
| X |
- DefinitionAmount of cash inflow (outflow) from financing activities, including discontinued operations. Financing activity cash flows include obtaining resources from owners and providing them with a return on, and a return of, their investment; borrowing money and repaying amounts borrowed, or settling the obligation; and obtaining and paying for other resources obtained from creditors on long-term credit. Reference 1: http://www.xbrl.org/2003/role/disclosureRef
-Topic 230
-SubTopic 10
-Name Accounting Standards Codification
-Section 45
-Paragraph 24
-Publisher FASB
-URI https://asc.fasb.org//1943274/2147482740/230-10-45-24
| Name: |
us-gaap_NetCashProvidedByUsedInFinancingActivities |
| Namespace Prefix: |
us-gaap_ |
| Data Type: |
xbrli:monetaryItemType |
| Balance Type: |
debit |
| Period Type: |
duration |
|
| X |
- References
+ Details
| Name: |
us-gaap_NetCashProvidedByUsedInFinancingActivitiesAbstract |
| Namespace Prefix: |
us-gaap_ |
| Data Type: |
xbrli:stringItemType |
| Balance Type: |
na |
| Period Type: |
duration |
|
| X |
- DefinitionAmount of cash inflow (outflow) from investing activities, including discontinued operations. Investing activity cash flows include making and collecting loans and acquiring and disposing of debt or equity instruments and property, plant, and equipment and other productive assets. Reference 1: http://www.xbrl.org/2003/role/disclosureRef
-Topic 230
-SubTopic 10
-Name Accounting Standards Codification
-Section 45
-Paragraph 24
-Publisher FASB
-URI https://asc.fasb.org//1943274/2147482740/230-10-45-24
| Name: |
us-gaap_NetCashProvidedByUsedInInvestingActivities |
| Namespace Prefix: |
us-gaap_ |
| Data Type: |
xbrli:monetaryItemType |
| Balance Type: |
debit |
| Period Type: |
duration |
|
| X |
- References
+ Details
| Name: |
us-gaap_NetCashProvidedByUsedInInvestingActivitiesAbstract |
| Namespace Prefix: |
us-gaap_ |
| Data Type: |
xbrli:stringItemType |
| Balance Type: |
na |
| Period Type: |
duration |
|
| X |
- DefinitionAmount of cash inflow (outflow) from operating activities, including discontinued operations. Operating activity cash flows include transactions, adjustments, and changes in value not defined as investing or financing activities. Reference 1: http://fasb.org/us-gaap/role/ref/legacyRef
-Topic 230
-SubTopic 10
-Name Accounting Standards Codification
-Section 45
-Paragraph 28
-Publisher FASB
-URI https://asc.fasb.org//1943274/2147482740/230-10-45-28
Reference 2: http://fasb.org/us-gaap/role/ref/legacyRef
-Topic 230
-SubTopic 10
-Name Accounting Standards Codification
-Section 45
-Paragraph 24
-Publisher FASB
-URI https://asc.fasb.org//1943274/2147482740/230-10-45-24
Reference 3: http://fasb.org/us-gaap/role/ref/legacyRef
-Topic 230
-SubTopic 10
-Name Accounting Standards Codification
-Section 45
-Paragraph 25
-Publisher FASB
-URI https://asc.fasb.org//1943274/2147482740/230-10-45-25
| Name: |
us-gaap_NetCashProvidedByUsedInOperatingActivities |
| Namespace Prefix: |
us-gaap_ |
| Data Type: |
xbrli:monetaryItemType |
| Balance Type: |
na |
| Period Type: |
duration |
|
| X |
- References
+ Details
| Name: |
us-gaap_NetCashProvidedByUsedInOperatingActivitiesAbstract |
| Namespace Prefix: |
us-gaap_ |
| Data Type: |
xbrli:stringItemType |
| Balance Type: |
na |
| Period Type: |
duration |
|
| X |
- DefinitionThe portion of profit or loss for the period, net of income taxes, which is attributable to the parent. Reference 1: http://www.xbrl.org/2003/role/disclosureRef
-Topic 235
-SubTopic 10
-Name Accounting Standards Codification
-Section S99
-Paragraph 1
-Subparagraph (SX 210.4-08(g)(1)(ii))
-Publisher FASB
-URI https://asc.fasb.org//1943274/2147480678/235-10-S99-1
Reference 2: http://www.xbrl.org/2003/role/disclosureRef
-Topic 323
-SubTopic 10
-Name Accounting Standards Codification
-Section 50
-Paragraph 3
-Subparagraph (c)
-Publisher FASB
-URI https://asc.fasb.org//1943274/2147481687/323-10-50-3
Reference 3: http://www.xbrl.org/2003/role/disclosureRef
-Topic 825
-SubTopic 10
-Name Accounting Standards Codification
-Section 50
-Paragraph 28
-Subparagraph (f)
-Publisher FASB
-URI https://asc.fasb.org//1943274/2147482907/825-10-50-28
Reference 4: http://www.xbrl.org/2003/role/disclosureRef
-Topic 220
-SubTopic 10
-Name Accounting Standards Codification
-Section 50
-Paragraph 6
-Publisher FASB
-URI https://asc.fasb.org//1943274/2147482765/220-10-50-6
Reference 5: http://www.xbrl.org/2003/role/disclosureRef
-Topic 250
-SubTopic 10
-Name Accounting Standards Codification
-Section 50
-Paragraph 3
-Publisher FASB
-URI https://asc.fasb.org//1943274/2147483443/250-10-50-3
Reference 6: http://www.xbrl.org/2003/role/disclosureRef
-Topic 250
-SubTopic 10
-Name Accounting Standards Codification
-Section 50
-Paragraph 1
-Subparagraph (b)(2)
-Publisher FASB
-URI https://asc.fasb.org//1943274/2147483443/250-10-50-1
Reference 7: http://www.xbrl.org/2003/role/disclosureRef
-Topic 815
-SubTopic 40
-Name Accounting Standards Codification
-Section 65
-Paragraph 1
-Subparagraph (f)
-Publisher FASB
-URI https://asc.fasb.org//1943274/2147480175/815-40-65-1
Reference 8: http://www.xbrl.org/2003/role/disclosureRef
-Topic 250
-SubTopic 10
-Name Accounting Standards Codification
-Section 50
-Paragraph 8
-Publisher FASB
-URI https://asc.fasb.org//1943274/2147483443/250-10-50-8
Reference 9: http://www.xbrl.org/2003/role/disclosureRef
-Topic 250
-SubTopic 10
-Name Accounting Standards Codification
-Section 50
-Paragraph 9
-Publisher FASB
-URI https://asc.fasb.org//1943274/2147483443/250-10-50-9
Reference 10: http://www.xbrl.org/2003/role/disclosureRef
-Topic 250
-SubTopic 10
-Name Accounting Standards Codification
-Section 50
-Paragraph 11
-Subparagraph (a)
-Publisher FASB
-URI https://asc.fasb.org//1943274/2147483443/250-10-50-11
Reference 11: http://www.xbrl.org/2003/role/disclosureRef
-Topic 250
-SubTopic 10
-Name Accounting Standards Codification
-Section 50
-Paragraph 11
-Subparagraph (b)
-Publisher FASB
-URI https://asc.fasb.org//1943274/2147483443/250-10-50-11
Reference 12: http://www.xbrl.org/2003/role/disclosureRef
-Topic 250
-SubTopic 10
-Name Accounting Standards Codification
-Section 50
-Paragraph 4
-Publisher FASB
-URI https://asc.fasb.org//1943274/2147483443/250-10-50-4
Reference 13: http://www.xbrl.org/2003/role/exampleRef
-Topic 946
-SubTopic 830
-Name Accounting Standards Codification
-Section 55
-Paragraph 10
-Publisher FASB
-URI https://asc.fasb.org//1943274/2147480167/946-830-55-10
Reference 14: http://www.xbrl.org/2003/role/disclosureRef
-Topic 946
-SubTopic 220
-Name Accounting Standards Codification
-Section 45
-Paragraph 7
-Publisher FASB
-URI https://asc.fasb.org//1943274/2147483581/946-220-45-7
Reference 15: http://www.xbrl.org/2003/role/disclosureRef
-Topic 944
-SubTopic 220
-Name Accounting Standards Codification
-Section S99
-Paragraph 1
-Subparagraph (SX 210.7-04(18))
-Publisher FASB
-URI https://asc.fasb.org//1943274/2147483586/944-220-S99-1
Reference 16: http://www.xbrl.org/2003/role/disclosureRef
-Topic 280
-SubTopic 10
-Name Accounting Standards Codification
-Section 50
-Paragraph 22
-Publisher FASB
-URI https://asc.fasb.org//1943274/2147482810/280-10-50-22
Reference 17: http://www.xbrl.org/2003/role/disclosureRef
-Topic 946
-SubTopic 220
-Name Accounting Standards Codification
-Section S99
-Paragraph 1
-Subparagraph (SX 210.6-07(9))
-Publisher FASB
-URI https://asc.fasb.org//1943274/2147483575/946-220-S99-1
Reference 18: http://www.xbrl.org/2003/role/disclosureRef
-Topic 946
-SubTopic 220
-Name Accounting Standards Codification
-Section S99
-Paragraph 3
-Subparagraph (SX 210.6-09(1)(d))
-Publisher FASB
-URI https://asc.fasb.org//1943274/2147483575/946-220-S99-3
Reference 19: http://www.xbrl.org/2003/role/disclosureRef
-Topic 470
-SubTopic 10
-Name Accounting Standards Codification
-Section S99
-Paragraph 1A
-Subparagraph (SX 210.13-01(a)(4)(i))
-Publisher FASB
-URI https://asc.fasb.org//1943274/2147480097/470-10-S99-1A
Reference 20: http://www.xbrl.org/2009/role/commonPracticeRef
-Topic 470
-SubTopic 10
-Name Accounting Standards Codification
-Section S99
-Paragraph 1A
-Subparagraph (SX 210.13-01(a)(4)(ii))
-Publisher FASB
-URI https://asc.fasb.org//1943274/2147480097/470-10-S99-1A
Reference 21: http://www.xbrl.org/2003/role/disclosureRef
-Topic 470
-SubTopic 10
-Name Accounting Standards Codification
-Section S99
-Paragraph 1A
-Subparagraph (SX 210.13-01(a)(4)(iii)(A))
-Publisher FASB
-URI https://asc.fasb.org//1943274/2147480097/470-10-S99-1A
Reference 22: http://www.xbrl.org/2003/role/disclosureRef
-Topic 470
-SubTopic 10
-Name Accounting Standards Codification
-Section S99
-Paragraph 1A
-Subparagraph (SX 210.13-01(a)(4)(iv))
-Publisher FASB
-URI https://asc.fasb.org//1943274/2147480097/470-10-S99-1A
Reference 23: http://www.xbrl.org/2003/role/disclosureRef
-Topic 470
-SubTopic 10
-Name Accounting Standards Codification
-Section S99
-Paragraph 1A
-Subparagraph (SX 210.13-01(a)(5))
-Publisher FASB
-URI https://asc.fasb.org//1943274/2147480097/470-10-S99-1A
Reference 24: http://www.xbrl.org/2003/role/disclosureRef
-Topic 470
-SubTopic 10
-Name Accounting Standards Codification
-Section S99
-Paragraph 1B
-Subparagraph (SX 210.13-02(a)(4)(i))
-Publisher FASB
-URI https://asc.fasb.org//1943274/2147480097/470-10-S99-1B
Reference 25: http://www.xbrl.org/2003/role/disclosureRef
-Topic 470
-SubTopic 10
-Name Accounting Standards Codification
-Section S99
-Paragraph 1B
-Subparagraph (SX 210.13-02(a)(4)(iii)(A))
-Publisher FASB
-URI https://asc.fasb.org//1943274/2147480097/470-10-S99-1B
Reference 26: http://www.xbrl.org/2003/role/disclosureRef
-Topic 470
-SubTopic 10
-Name Accounting Standards Codification
-Section S99
-Paragraph 1B
-Subparagraph (SX 210.13-02(a)(4)(iii)(B))
-Publisher FASB
-URI https://asc.fasb.org//1943274/2147480097/470-10-S99-1B
Reference 27: http://www.xbrl.org/2003/role/disclosureRef
-Topic 470
-SubTopic 10
-Name Accounting Standards Codification
-Section S99
-Paragraph 1B
-Subparagraph (SX 210.13-02(a)(4)(iv))
-Publisher FASB
-URI https://asc.fasb.org//1943274/2147480097/470-10-S99-1B
Reference 28: http://www.xbrl.org/2003/role/disclosureRef
-Topic 470
-SubTopic 10
-Name Accounting Standards Codification
-Section S99
-Paragraph 1B
-Subparagraph (SX 210.13-02(a)(5))
-Publisher FASB
-URI https://asc.fasb.org//1943274/2147480097/470-10-S99-1B
Reference 29: http://www.xbrl.org/2003/role/disclosureRef
-Topic 280
-SubTopic 10
-Name Accounting Standards Codification
-Section 50
-Paragraph 30
-Subparagraph (b)
-Publisher FASB
-URI https://asc.fasb.org//1943274/2147482810/280-10-50-30
Reference 30: http://www.xbrl.org/2003/role/disclosureRef
-Topic 280
-SubTopic 10
-Name Accounting Standards Codification
-Section 50
-Paragraph 32
-Subparagraph (f)
-Publisher FASB
-URI https://asc.fasb.org//1943274/2147482810/280-10-50-32
Reference 31: http://www.xbrl.org/2003/role/disclosureRef
-Topic 260
-SubTopic 10
-Name Accounting Standards Codification
-Section 45
-Paragraph 60B
-Subparagraph (a)
-Publisher FASB
-URI https://asc.fasb.org//1943274/2147482689/260-10-45-60B
Reference 32: http://www.xbrl.org/2003/role/exampleRef
-Topic 280
-SubTopic 10
-Name Accounting Standards Codification
-Section 50
-Paragraph 31
-Publisher FASB
-URI https://asc.fasb.org//1943274/2147482810/280-10-50-31
Reference 33: http://www.xbrl.org/2003/role/disclosureRef
-Topic 280
-SubTopic 10
-Name Accounting Standards Codification
-Section 50
-Paragraph 32
-Subparagraph (c)
-Publisher FASB
-URI https://asc.fasb.org//1943274/2147482810/280-10-50-32
Reference 34: http://www.xbrl.org/2003/role/disclosureRef
-Topic 205
-SubTopic 20
-Name Accounting Standards Codification
-Section 50
-Paragraph 7
-Publisher FASB
-URI https://asc.fasb.org//1943274/2147483499/205-20-50-7
Reference 35: http://fasb.org/us-gaap/role/ref/legacyRef
-Topic 230
-SubTopic 10
-Name Accounting Standards Codification
-Section 45
-Paragraph 28
-Publisher FASB
-URI https://asc.fasb.org//1943274/2147482740/230-10-45-28
Reference 36: http://www.xbrl.org/2003/role/disclosureRef
-Topic 220
-SubTopic 10
-Name Accounting Standards Codification
-Section 45
-Paragraph 1A
-Subparagraph (a)
-Publisher FASB
-URI https://asc.fasb.org//1943274/2147482790/220-10-45-1A
Reference 37: http://www.xbrl.org/2003/role/disclosureRef
-Topic 220
-SubTopic 10
-Name Accounting Standards Codification
-Section 45
-Paragraph 1B
-Subparagraph (a)
-Publisher FASB
-URI https://asc.fasb.org//1943274/2147482790/220-10-45-1B
Reference 38: http://fasb.org/us-gaap/role/ref/legacyRef
-Topic 220
-SubTopic 10
-Name Accounting Standards Codification
-Section S99
-Paragraph 2
-Subparagraph (SX 210.5-03(20))
-Publisher FASB
-URI https://asc.fasb.org//1943274/2147483621/220-10-S99-2
Reference 39: http://fasb.org/us-gaap/role/ref/legacyRef
-Topic 942
-SubTopic 220
-Name Accounting Standards Codification
-Section S99
-Paragraph 1
-Subparagraph (SX 210.9-04(22))
-Publisher FASB
-URI https://asc.fasb.org//1943274/2147483589/942-220-S99-1
| Name: |
us-gaap_NetIncomeLoss |
| Namespace Prefix: |
us-gaap_ |
| Data Type: |
xbrli:monetaryItemType |
| Balance Type: |
credit |
| Period Type: |
duration |
|
| X |
- DefinitionAmount of periodic reduction over lease term of carrying amount of right-of-use asset from operating lease. Reference 1: http://www.xbrl.org/2009/role/commonPracticeRef
-Topic 230
-SubTopic 10
-Name Accounting Standards Codification
-Section 45
-Paragraph 28
-Subparagraph (b)
-Publisher FASB
-URI https://asc.fasb.org//1943274/2147482740/230-10-45-28
| Name: |
us-gaap_OperatingLeaseRightOfUseAssetAmortizationExpense |
| Namespace Prefix: |
us-gaap_ |
| Data Type: |
xbrli:monetaryItemType |
| Balance Type: |
debit |
| Period Type: |
duration |
|
| X |
- DefinitionInterest paid other than in cash for example by issuing additional debt securities. As a noncash item, it is added to net income when calculating cash provided by or used in operations using the indirect method. Reference 1: http://fasb.org/us-gaap/role/ref/legacyRef
-Name Accounting Standards Codification
-Section 45
-Paragraph 28
-Subparagraph (b)
-SubTopic 10
-Topic 230
-Publisher FASB
-URI https://asc.fasb.org//1943274/2147482740/230-10-45-28
| Name: |
us-gaap_PaidInKindInterest |
| Namespace Prefix: |
us-gaap_ |
| Data Type: |
xbrli:monetaryItemType |
| Balance Type: |
debit |
| Period Type: |
duration |
|
| X |
- DefinitionAmount of cash outflow in the form of ordinary dividends to preferred shareholders of the parent entity. Reference 1: http://fasb.org/us-gaap/role/ref/legacyRef
-Name Accounting Standards Codification
-Topic 230
-SubTopic 10
-Section 45
-Paragraph 15
-Subparagraph (a)
-Publisher FASB
-URI https://asc.fasb.org//1943274/2147482740/230-10-45-15
| Name: |
us-gaap_PaymentsOfDividendsPreferredStockAndPreferenceStock |
| Namespace Prefix: |
us-gaap_ |
| Data Type: |
xbrli:monetaryItemType |
| Balance Type: |
credit |
| Period Type: |
duration |
|
| X |
- DefinitionThe cash outflow associated with the purchase of all investments (debt, security, other) during the period. Reference 1: http://fasb.org/us-gaap/role/ref/legacyRef
-Topic 230
-SubTopic 10
-Name Accounting Standards Codification
-Section 45
-Paragraph 13
-Publisher FASB
-URI https://asc.fasb.org//1943274/2147482740/230-10-45-13
| Name: |
us-gaap_PaymentsToAcquireInvestments |
| Namespace Prefix: |
us-gaap_ |
| Data Type: |
xbrli:monetaryItemType |
| Balance Type: |
credit |
| Period Type: |
duration |
|
| X |
- DefinitionThe cash outflow associated with the acquisition of long-lived, physical assets that are used in the normal conduct of business to produce goods and services and not intended for resale; includes cash outflows to pay for construction of self-constructed assets. Reference 1: http://fasb.org/us-gaap/role/ref/legacyRef
-Topic 230
-SubTopic 10
-Name Accounting Standards Codification
-Section 45
-Paragraph 13
-Subparagraph (c)
-Publisher FASB
-URI https://asc.fasb.org//1943274/2147482740/230-10-45-13
| Name: |
us-gaap_PaymentsToAcquirePropertyPlantAndEquipment |
| Namespace Prefix: |
us-gaap_ |
| Data Type: |
xbrli:monetaryItemType |
| Balance Type: |
credit |
| Period Type: |
duration |
|
| X |
- DefinitionProceeds from issuance of capital stock which provides for a specific dividend that is paid to the shareholders before any dividends to common stockholders and which takes precedence over common stockholders in the event of liquidation. Reference 1: http://fasb.org/us-gaap/role/ref/legacyRef
-Name Accounting Standards Codification
-Section 45
-Paragraph 14
-Subparagraph (a)
-SubTopic 10
-Topic 230
-Publisher FASB
-URI https://asc.fasb.org//1943274/2147482740/230-10-45-14
| Name: |
us-gaap_ProceedsFromIssuanceOfPreferredStockAndPreferenceStock |
| Namespace Prefix: |
us-gaap_ |
| Data Type: |
xbrli:monetaryItemType |
| Balance Type: |
debit |
| Period Type: |
duration |
|
| X |
- DefinitionThe net cash inflow or cash outflow from a contractual arrangement with the lender, including letter of credit, standby letter of credit and revolving credit arrangements, under which borrowings can be made up to a specific amount at any point in time with either short term or long term maturity that is collateralized (backed by pledge, mortgage or other lien in the entity's assets).
| Name: |
us-gaap_ProceedsFromRepaymentsOfLinesOfCredit |
| Namespace Prefix: |
us-gaap_ |
| Data Type: |
xbrli:monetaryItemType |
| Balance Type: |
debit |
| Period Type: |
duration |
|
| X |
- DefinitionAmount of cash inflow from exercise of option under share-based payment arrangement. Reference 1: http://fasb.org/us-gaap/role/ref/legacyRef
-Name Accounting Standards Codification
-Section 45
-Paragraph 14
-Subparagraph (a)
-SubTopic 10
-Topic 230
-Publisher FASB
-URI https://asc.fasb.org//1943274/2147482740/230-10-45-14
Reference 2: http://fasb.org/us-gaap/role/ref/legacyRef
-Name Accounting Standards Codification
-Section 50
-Paragraph 2A
-Subparagraph (a)
-SubTopic 10
-Topic 718
-Publisher FASB
-URI https://asc.fasb.org//1943274/2147480429/718-10-50-2A
| Name: |
us-gaap_ProceedsFromStockOptionsExercised |
| Namespace Prefix: |
us-gaap_ |
| Data Type: |
xbrli:monetaryItemType |
| Balance Type: |
debit |
| Period Type: |
duration |
|
| X |
- DefinitionThe cash outflow for debt initially having maturity due after one year or beyond the normal operating cycle, if longer. Reference 1: http://www.xbrl.org/2003/role/disclosureRef
-Topic 946
-SubTopic 10
-Name Accounting Standards Codification
-Section S99
-Paragraph 3
-Subparagraph (SX 210.6-03(i)(2))
-Publisher FASB
-URI https://asc.fasb.org//1943274/2147479886/946-10-S99-3
Reference 2: http://fasb.org/us-gaap/role/ref/legacyRef
-Name Accounting Standards Codification
-Topic 230
-SubTopic 10
-Section 45
-Paragraph 15
-Subparagraph (b)
-Publisher FASB
-URI https://asc.fasb.org//1943274/2147482740/230-10-45-15
| Name: |
us-gaap_RepaymentsOfLongTermDebt |
| Namespace Prefix: |
us-gaap_ |
| Data Type: |
xbrli:monetaryItemType |
| Balance Type: |
credit |
| Period Type: |
duration |
|
| X |
- DefinitionAmount of noncash expense for share-based payment arrangement. Reference 1: http://fasb.org/us-gaap/role/ref/legacyRef
-Name Accounting Standards Codification
-Section 45
-Paragraph 28
-Subparagraph (a)
-SubTopic 10
-Topic 230
-Publisher FASB
-URI https://asc.fasb.org//1943274/2147482740/230-10-45-28
| Name: |
us-gaap_ShareBasedCompensation |
| Namespace Prefix: |
us-gaap_ |
| Data Type: |
xbrli:monetaryItemType |
| Balance Type: |
debit |
| Period Type: |
duration |
|
v3.23.2
Nature of Operations and Basis of Presentation
|
6 Months Ended |
Jul. 31, 2023 |
|---|
| Organization, Consolidation and Presentation of Financial Statements [Abstract] |
|
| Nature of Operations and Basis of Presentation |
Note
1 - Nature of Operations and Basis of Presentation
Nature
of Operations
Mama’s
Creations, Inc. (together with its subsidiaries, the “Company”), was organized on July 22, 2009 as a Nevada corporation.
The Company has a year-end of January 31.
Our
subsidiary, MamaMancini’s Inc., a Delaware Corporation (“Mamas”) is a marketer, manufacturer and distributor of beef
meatballs with sauce, turkey meatballs with sauce, beef meat loaf, sausage & peppers, chicken parmesan and other similar meats and
sauces. In addition, the Company continues to diversify its product line by introducing new products such as ready to serve meals, single-size
pasta bowls, bulk deli, and packaged refrigerated protein products. Mamas products were submitted to the United States Department of
Agriculture (the “USDA”) and approved as all natural. The USDA defines all natural as a product that contains no artificial
ingredients, coloring ingredients or chemical preservatives and is minimally processed.
On
December 29, 2021, the Company made two acquisitions which expanded the Company’s core product lines, occasions, and access to
specific cohorts and markets. T&L Creative Salads, Inc. (“T&L”) and Olive Branch, LLC (“Olive Branch”),
are related premier gourmet food manufacturers based in New York. T&L offers a full line of foods for retail food chains and club
stores, delis, bagel stores, caterers and provision distributors. T&L uses high-quality meats, seafood and vegetables, prepared to
meet the standards set forth by the USDA and the Food and Drug Administration (“FDA”). Olive Branch offers a full line of
olives, olive mixes, and savory products to retail food chains and club stores, delis, bagel stores, caterers and provision distributors,
primarily in pre-packaged containers.
On
June 28, 2022, the Company acquired a 24% minority interest in Chef Inspirational Foods, LLC (“CIF”), a leading developer,
innovator, marketer and sales company selling prepared foods, for an investment of $1.2 million. The investment consisted of $500,000
in cash and $700,000 in the Company’s common stock. The acquisition of the interest in CIF was accounted for under the equity method
of accounting for investments up until the Company acquired the remaining interest of CIF (the “CIF Acquisition”). On June
28, 2023, the Company completed the acquisition of the remaining 76% of CIF, in accordance with the terms of the Membership Interest
Purchase Agreement dated June 28, 2023 by and among the Company, Siegel Suffolk Family, LLC, and R&I Loeb Family, LLC (the “Sellers”).
Per the terms of the Membership Interest Purchase Agreement the purchase price was $3.65 million, including $950 thousand in cash at
closing and $2.7 million in a promissory note. The promissory note requires a principal payment of $1.2 million in cash on the first
anniversary of the closing date, and a payment of $1.5 million in common stock of the Company on the second anniversary of the closing
date.
The
following presents the unaudited results of operations for the period February 1, 2023 through June 28, 2023 of CIF.
Schedule
of Results of Operations
| | |
For the Period
February 1, 2023
through
June 28, 2023 | |
| Revenues | |
$ | 13,720,817 | |
| Net income | |
$ | 930,592 | |
On
July 31, 2023, MamaMancini’s Holdings, Inc. filed an amendment to the Articles of Incorporation with the Secretary of State of
the State of Nevada to change the Company’s name from “MamaMancini’s Holdings, Inc.” to “Mama’s Creations,
Inc.” (the “Name Change”). The Name Change, which was approved by the Company’s stockholders at its annual meeting
on July 31, 2023, did not alter the voting powers or relative rights of the Company Common Stock, reflects the evolution of the Company
from its origins as a home style, old world Italian food company to a broader provider of all-natural specialty prepared refrigerated
foods for sale in retailers around the country. The Company also amended and restated its Amended and Restated Bylaws, solely to reflect
the name change (as amended, the “Second Amended and Restated Bylaws”).
|
| X |
- DefinitionThe entire disclosure for the nature of an entity's business, major products or services, principal markets including location, and the relative importance of its operations in each business and the basis for the determination, including but not limited to, assets, revenues, or earnings. For an entity that has not commenced principal operations, disclosures about the risks and uncertainties related to the activities in which the entity is currently engaged and an understanding of what those activities are being directed toward. Reference 1: http://www.xbrl.org/2003/role/disclosureRef
-Name Accounting Standards Codification
-Topic 275
-Publisher FASB
-URI https://asc.fasb.org//275/tableOfContent
Reference 2: http://www.xbrl.org/2003/role/disclosureRef
-Name Accounting Standards Codification
-Section 50
-Paragraph 1
-Subparagraph (a)
-SubTopic 10
-Topic 275
-Publisher FASB
-URI https://asc.fasb.org//1943274/2147482861/275-10-50-1
| Name: |
us-gaap_NatureOfOperations |
| Namespace Prefix: |
us-gaap_ |
| Data Type: |
dtr-types:textBlockItemType |
| Balance Type: |
na |
| Period Type: |
duration |
|
| X |
- References
+ Details
| Name: |
us-gaap_OrganizationConsolidationAndPresentationOfFinancialStatementsAbstract |
| Namespace Prefix: |
us-gaap_ |
| Data Type: |
xbrli:stringItemType |
| Balance Type: |
na |
| Period Type: |
duration |
|
v3.23.2
Summary of Significant Accounting Policies
|
6 Months Ended |
Jul. 31, 2023 |
|---|
| Accounting Policies [Abstract] |
|
| Summary of Significant Accounting Policies |
Note
2 - Summary of Significant Accounting Policies
Basis
of Presentation
The
accompanying unaudited Condensed Consolidated Financial Statements have been prepared in accordance with accounting principles generally
accepted in the United States of America (“U.S. GAAP”) for interim financial information and with the instructions to Form
10-Q and Article 8 of Regulation S-X of the SEC for interim financial information. Accordingly, they do not include all of the information
and footnotes required by generally accepted accounting principles for complete financial statements. In the opinion of management, the
accompanying Condensed Consolidated Financial Statements of the Company and its subsidiaries, which are unaudited, include all normal
and recurring adjustments considered necessary to present fairly the Company’s financial position as of July 31, 2023, and the
results of its operations and its cash flows for the periods presented. The unaudited Condensed Consolidated Financial Statements herein
should be read together with the historical consolidated financial statements of the Company for the years ended January 31, 2023 and
2022 included in our 2023 Form 10-K. Operating results for the three and six months ended July 31, 2023 are not necessarily indicative
of the results that may be expected for the year ending January 31, 2024.
Principles
of Consolidation
The
Condensed Consolidated Financial Statements include the accounts of the Company and its wholly owned subsidiaries. All intercompany balances
have been eliminated in consolidation.
Use
of Estimates
The
preparation of Condensed Consolidated Financial Statements in accordance with U.S. GAAP requires management to make estimates and assumptions
that affect the amounts reported in the Condensed Consolidated Financial Statements and accompanying notes. The Company bases its estimates
on historical experience and other assumptions believed to be reasonable under the circumstances, the results of which form the basis
for making judgments about the carrying value of assets and liabilities that are not readily apparent from other sources. Such estimates
and assumptions impact, among others, the following: allowance for doubtful accounts, the fair value of stock-based payments, valuation
of the acquisition of the remaining interest of CIF (which was accounted for as an asset acquisition as substantially all of the fair
value is concentrated in customer relationships), inventory reserves, and estimates for unrealized returns, discounts, and other allowances
that are netted against revenue.
Making
estimates requires management to exercise significant judgment. It is at least reasonably possible that the estimate of the effect of
a condition, situation or set of circumstances that existed at the date of the Condensed Consolidated Financial Statements, which management
considered in formulating its estimate could change in the near term due to one or more future confirming events. Accordingly, the actual
results could differ significantly from our estimates.
Risks
and Uncertainties
The
Company operates in an industry that is subject to intense competition and changes in consumer demand. The Company’s operations
are subject to significant risk and uncertainties including financial and operational risks including the potential risk of business
failure.
The
Company has experienced, and in the future expects to continue to experience variability in sales and earnings. The factors expected
to contribute to this variability include, among others, (i) the cyclical nature of the grocery industry, (ii) general economic conditions
in the various local markets in which the Company competes, including a potential general downturn in the economy, and (iii) the volatility
of prices pertaining to food and beverages in connection with the Company’s distribution of the product. These factors, among others,
make it difficult to project the Company’s operating results on a consistent basis.
Cash
The
Company considers all highly liquid instruments purchased with a maturity of three months or less to be cash equivalents. The Company
held no cash equivalents at July 31, 2023 and January 31, 2023.
The
Company minimizes its credit risk associated with cash by periodically evaluating the credit quality of its primary financial institution.
The balance at times may exceed federally insured limits.
Accounts
Receivable and Allowance for Doubtful Accounts
Accounts
receivable are stated at the amount management expects to collect from outstanding balances. The Company generally does not require collateral
to support customer receivables. The Company provides an allowance for doubtful accounts based upon a review of the outstanding accounts
receivable, historical collection information and existing economic conditions. The Company determines if receivables are past due based
on days outstanding, and amounts are written off when determined to be uncollectible by management. As of July 31, 2023 and January 31,
2023, the reserve for uncollectible accounts was approximately $93,000 and $233,000, respectively. During the three and six months ended
July 31, 2023 the Company wrote off approximately $140,000 accounts that were deemed to be uncollectible.
Inventories
The
Company values its inventory at the lower of cost or net realizable value (“NRV”) and include direct material, direct labor,
warehousing, and overhead costs. NRV is defined as the estimated selling prices less the costs of completion, disposal, and transportation.
The cost of inventory is determined on the first-in, first-out basis. Inventories have been reduced by an allowance for excess, obsolete
and unsaleable inventories. The allowance is an estimate based on management’s review of inventories on hand compared to estimated
future usage and sales. The reserve for obsolescence as of July 31, 2023 and January 31, 2023 was approximately $126,000 and $32,000,
respectively.
Inventories
by major category are as follows:
Schedule of Inventories
| | |
July
31, 2023 | | |
January 31, 2023 | |
| Raw materials and packaging | |
$ | 1,495,179 | | |
$ | 1,883,270 | |
| Work in process | |
| 200,437 | | |
| 98,910 | |
| Finished goods | |
| 1,612,897 | | |
| 1,653,701 | |
| Total | |
$ | 3,308,513 | | |
$ | 3,635,881 | |
Property,
Plant and Equipment
Property,
plant, and equipment are recorded at cost net of depreciation. Depreciation expense is computed using straight-line methods over the
estimated useful lives.
Asset
lives for financial statement reporting of depreciation are:
Schedule
of Property and Equipment Estimated Useful Lives
| Machinery and equipment | |
| 2-7 years | |
| Furniture and fixtures | |
| 3-5 years | |
| Leasehold improvements | |
| -* | |
| (*) |
Amortized
on a straight-line basis over the remaining lease term at the time the asset was placed in service, whichever period is shorter. |
Upon
sale or retirement of property and equipment, the related cost and accumulated depreciation are removed from the accounts and any gain
or loss is reflected in the consolidated statements of operations.
Goodwill
and Other Intangible Assets
Goodwill
Goodwill represents the excess of the purchase price over the fair values
of the underlying net assets of an acquired business. The Company tests goodwill for impairment on an annual basis during the fourth quarter
of its fiscal year, or immediately if conditions indicate that such impairment could exist. The Company evaluates qualitative factors
to determine if it is more likely than not that the fair value is less than its carrying value and whether it is necessary to perform
goodwill impairment process.
As
of July 31, 2023 and January 31, 2023, there were no impairment losses recognized for goodwill.
Other
Intangible Assets
Other
intangible assets consist of trademarks, trade names and customer relationships. Intangible asset lives for financial statement reporting
of amortization are:
Schedule
of Other Intangible Assets Impairment Losses Recognized for Goodwill
| Tradenames and trademarks | |
| 3 years | |
| Customer relationships | |
| 4 – 5 years | |
Fair
Value of Financial Instruments
For
purpose of this disclosure, the fair value of a financial instrument is the amount at which the instrument could be exchanged in a current
transaction between willing parties, other than in a forced sale or liquidation. The carrying amount of the Company’s short-term
financial instruments approximates fair value due to the relatively short period to maturity for these instruments.
Research
and Development
Research
and development is expensed as incurred. Research and development expenses for the three months ended July 31, 2023 and 2022 were $94,871
and $41,792, respectively. Research and development expenses for the six months ended July 31, 2023 and 2022 were $166,056 and $68,327,
respectively.
Revenue
Recognition
The
Company recognizes revenue in accordance with FASB Topic 606, Revenue from Contracts with Customers (Topic 606).
The
Company’s sales are generated from the sale of finished products to customers, which contains a single performance obligation and
revenue is recognized at a single point in time when ownership, risks and rewards transfer. Typically, this occurs when the goods are
received and accepted by the customer. Revenues are recognized in an amount that reflects the net consideration the Company expects to
receive in exchange for the goods. The Company reports all amounts billed to a customer in a sale transaction as revenue. The Company
elected to treat shipping and handling activities as fulfillment activities, and the related costs are recorded as selling expenses in
selling, general and administrative expenses on the condensed consolidated statements of operations.
The
Company promotes its products with consumer incentives and trade promotions. These programs include discounts, slotting fees, coupons,
rebates, in-store display incentives and volume-based incentives. Customer trade promotion and consumer incentive activities are recorded
as a reduction to the transaction price based on amounts estimated as being due to customers and consumers at the end of a period. The
Company derives these estimates principally on historical utilization and redemption rates. The Company does not receive a distinct service
in relation to the consumer incentives and trade promotions and as a result, these incentives and promotions are accounted for as a reduction
of the transaction price.
Payment
terms in the Company’s invoices are based on the billing schedule established in contracts and purchase orders with customers.
The Company recognizes the related trade receivable when the goods are received by the customer.
Expenses
such as slotting fees, sales discounts, and allowances are accounted for as a direct reduction of revenues as follows:
Schedule
of Expenses of Slotting Fees, Sales Discounts and Allowances are Accounted as Direct Reduction of Revenues
| | |
July 31, 2023 | | |
July 31, 2022 | |
| | |
For the Three Months Ended | |
| | |
July 31, 2023 | | |
July 31, 2022 | |
| Gross Sales | |
$ | 25,414,735 | | |
$ | 23,631,857 | |
| Less: Slotting, Discounts, Allowances | |
| 624,650 | | |
| 785,383 | |
| Net Sales | |
$ | 24,790,085 | | |
$ | 22,846,474 | |
| | |
July 31, 2023 | | |
July 31, 2022 | |
| | |
For the Six Months Ended | |
| | |
July 31, 2023 | | |
July 31, 2022 | |
| Gross Sales | |
$ | 49,014,645 | | |
$ | 45,980,449 | |
| Less: Slotting, Discounts, Allowances | |
| 1,103,744 | | |
| 1,303,395 | |
| Net Sales | |
$ | 47,910,901 | | |
$ | 44,677,054 | |
Disaggregation
of Revenue from Contracts with Customers. The following table disaggregates gross revenue by significant geographic area for the
three months ended July 31, 2023 and 2022:
Schedule
of Disaggregates Gross Revenue by Significant Geographic Area
| | |
July 31, 2023 | | |
July 31, 2022 | |
| | |
For the Three Months Ended | |
| | |
July 31, 2023 | | |
July 31, 2022 | |
| Northeast | |
$ | 9,385,210 | | |
$ | 9,066,443 | |
| Southeast | |
| 7,191,911 | | |
| 6,857,963 | |
| Midwest | |
| 3,987,565 | | |
| 2,560,178 | |
| West | |
| 2,693,758 | | |
| 2,543,230 | |
| Southwest | |
| 2,156,291 | | |
| 2,604,043 | |
| Total gross sales | |
$ | 25,414,735 | | |
$ | 23,631,857 | |
The
following table disaggregates gross revenue by significant geographic area for the six months ended July 31, 2023 and 2022:
| | |
July 31, 2023 | | |
July 31, 2022 | |
| | |
For the Six Months Ended | |
| | |
July 31, 2023 | | |
July 31, 2022 | |
| Northeast | |
$ | 17,951,303 | | |
$ | 17,755,723 | |
| Southeast | |
| 13,887,317 | | |
| 12,365,760 | |
| Midwest | |
| 8,254,563 | | |
| 5,384,977 | |
| West | |
| 4,615,326 | | |
| 5,442,086 | |
| Southwest | |
| 4,306,136 | | |
| 5,031,903 | |
| Total gross sales | |
$ | 49,014,645 | | |
$ | 45,980,449 | |
Cost
of Sales
Cost
of sales represents costs directly related to the production and manufacturing of the Company’s products. Costs include production
costs, freight-in, packaging, and print production costs.
Advertising
Costs
incurred for advertising for the Company are charged to selling, general and administrative expenses as incurred. Advertising expenses
for the three months ended July 31, 2023 and 2022 were approximately $95,000 and $119,000 respectively. Advertising expenses for the
six months ended July 31, 2023 and 2022 were $304,000 and $307,000 respectively.
Stock-Based
Compensation
The
Company accounts for stock-based compensation in accordance with ASC Topic 718, “Compensation – Stock Compensation”
(“ASC 718”), which establishes financial accounting and reporting standards for stock-based employee compensation.
It defines a fair value-based method of accounting for an employee stock option or similar equity instrument.
The
Company recognizes all forms of stock-based payments, including stock option grants, warrants and restricted stock grants, at their fair
value on the grant date, which are based on the estimated number of awards that are ultimately expected to vest.
Stock-based
payments, excluding restricted stock, are valued using a Black-Scholes option pricing model. Grants of stock-based payment awards issued
to non-employees for services rendered have been recorded at the fair value of the stock-based payment, which is the more readily determinable
value. The grants are amortized on a straight-line basis over the requisite service periods, which is generally the vesting period. If
an award is granted, but vesting does not occur, any previously recognized compensation cost is reversed in the period related to the
termination of service. Stock-based compensation expenses are included in cost of goods sold, selling general and administrative expenses,
or research and development, depending on the nature of the services provided, in the condensed consolidated statements of operations.
Stock-based payments issued to placement agents are classified as a direct cost of a stock offering and are recorded as a reduction of
additional paid in capital.
For
the three months ended July 31, 2023 and 2022, stock-based compensation related to options amounted to approximately $18,000 and $12,000,
respectively.
For
the six months ended July 31, 2023 and 2022, stock-based compensation related to options amounted to approximately $41,000 and $12,000,
respectively.
For
the three and six months ended July 31, 2023, the Company issued 19,960 shares valued at approximately $50,000 to certain employees as
compensation.
For
the six months ended July 31, 2023 and 2022, when computing fair value of stock-based payments, the Company has considered the following
variables:
Schedule
of Fair Value of Share-Based Payments
| | |
July 31, 2023 | | |
July 31, 2022 | |
| Risk-free interest rate | |
| N/A | | |
| 2.77 | % |
| Expected life of grants | |
| N/A | | |
| 7.5 years | |
| Expected volatility of underlying stock | |
| N/A | | |
| 85.74 | % |
| Dividends | |
| N/A | | |
| 0 | % |
Earnings
Per Share
Basic
net income per share attributable to common stockholders excludes dilution and is computed by dividing net income or loss attributable
to common stockholders during the period by the weighted average number of common shares outstanding during the period. Diluted net income
or loss per share reflects potential dilution and is computed by dividing net income attributable to common stockholders by the weighted
average number of common shares outstanding during the period, which is increased by the number of additional common shares that would
have been outstanding if the potential common shares had been issued. However, if the effect of any additional securities are anti-dilutive
(i.e., resulting in a higher net income per share or lower net loss per share), they are excluded from the dilutive net income computation.
The dilutive effect of stock options, warrants, and restricted stock is calculated using the treasury-stock method and the dilutive effect
of the Series B Preferred Stock is calculated using the if-converted method.
The
following table provides a reconciliation of the numerator and denominator used in computing basic and diluted net income attributable
to common stockholders per common share.
Schedule
of Earnings Per Share, Basic and Diluted
| | |
July 31, 2023 | | |
July 31, 2022 | |
| | |
For the Three Months Ended | |
| | |
July 31, 2023 | | |
July 31, 2022 | |
| Numerator: | |
| | | |
| | |
| Net (loss) income attributable to common stockholders | |
$ | 1,722,678 | | |
| (743,246 | ) |
| Effect of dilutive securities: | |
| 21,233 | | |
| — | |
| | |
| | | |
| | |
| Diluted net income (loss) | |
$ | 1,743,911 | | |
$ | (743,246 | ) |
| | |
| | | |
| | |
| Denominator: | |
| | | |
| | |
| Weighted average common shares outstanding – basic | |
| 36,855,181 | | |
| 35,811,087 | |
| Dilutive securities (a): | |
| | | |
| | |
| Restricted stock | |
| 251,017 | | |
| - | |
| Options | |
| 384,369 | | |
| | |
| | |
| | | |
| - | |
| | |
| | | |
| | |
| Weighted average common shares outstanding and assumed conversion – diluted | |
| 37,490,567 | | |
| 35,811,087 | |
| | |
| | | |
| | |
| Basic net (loss) income per common share | |
$ | 0.05 | | |
$ | (0.02 | ) |
| | |
| | | |
| | |
| Diluted net (loss) income per common share | |
$ | 0.05 | | |
$ | (0.02 | ) |
| | |
| | | |
| | |
| (a) – Anti-dilutive securities excluded: | |
| - | | |
| 689,000 | |
| | |
July 31, 2023 | | |
July 31, 2022 | |
| | |
For the Six Months Ended | |
| | |
July 31, 2023 | | |
July 31, 2022 | |
| Numerator: | |
| | | |
| | |
| Net (loss) income attributable to common stockholders | |
$ | 3,096,304 | | |
| (639,549 | ) |
| Effect of dilutive securities: | |
| 48,533 | | |
| — | |
| | |
| | | |
| | |
| Diluted net income | |
$ | 3,144,837 | | |
$ | (639,549 | ) |
| | |
| | | |
| | |
| Denominator: | |
| | | |
| | |
| Weighted average common shares outstanding – basic | |
| 36,628,429 | | |
| 35,785,719 | |
| Dilutive securities (a): | |
| | | |
| | |
| Restricted stock | |
| 222,280 | | |
| - | |
| Options | |
| 344,605 | | |
| - | |
| | |
| | | |
| - | |
| | |
| | | |
| | |
| Weighted average common shares outstanding and assumed conversion – diluted | |
| 37,195,314 | | |
| 35,785,719 | |
| | |
| | | |
| | |
| Basic net (loss) income per common share | |
$ | 0.09 | | |
$ | (0.02 | ) |
| | |
| | | |
| | |
| Diluted net income (loss) per common share | |
$ | 0.08 | | |
$ | (0.02 | ) |
| | |
| | | |
| | |
| (a) – Anti-dilutive securities excluded: | |
| - | | |
| 689,000 | |
Income
Taxes
Income
taxes are provided in accordance with ASC 740, “Accounting for Income Taxes”. A deferred tax asset or liability is
recorded for all temporary differences between financial and tax reporting and net operating loss carryforwards. Deferred tax expense
results from the net change during the period of deferred tax assets and liabilities.
Deferred
tax assets are reduced by a valuation allowance when, in the opinion of management, it is more likely than not that some portion or all
of the deferred tax assets will not be realized. Deferred tax assets are adjusted for the effects of changes in tax laws and rates on
the date of enactment. As of July 31, 2023 and January 31, 2023, the Company recognized a deferred tax asset of $67,908 and $717,559,
respectively, which is included in other long-term assets on the condensed consolidated balance sheets. The Company regularly evaluates
the need for a valuation allowance related to the deferred tax asset.
Recent
Accounting Pronouncements
In
August 2020, the FASB issued ASU No. 2020-06, Accounting for Convertible Instruments and Contracts in an Entity’s Own Equity
(“ASU 2020-06”), which simplifies an issuer’s accounting for convertible instruments by reducing the number of
accounting models that require separate accounting for embedded conversion features. ASU 2020-06 also simplifies the settlement assessment
that entities are required to perform to determine whether a contract qualifies for equity classification and makes targeted improvements
to the disclosures for convertible instruments and earnings-per-share (EPS) guidance. This update will be effective for the Company’s
fiscal years beginning after December 15, 2023, and interim periods within those fiscal years. Early adoption is permitted, but no earlier
than fiscal years beginning after December 15, 2020, and interim periods within those fiscal years. Entities can elect to adopt the new
guidance through either a modified retrospective method of transition or a fully retrospective method of transition. The adoption of
the new standard is not expected to have a significant impact on the Company’s consolidated financial statements.
Management
does not believe that any recently issued, but not yet effective accounting pronouncements, when adopted, will have a material effect
on the accompanying consolidated financial statements.
|
| X |
- References
+ Details
| Name: |
us-gaap_AccountingPoliciesAbstract |
| Namespace Prefix: |
us-gaap_ |
| Data Type: |
xbrli:stringItemType |
| Balance Type: |
na |
| Period Type: |
duration |
|
| X |
- DefinitionThe entire disclosure for all significant accounting policies of the reporting entity. Reference 1: http://www.xbrl.org/2003/role/disclosureRef
-Topic 235
-SubTopic 10
-Name Accounting Standards Codification
-Section 50
-Paragraph 1
-Publisher FASB
-URI https://asc.fasb.org//1943274/2147483426/235-10-50-1
Reference 2: http://fasb.org/us-gaap/role/ref/legacyRef
-Topic 235
-Name Accounting Standards Codification
-Publisher FASB
-URI https://asc.fasb.org//235/tableOfContent
| Name: |
us-gaap_SignificantAccountingPoliciesTextBlock |
| Namespace Prefix: |
us-gaap_ |
| Data Type: |
dtr-types:textBlockItemType |
| Balance Type: |
na |
| Period Type: |
duration |
|
v3.23.2
Property Plant and Equipment
|
6 Months Ended |
Jul. 31, 2023 |
|---|
| Property, Plant and Equipment [Abstract] |
|
| Property Plant and Equipment |
Note
3 – Property Plant and Equipment:
Property
plant and equipment on July 31, 2023 and January 31, 2023 are as follows:
Schedule of Property and Equipment
| | |
July
31, 2023 | | |
January 31, 2023 | |
| Machinery and Equipment | |
$ | 3,669,137 | | |
$ | 5,387,255 | |
| Furniture and Fixtures | |
| 236,645 | | |
| 284,781 | |
| Leasehold Improvements | |
| 2,841,159 | | |
| 3,480,061 | |
| Property and Equipment, Gross | |
| 6,746,941 | | |
| 9,152,097 | |
| Less: Accumulated Depreciation | |
| 2,679,293 | | |
| 5,729,001 | |
| Total | |
$ | 4,067,648 | | |
$ | 3,423,096 | |
Depreciation
expense for the three months ended July 31, 2023 and 2022 amounted to $263,176 and $192,297, respectively. Depreciation expense for the
six months ended July 31, 2023 and 2022 amounted to $511,589 and $401,126, respectively.
|
| X |
- References
+ Details
| Name: |
us-gaap_PropertyPlantAndEquipmentAbstract |
| Namespace Prefix: |
us-gaap_ |
| Data Type: |
xbrli:stringItemType |
| Balance Type: |
na |
| Period Type: |
duration |
|
| X |
- DefinitionThe entire disclosure for long-lived, physical asset used in normal conduct of business and not intended for resale. Includes, but is not limited to, work of art, historical treasure, and similar asset classified as collections. Reference 1: http://fasb.org/us-gaap/role/ref/legacyRef
-Topic 360
-Name Accounting Standards Codification
-Publisher FASB
-URI https://asc.fasb.org//360/tableOfContent
Reference 2: http://www.xbrl.org/2003/role/disclosureRef
-Name Accounting Standards Codification
-Section 50
-Paragraph 6
-SubTopic 360
-Topic 958
-Publisher FASB
-URI https://asc.fasb.org//1943274/2147480321/958-360-50-6
Reference 3: http://www.xbrl.org/2003/role/disclosureRef
-Name Accounting Standards Codification
-Section 50
-Paragraph 1
-Subparagraph (d)
-SubTopic 360
-Topic 958
-Publisher FASB
-URI https://asc.fasb.org//1943274/2147480321/958-360-50-1
Reference 4: http://www.xbrl.org/2003/role/disclosureRef
-Name Accounting Standards Codification
-Section 50
-Paragraph 7
-SubTopic 360
-Topic 958
-Publisher FASB
-URI https://asc.fasb.org//1943274/2147480321/958-360-50-7
| Name: |
us-gaap_PropertyPlantAndEquipmentDisclosureTextBlock |
| Namespace Prefix: |
us-gaap_ |
| Data Type: |
dtr-types:textBlockItemType |
| Balance Type: |
na |
| Period Type: |
duration |
|
v3.23.2
Acquisition of CIF
|
6 Months Ended |
Jul. 31, 2023 |
|---|
| Business Combination and Asset Acquisition [Abstract] |
|
| Acquisition of CIF |
Note
4 – Acquisition of CIF
As
described in Note 1, on June 28, 2023, the Company completed the CIF Acquisition. The acquisition of the remaining interest in CIF was
accounted for as an asset acquisition as substantially all of the fair value was concentrated in customer relationships. CIF’s
assets (except for cash and working capital) were measured and recognized as an allocation of the transaction price based on their relative
fair values as of the transaction date. The fair value of total consideration was $5,216,828. The following table is a summary of the
purchase price calculation.
Schedule
of Purchase Price Calculation
| | |
| | |
| Cash transferred upon acquisition | |
| 950,000 | |
| Related party debt issued upon acquisition | |
| 2,700,000 | |
| Sub-total | |
| 3,650,000 | |
| Carrying value of the Company’s equity method investment in CIF | |
| 1,566,828 | |
| Total purchase price | |
| 5,216,828 | |
The
allocation of the purchase price was as follows (amounts in thousands):
Schedule
of Allocation of Purchase Price
| | |
| | |
| Cash and cash equivalents | |
$ | 304,359 | |
| Net working capital (excluding cash) | |
| 356,848 | |
| Customer relationships | |
| 4,555,621 | |
| Net assets acquired | |
$ | 5,216,828 | |
|
| X |
- References
+ Details
| Name: |
us-gaap_BusinessCombinationAndAssetAcquisitionAbstract |
| Namespace Prefix: |
us-gaap_ |
| Data Type: |
xbrli:stringItemType |
| Balance Type: |
na |
| Period Type: |
duration |
|
| X |
- DefinitionThe entire disclosure for a business combination (or series of individually immaterial business combinations) completed during the period, including background, timing, and recognized assets and liabilities. The disclosure may include leverage buyout transactions (as applicable). Reference 1: http://www.xbrl.org/2003/role/disclosureRef
-Topic 805
-SubTopic 20
-Name Accounting Standards Codification
-Section 50
-Paragraph 5
-Subparagraph (b)
-Publisher FASB
-URI https://asc.fasb.org//1943274/2147479907/805-20-50-5
Reference 2: http://fasb.org/us-gaap/role/ref/legacyRef
-Topic 805
-Name Accounting Standards Codification
-Publisher FASB
-URI https://asc.fasb.org//805/tableOfContent
| Name: |
us-gaap_BusinessCombinationDisclosureTextBlock |
| Namespace Prefix: |
us-gaap_ |
| Data Type: |
dtr-types:textBlockItemType |
| Balance Type: |
na |
| Period Type: |
duration |
|
v3.23.2
Intangible assets, net
|
6 Months Ended |
Jul. 31, 2023 |
|---|
| Goodwill and Intangible Assets Disclosure [Abstract] |
|
| Intangible assets, net |
Note
5 – Intangible assets, net
Intangible
assets, net consisted of the following at July 31, 2023:
Schedule of Intangibles Assets
| | |
Gross Carrying Amount | | |
Accumulated Amortization | | |
Net Carrying Amount | | |
Weighted Average Remaining Life (years) | |
| Software | |
$ | 87,639 | | |
$ | (87,639 | ) | |
$ | - | | |
| - | |
| Customer relationships | |
| 6,417,621 | | |
| (700,666 | ) | |
| 5,716,955 | | |
| 3.79 | |
| Tradename and trademarks | |
| 79,000 | | |
| (41,773 | ) | |
| 37,227 | | |
| 1.41 | |
| | |
$ | 6,584,260 | | |
$ | (830,078 | ) | |
$ | 5,754,182 | | |
| | |
Intangibles,
net consisted of the following at January 31, 2023:
| | |
Gross Carrying Amount | | |
Accumulated Amortization | | |
Net Carrying Amount | | |
Weighted Average Remaining Life | |
| Software | |
$ | 87,639 | | |
$ | (87,639 | ) | |
$ | - | | |
| - | |
| Customer relationships | |
| 1,862,000 | | |
| (409,776 | ) | |
| 1,452,224 | | |
| 3.41 | |
| Tradename and trademarks | |
| 79,000 | | |
| (28,714 | ) | |
| 50,286 | | |
| 1.91 | |
| | |
$ | 2,028,639 | | |
$ | (526,129 | ) | |
$ | 1,502,510 | | |
| | |
As
described in Note 1 and 4, on June 28, 2023, the Company completed the CIF Acquisition which resulted in the recognition of Customer
relationships in the amount of $4,555,621.
Amortization
expense for the three and six months ended July 31, 2023 was $202,053 and $303,949, respectively.
Amortization
expense for the three and six months ended July 31, 2022 was $116,986 and $ 230,156, respectively.
We
expect the estimated aggregate amortization expense for each of the five succeeding fiscal years to be as follows:
Schedule of Estimated Aggregate Amortization Expense
| | |
| | |
| 2024 (Remaining) | |
$ | 768,954 | |
| 2025 | |
| 1,538,766 | |
| 2026 | |
| 1,513,238 | |
| 2027 | |
| 1,466,741 | |
| 2028 | |
| 466,483 | |
| Total | |
$ | 5,754,182 | |
|
| X |
- References
+ Details
| Name: |
us-gaap_GoodwillAndIntangibleAssetsDisclosureAbstract |
| Namespace Prefix: |
us-gaap_ |
| Data Type: |
xbrli:stringItemType |
| Balance Type: |
na |
| Period Type: |
duration |
|
| X |
- DefinitionThe entire disclosure for all or part of the information related to intangible assets. Reference 1: http://www.xbrl.org/2003/role/disclosureRef
-Topic 350
-SubTopic 30
-Name Accounting Standards Codification
-Publisher FASB
-URI https://asc.fasb.org//350-30/tableOfContent
| Name: |
us-gaap_IntangibleAssetsDisclosureTextBlock |
| Namespace Prefix: |
us-gaap_ |
| Data Type: |
dtr-types:textBlockItemType |
| Balance Type: |
na |
| Period Type: |
duration |
|
v3.23.2
Related Party Transactions
|
6 Months Ended |
Jul. 31, 2023 |
|---|
| Related Party Transactions [Abstract] |
|
| Related Party Transactions |
Note
6 – Related Party Transactions
Promissory
Note – Related Party
Upon
consummation of the acquisition of T&L and Olive Branch on December 29, 2021, the Company executed a $3,000,000 promissory note with
the sellers. The promissory note requires annual principal payments of $750,000 payable on each anniversary of the closing, together
with accrued interest at a rate of three and one-half (3.5%) per annum. As of July 31, 2023 and January 31, 2023, the outstanding balance
under the note was $2,250,000, respectively, of which $750,000 is recorded as Promissory notes – related parties and $1,500,000
is recorded as Promissory notes – related parties, net of current in the Company’s Condensed Consolidated Balance Sheets.
For the three and six months ended July 31, 2023 interest expense for this note was $20,137 and $39,451 respectively. For the three and
six months ended July 31, 2022 interest expense for this note was $27,237 and $53,356 respectively. As of July 31, 2023 and January 31,
2023, accrued interest was $46,140 and $6,688, respectively.
As
part of the purchase price of the remaining interest in CIF, the Company agreed to pay $600,000
to each Seller in cash by bank check(s) or wire transfer(s), without interest, on the first anniversary of the closing date and
$750,000
shall be paid by the Company to each seller in common stock of the Company, without interest, on the second anniversary of the
Closing Date. As of July 31, 2023 $1,200,000
is recorded as Promissory notes – related parties and $1,500,000
is recorded as Promissory notes – related parties, net of current in the Company’s Condensed Consolidated Balance
Sheet.
Lease
– Related Party
The
Company leases a fully contained facility in Farmingdale, NY from 148 Allen Blvd LLC for production and distribution of T&L
Creative Salads and Olive Branch products. 148 Allen Blvd LLC is owned by Anthony Morello, Jr., President of T&L and various
individuals related to Mr. Morello. This lease term is through November
30, 2031 with the
option to extend the lease for two additional ten-year terms with base rent of $20,200
per month through December 31, 2026, increasing after that date to $23,567
through the end of the initial lease term. The exercise of optional renewal is uncertain and therefore excluded from the calculation
of the right of use asset. Rent expense and other ancillary charges pursuant to the lease for the three and six months ended July
31, 2023 was $105,691
and $171,299,
respectively. Rent expense and other ancillary charges pursuant to the lease for the three and six months ended July 31, 2022 was
$65,608 and $131,216, respectively.
Chef
Inspirational Foods, LLC – Related Party
As
noted above in Note 1, the Company owned a 24% minority interest in CIF (until June 28, 2023). For the period from May 1, 2023 to June
28,2023 and the period from February 1, 2023 to June 28, 2023, the Company recorded sales of $4,349,203 and $10,889,277 with CIF. As
of January 31, 2023, the Company had an account receivable balance with CIF of $1,449,009. On June 28, 2023 the Company acquired the
remaining interest in CIF (refer to Note 1 and 4).
|
| X |
- DefinitionThe entire disclosure for related party transactions. Examples of related party transactions include transactions between (a) a parent company and its subsidiary; (b) subsidiaries of a common parent; (c) and entity and its principal owners; and (d) affiliates. Reference 1: http://www.xbrl.org/2003/role/disclosureRef
-Topic 946
-SubTopic 20
-Name Accounting Standards Codification
-Section 50
-Paragraph 2
-Publisher FASB
-URI https://asc.fasb.org//1943274/2147480990/946-20-50-2
Reference 2: http://www.xbrl.org/2003/role/disclosureRef
-Topic 946
-SubTopic 20
-Name Accounting Standards Codification
-Section 50
-Paragraph 5
-Publisher FASB
-URI https://asc.fasb.org//1943274/2147480990/946-20-50-5
Reference 3: http://www.xbrl.org/2003/role/disclosureRef
-Topic 946
-SubTopic 20
-Name Accounting Standards Codification
-Section 50
-Paragraph 6
-Publisher FASB
-URI https://asc.fasb.org//1943274/2147480990/946-20-50-6
Reference 4: http://www.xbrl.org/2003/role/disclosureRef
-Topic 946
-SubTopic 235
-Name Accounting Standards Codification
-Section 50
-Paragraph 2
-Subparagraph (c)
-Publisher FASB
-URI https://asc.fasb.org//1943274/2147481062/946-235-50-2
Reference 5: http://www.xbrl.org/2003/role/disclosureRef
-Topic 946
-SubTopic 235
-Name Accounting Standards Codification
-Section 50
-Paragraph 2
-Subparagraph (e)
-Publisher FASB
-URI https://asc.fasb.org//1943274/2147481062/946-235-50-2
Reference 6: http://www.xbrl.org/2003/role/disclosureRef
-Topic 850
-SubTopic 10
-Name Accounting Standards Codification
-Section 50
-Paragraph 1
-Subparagraph (d)
-Publisher FASB
-URI https://asc.fasb.org//1943274/2147483326/850-10-50-1
Reference 7: http://www.xbrl.org/2003/role/disclosureRef
-Topic 946
-SubTopic 220
-Name Accounting Standards Codification
-Section S99
-Paragraph 1
-Subparagraph (SX 210.6-07(2)(g)(3))
-Publisher FASB
-URI https://asc.fasb.org//1943274/2147483575/946-220-S99-1
Reference 8: http://www.xbrl.org/2003/role/disclosureRef
-Topic 946
-SubTopic 220
-Name Accounting Standards Codification
-Section S99
-Paragraph 1
-Subparagraph (SX 210.6-07(2)(c))
-Publisher FASB
-URI https://asc.fasb.org//1943274/2147483575/946-220-S99-1
Reference 9: http://www.xbrl.org/2003/role/disclosureRef
-Topic 946
-SubTopic 220
-Name Accounting Standards Codification
-Section S99
-Paragraph 1
-Subparagraph (SX 210.6-07(2)(e))
-Publisher FASB
-URI https://asc.fasb.org//1943274/2147483575/946-220-S99-1
Reference 10: http://www.xbrl.org/2003/role/disclosureRef
-Topic 850
-Name Accounting Standards Codification
-Publisher FASB
-URI https://asc.fasb.org//850/tableOfContent
Reference 11: http://www.xbrl.org/2003/role/disclosureRef
-Topic 850
-SubTopic 10
-Name Accounting Standards Codification
-Section 50
-Paragraph 6
-Publisher FASB
-URI https://asc.fasb.org//1943274/2147483326/850-10-50-6
Reference 12: http://www.xbrl.org/2003/role/disclosureRef
-Topic 850
-SubTopic 10
-Name Accounting Standards Codification
-Section 50
-Paragraph 1
-Subparagraph (a)
-Publisher FASB
-URI https://asc.fasb.org//1943274/2147483326/850-10-50-1
Reference 13: http://www.xbrl.org/2003/role/disclosureRef
-Topic 850
-SubTopic 10
-Name Accounting Standards Codification
-Section 50
-Paragraph 1
-Subparagraph (b)
-Publisher FASB
-URI https://asc.fasb.org//1943274/2147483326/850-10-50-1
| Name: |
us-gaap_RelatedPartyTransactionsDisclosureTextBlock |
| Namespace Prefix: |
us-gaap_ |
| Data Type: |
dtr-types:textBlockItemType |
| Balance Type: |
na |
| Period Type: |
duration |
|
v3.23.2
Loan and Security Agreements
|
6 Months Ended |
Jul. 31, 2023 |
|---|
| Loan And Security Agreements |
|
| Loan and Security Agreements |
Note
7 – Loan and Security Agreements
M&T
Bank
The
Company has a working capital line with M&T Bank (the “Credit Agreement”) with total available borrowings of $5.5 million.
On July 18, 2023 the Company extended the maturity of the working capital line from June 30, 2024 to October 31, 2025. Interest is payable
on the unpaid principal amount of the Loan at a variable rate per annum based on the Company’s Senior Funded Debt/EBITDA Ratio
(as defined in the Credit Agreement) as of the date of any advance under the Credit Agreement as follows: if the Senior Funded Debt/EBITDA
ratio is: (i) greater than 2.25, 3.87 percentage point(s) above one-day (i.e., overnight) SOFR (as defined); (ii) greater than 1.50 but
less than or equal to 2.25, 3.37 percentage points above one-day SOFR; or (iii) 1.50 or less, 2.87 percentage points above one-day SOFR.
In all events set forth at subsections (i) through (iii) in the preceding sentence, if SOFR shall at any time be less than 0.25%, one-day
SOFR shall be deemed to be 0.25% and the foregoing margins shall be applied to the SOFR Index Floor. The Credit Agreement is secured
by a first priority security interest in all of the Company’s business assets and is further subject to various affirmative and
negative financial covenants. The Company was in compliance with the covenants as of July 31, 2023 and January 31, 2023. Advances under
the line of credit are limited to eighty percent (80%) of eligible accounts receivable (which is subject to an agreed limitation and
is further subject to certain asset concentration provisions) and fifty percent (50%) of eligible inventory (which is subject to an agreed
dollar limitation). All advances under the line of credit are due upon maturity. The outstanding balance on the line of credit was $500,000
and $890,000 as of July 31, 2023 and January 31, 2023, respectively. During the three months ended July 31, 2023 and 2022, the Company
incurred interest of $26,244 and $32,943, respectively, pursuant to borrowings under the Credit Agreement. During the six months ended
July 31, 2023 and 2022, the Company incurred interest of $46,776 and $49,053, respectively, pursuant to borrowings under the Credit Agreement.
On
December 29, 2021, the Company entered into a Multiple Disbursement Term Loan with M&T Bank, which was amended and restated on October
26, 2022, for the original principal amount of $7,500,000 payable in equal monthly principal installments over a 60-month amortization
period (the “Term Loan Agreement”). The maturity date of the Term Loan Agreement is January 17, 2027. Interest is payable
on the unpaid principal under the Term Loan Agreement at a variable rate per annum based on the Company’s Senior Funded Debt/EBITDA
Ratio (as defined in the Term Loan Agreement) as of the date of any advance under the Term Loan Agreement as follows: if the Senior Funded
Debt/EBITDA ratio is: (i) greater than 2.25, 4.12 percentage point(s) above the Variable Loan Rate (as defined in the agreement); (ii)
greater than 1.50 but less than or equal to 2.25, 3.62 percentage points above Variable Loan Rate; or (iii) less than or equal to 1.50,
3.12 percentage points above applicable Variable Loan Rate. In all events set forth at subsections (i) through (iii) in the preceding
sentence, if SOFR shall at any time be less than 0.25%, one-day SOFR shall be deemed to be 0.00% and the foregoing margins shall be applied
to the Variable Loan Rates. All disbursements available under the Term Loan Agreement have been previously made. As of July 31, 2023,
the outstanding balance and unamortized discount of the Term Loan Agreement was $5,431,042 and $49,022, respectively. As of January 31,
2023, the outstanding balance and unamortized discount of the Acquisition Note was $6,206,905 and $60,082, respectively. During the three
and six months ended July 31, 2023, the Company incurred interest of $117,606 and $237,315 for the Acquisition Note, respectively. During
the three and six months ended July 31, 2022, the Company incurred interest of $73,484 and $148,606 for the Acquisition Note, respectively.
|
| X |
- References
+ Details
| Name: |
MAMA_DisclosureLoanAndSecurityAgreementsAbstract |
| Namespace Prefix: |
MAMA_ |
| Data Type: |
xbrli:stringItemType |
| Balance Type: |
na |
| Period Type: |
duration |
|
| X |
- DefinitionLoan and Security Agreement Disclosure [Text Block]
| Name: |
MAMA_LoanAndSecurityAgreementDisclosureTextBlock |
| Namespace Prefix: |
MAMA_ |
| Data Type: |
dtr-types:textBlockItemType |
| Balance Type: |
na |
| Period Type: |
duration |
|
v3.23.2
Concentrations
|
6 Months Ended |
Jul. 31, 2023 |
|---|
| Risks and Uncertainties [Abstract] |
|
| Concentrations |
Note
8 – Concentrations
Revenues
For
the six months ended July 31, 2023, the Company’s revenue was concentrated in three customers that accounted for approximately
22%, 13%, and 11% of gross revenue, respectively. For the six months ended July 31, 2022, the Company’s revenue was concentrated
in three customers that accounted for approximately 24%, 13%, and 12% respectively, of gross revenue.
For
the three months ended July 31, 2023, the Company’s revenue was concentrated in three customers that accounted for approximately
18%, 17%, and 10% of gross revenue, respectively. For the three months ended July 31, 2022, the Company’s revenue was concentrated
in three customers that accounted for approximately 23%, 14%, and 12% respectively, of gross revenue.
Receivables
As
of July 31, 2023 one customer represented approximately 40% of the total gross outstanding receivables. As of January 31, 2023, three
customers represented approximately 20%, 15% and 11%, totaling 46%, of total gross outstanding receivables, respectively.
|
| X |
- DefinitionThe entire disclosure for any concentrations existing at the date of the financial statements that make an entity vulnerable to a reasonably possible, near-term, severe impact. This disclosure informs financial statement users about the general nature of the risk associated with the concentration, and may indicate the percentage of concentration risk as of the balance sheet date. Reference 1: http://fasb.org/us-gaap/role/ref/legacyRef
-Topic 275
-Name Accounting Standards Codification
-Publisher FASB
-URI https://asc.fasb.org//275/tableOfContent
| Name: |
us-gaap_ConcentrationRiskDisclosureTextBlock |
| Namespace Prefix: |
us-gaap_ |
| Data Type: |
dtr-types:textBlockItemType |
| Balance Type: |
na |
| Period Type: |
duration |
|
| X |
- References
+ Details
| Name: |
us-gaap_RisksAndUncertaintiesAbstract |
| Namespace Prefix: |
us-gaap_ |
| Data Type: |
xbrli:stringItemType |
| Balance Type: |
na |
| Period Type: |
duration |
|
v3.23.2
Stockholders’ Equity
|
6 Months Ended |
Jul. 31, 2023 |
|---|
| Equity [Abstract] |
|
| Stockholders’ Equity |
Note
9 – Stockholders’ Equity
Preferred
Stock and Series A Preferred Stock
The
Company is authorized to issue 20,000,000 shares of Preferred Stock, $0.00001 par value per share. The Company has designated 120,000
shares of Preferred Stock as Series A Convertible Preferred stock. As of July 31, 2023 and January 31, 2023, no shares of Series A Convertible
Preferred Stock are issued and outstanding. The Company has designated 200,000 shares of preferred stock, Series B Preferred Stock.
Series
B Preferred Stock
The
holders of the Series B Preferred Stock shall be entitled to receive, upon liquidation, dissolution or winding up of the Company, the
original issue price, plus any dividends declared but unpaid or the amount of cash, securities or other property to which such holder
would be entitled to receive with respect to such shares of Series B Preferred Stock if such shares had been converted to common stock
immediately prior to such liquidation.
Holders
of the Series B Preferred Stock were entitled to receive cumulative cash dividends at an annual rate of eight percent (8%). Holders of
the Series B Preferred Stock had no voting rights. Each share of Series B Preferred Stock was convertible, at the option of the holder,
into shares of common stock at a rate of 1 share of Series B Preferred Stock into 15 shares of common stock. The Company was able to
force conversion at $2.00 per share of Common Stock at any time after six (6) months after issue if the Common Stock has a closing price
of $2.00 or higher in any 20 consecutive trading days. After 18 months, the Company could force holders to convert at a 20% discount
to the most recent 20-day average closing price per share. The Company also has the right to cause a conversion following a Fundamental
Change.
On
September 13, 2022, the Company closed the first round of the Series B Preferred Stock offering with the sale of 47,200 shares, raising
gross proceeds of $1,180,000. On November 17, 2022, the company held a final closing of its offering of Series B Preferred Stock, wherein
it sold an additional 7,400 shares of Series B. Preferred Stock for gross proceeds of $185,000
As
of January 31, 2023 there were 54,600 shares of Series B Preferred Stock outstanding. On June 22, 2023, all the holders of the Series
B Preferred Stock converted the shares of Series B Preferred Stock into 819,000 shares of Common Stock of the Company. As of July 31,
2023, no shares of Series B Preferred Stock remain outstanding.
During
the three months ended July 31, 2023 and 2022, the Company paid dividends of $21,233 and $0, respectively.
During
the six months ended July 31, 2023 and 2022, the Company paid dividends of $48,533 and $0 respectively.
Restricted
Stock Units
During
the six months ended July 31, 2023, the Company awarded 39,733 restricted stock units (“RSUs”) to certain employees with
an aggregate grant date fair value of $70,000. The RSUs will be expensed over the requisite service period. The terms of the RSUs include
vesting provisions based solely on continued service. If the service criteria is satisfied, the RSUs will vest in equal installments
over a three-year period.
The
following is a summary of the Company’s restricted stock units activity:
Schedule
of Restricted Stock Option Activity
| | |
Restricted Stock Units | | |
Weighted Average Exercise Price | |
| Unvested – February 1, 2023 | |
| 367,647 | | |
$ | 1.36 | |
| Granted | |
| 39,773 | | |
$ | 1.76 | |
| Vested | |
| - | | |
$ | - | |
| Forfeited | |
| - | | |
$ | - | |
| Outstanding – July 31, 2023 | |
| 407,420 | | |
$ | 1.40 | |
During
the three and six months ended July 31, 2023, the Company
recognized stock-based compensation related to restricted stock units of an aggregate of $37,083 and $69,612, respectively, which was
recorded to selling, general and administrative expense on the Condensed Consolidated Statement of Operations, and
there was unrecognized stock-based compensation of $449,960 as of July 31, 2023 related
to future vesting of restricted stock units.
Options
The
following is a summary of the Company’s option activity:
Summary
of Option Activity
| | |
Options | | |
Weighted Average Exercise Price | | |
Weighted Average Remaining Contractual Life (in years) | | |
Aggregate Intrinsic Value | |
| Outstanding – February 1, 2023 | |
| 689,000 | | |
$ | 0.77 | | |
| 2.95 | | |
$ | 544,760 | |
| Granted | |
| - | | |
$ | - | | |
| | | |
| | |
| Exercised | |
| 206,000 | | |
$ | 0.40 | | |
| | | |
| | |
| Expired/forfeited | |
| - | | |
| - | | |
| | | |
| | |
| Outstanding – July 31, 2023 | |
| 483,000 | | |
$ | 0.92 | | |
| 2.68 | | |
$ | 1,347,410 | |
| Exercisable – July 31, 2023 | |
| 370,500 | | |
$ | 0.75 | | |
| 1.55 | | |
$ | 1,096,535 | |
During
the three months ended July 31, 2023, there were 6,000 options exercised at a weighted average exercise price of $1.38 per share and
resulted in the issuance of 6,000 shares of common stock. The Company received $8,280 for the exercise of these options.
During
the six months ended July 31, 2023, there were 206,000 options exercised at a weighted average exercise price of $0.40 per share and
resulted in the issuance of 172,920 shares of common stock. The Company received $27,780 for the exercise of these options, as a portion
of the options were cashless exercised.
For
the six months ended July 31, 2023 and 2022, the Company recognized stock-based compensation related to options of an aggregate of $40,561
and $12,333, respectively, which is included in selling, general and administrative expenses on the accompanying consolidated statements
of operations. At July 31, 2023, there was unrecognized stock-based compensation related to the issuance of options of $79,928.
Warrants
The
following is a summary of the Company’s warrant activity:
Schedule
of Warrants Activity
| | |
Warrants | | |
Weighted Average Exercise Price | |
| Outstanding – February 1, 2023 | |
| 13,650 | | |
$ | 2.25 | |
| Exercisable – February 1, 2023 | |
| 13,650 | | |
$ | 2.25 | |
| Granted | |
| - | | |
$ | | |
| Exercised | |
| 13,650 | | |
$ | - | |
| Outstanding – July 31, 2023 | |
| - | | |
$ | - | |
| Exercisable – July 31, 2023 | |
| - | | |
$ | - | |
During
the three months ended July 31, 2023, the Company issued 13,650 shares of common stock upon the cashless exercise of the warrants.
|
| X |
- References
+ Details
| Name: |
us-gaap_EquityAbstract |
| Namespace Prefix: |
us-gaap_ |
| Data Type: |
xbrli:stringItemType |
| Balance Type: |
na |
| Period Type: |
duration |
|
| X |
- DefinitionThe entire disclosure for equity. Reference 1: http://www.xbrl.org/2003/role/disclosureRef
-Topic 505
-SubTopic 10
-Name Accounting Standards Codification
-Section 50
-Paragraph 13
-Subparagraph (b)
-Publisher FASB
-URI https://asc.fasb.org//1943274/2147481112/505-10-50-13
Reference 2: http://www.xbrl.org/2003/role/disclosureRef
-Topic 505
-SubTopic 10
-Name Accounting Standards Codification
-Section 50
-Paragraph 13
-Subparagraph (h)
-Publisher FASB
-URI https://asc.fasb.org//1943274/2147481112/505-10-50-13
Reference 3: http://www.xbrl.org/2003/role/disclosureRef
-Topic 505
-SubTopic 10
-Name Accounting Standards Codification
-Section 50
-Paragraph 14
-Subparagraph (b)
-Publisher FASB
-URI https://asc.fasb.org//1943274/2147481112/505-10-50-14
Reference 4: http://www.xbrl.org/2003/role/disclosureRef
-Topic 946
-SubTopic 235
-Name Accounting Standards Codification
-Section 50
-Paragraph 2
-Subparagraph (a)
-Publisher FASB
-URI https://asc.fasb.org//1943274/2147481062/946-235-50-2
Reference 5: http://www.xbrl.org/2003/role/disclosureRef
-Topic 946
-SubTopic 235
-Name Accounting Standards Codification
-Section 50
-Paragraph 2
-Subparagraph (d)
-Publisher FASB
-URI https://asc.fasb.org//1943274/2147481062/946-235-50-2
Reference 6: http://www.xbrl.org/2003/role/disclosureRef
-Topic 946
-SubTopic 505
-Name Accounting Standards Codification
-Section 50
-Paragraph 6
-Publisher FASB
-URI https://asc.fasb.org//1943274/2147481004/946-505-50-6
Reference 7: http://www.xbrl.org/2003/role/disclosureRef
-Topic 815
-SubTopic 40
-Name Accounting Standards Codification
-Section 50
-Paragraph 6
-Subparagraph (a)
-Publisher FASB
-URI https://asc.fasb.org//1943274/2147480237/815-40-50-6
Reference 8: http://www.xbrl.org/2003/role/disclosureRef
-Topic 505
-SubTopic 10
-Name Accounting Standards Codification
-Section S99
-Paragraph 1
-Subparagraph (SX 210.3-04)
-Publisher FASB
-URI https://asc.fasb.org//1943274/2147480008/505-10-S99-1
Reference 9: http://www.xbrl.org/2003/role/disclosureRef
-Topic 235
-SubTopic 10
-Name Accounting Standards Codification
-Section S99
-Paragraph 1
-Subparagraph (SX 210.4-08(e)(1))
-Publisher FASB
-URI https://asc.fasb.org//1943274/2147480678/235-10-S99-1
Reference 10: http://fasb.org/us-gaap/role/ref/legacyRef
-Topic 505
-Name Accounting Standards Codification
-Publisher FASB
-URI https://asc.fasb.org//505/tableOfContent
Reference 11: http://www.xbrl.org/2003/role/disclosureRef
-Topic 505
-SubTopic 10
-Name Accounting Standards Codification
-Section 50
-Paragraph 13
-Publisher FASB
-URI https://asc.fasb.org//1943274/2147481112/505-10-50-13
Reference 12: http://www.xbrl.org/2003/role/disclosureRef
-Topic 505
-SubTopic 10
-Name Accounting Standards Codification
-Section 50
-Paragraph 13
-Subparagraph (g)
-Publisher FASB
-URI https://asc.fasb.org//1943274/2147481112/505-10-50-13
Reference 13: http://www.xbrl.org/2003/role/disclosureRef
-Topic 505
-SubTopic 10
-Name Accounting Standards Codification
-Section 50
-Paragraph 13
-Subparagraph (i)
-Publisher FASB
-URI https://asc.fasb.org//1943274/2147481112/505-10-50-13
Reference 14: http://www.xbrl.org/2003/role/disclosureRef
-Topic 505
-SubTopic 10
-Name Accounting Standards Codification
-Section 50
-Paragraph 14
-Subparagraph (a)
-Publisher FASB
-URI https://asc.fasb.org//1943274/2147481112/505-10-50-14
Reference 15: http://www.xbrl.org/2003/role/disclosureRef
-Topic 505
-SubTopic 10
-Name Accounting Standards Codification
-Section 50
-Paragraph 14
-Subparagraph (c)
-Publisher FASB
-URI https://asc.fasb.org//1943274/2147481112/505-10-50-14
Reference 16: http://www.xbrl.org/2003/role/disclosureRef
-Topic 505
-SubTopic 10
-Name Accounting Standards Codification
-Section 50
-Paragraph 16
-Subparagraph (b)
-Publisher FASB
-URI https://asc.fasb.org//1943274/2147481112/505-10-50-16
Reference 17: http://www.xbrl.org/2003/role/disclosureRef
-Topic 505
-SubTopic 10
-Name Accounting Standards Codification
-Section 50
-Paragraph 18
-Subparagraph (a)
-Publisher FASB
-URI https://asc.fasb.org//1943274/2147481112/505-10-50-18
Reference 18: http://www.xbrl.org/2003/role/disclosureRef
-Topic 505
-SubTopic 10
-Name Accounting Standards Codification
-Section 50
-Paragraph 18
-Subparagraph (b)
-Publisher FASB
-URI https://asc.fasb.org//1943274/2147481112/505-10-50-18
Reference 19: http://www.xbrl.org/2003/role/disclosureRef
-Topic 505
-SubTopic 10
-Name Accounting Standards Codification
-Section 50
-Paragraph 18
-Subparagraph (d)
-Publisher FASB
-URI https://asc.fasb.org//1943274/2147481112/505-10-50-18
| Name: |
us-gaap_StockholdersEquityNoteDisclosureTextBlock |
| Namespace Prefix: |
us-gaap_ |
| Data Type: |
dtr-types:textBlockItemType |
| Balance Type: |
na |
| Period Type: |
duration |
|
v3.23.2
Commitments and Contingencies
|
6 Months Ended |
Jul. 31, 2023 |
|---|
| Commitments and Contingencies Disclosure [Abstract] |
|
| Commitments and Contingencies |
Note
10 - Commitments and Contingencies
Litigation,
Claims and Assessments
From
time to time, the Company may become involved in various lawsuits and legal proceedings, which arise in the ordinary course of business.
Litigation is subject to inherent uncertainties, and an adverse result in these or other matters may arise from time to time that may
harm its business. The Company is currently not aware of any such legal proceedings or claims that they believe will have, individually
or in the aggregate, a material adverse effect on its business, financial condition or operating results.
Licensing
and Royalty Agreements
On
March 1, 2010, the Company was assigned a Development and License agreement, dated January 1, 2009, with Daniel Dougherty (the “License
Agreement”). Under the terms of the License Agreement the licensor shall exclusively develop for the Company a line of beef meatballs
with sauce, turkey meatballs with sauce and other similar meats and sauces for commercial manufacture, distribution and sale (each a
“Licensor Product” and collectively the “Licensor Products”). Licensor shall work with the Company to develop
Licensor Products that are acceptable to the Company. Upon acceptance of a Licensor Product by Licensee, Licensor’s trade secret
recipes, formulas methods and ingredients for the preparation and production of such Licensor Products (the “Recipes”) shall
be subject to the License Agreement.
The
exclusive term began on January 1, 2009 (the “Effective Date”) and ends on the 50th anniversary of the Effective Date.
The
royalty rate payable by the Company is: 6%
of net sales up to $500,000
of net sales (as defined in the agreement) for each year under the License Agreement; 4%
of net sales from $500,000
up to $2,500,000
of net sales for each year under the License Agreement; 2%
of net sales from $2,500,000
up to $20,000,000
of net sales for each year under the License Agreement; and 1%
of net sales in excess of $20,000,000
of net sales for each year under the License Agreement.
In
order to continue exclusivity, the Company shall pay a minimum royalty of $125,000 each year.
The
Company incurred approximately $129,000 and $125,000 of royalty expenses for the three months ended July 31, 2023 and 2022, respectively.
The Company incurred approximately $318,000 and $275,000 of royalty expenses for the six months ended July 31, 2023 and 2022, respectively.
Royalty expenses are included in selling, general and administrative expenses on the Condensed Consolidated Statements of Operations.
|
| X |
- References
+ Details
| Name: |
us-gaap_CommitmentsAndContingenciesDisclosureAbstract |
| Namespace Prefix: |
us-gaap_ |
| Data Type: |
xbrli:stringItemType |
| Balance Type: |
na |
| Period Type: |
duration |
|
| X |
- DefinitionThe entire disclosure for commitments and contingencies. Reference 1: http://www.xbrl.org/2003/role/disclosureRef
-Topic 440
-SubTopic 10
-Name Accounting Standards Codification
-Section 50
-Paragraph 4
-Subparagraph (a)
-Publisher FASB
-URI https://asc.fasb.org//1943274/2147482648/440-10-50-4
Reference 2: http://www.xbrl.org/2009/role/commonPracticeRef
-Topic 450
-Name Accounting Standards Codification
-Publisher FASB
-URI https://asc.fasb.org//450/tableOfContent
Reference 3: http://www.xbrl.org/2003/role/disclosureRef
-Topic 954
-SubTopic 440
-Name Accounting Standards Codification
-Section 50
-Paragraph 1
-Subparagraph (a)
-Publisher FASB
-URI https://asc.fasb.org//1943274/2147480327/954-440-50-1
Reference 4: http://www.xbrl.org/2003/role/disclosureRef
-Topic 440
-SubTopic 10
-Name Accounting Standards Codification
-Section 50
-Paragraph 4
-Subparagraph (c)
-Publisher FASB
-URI https://asc.fasb.org//1943274/2147482648/440-10-50-4
Reference 5: http://fasb.org/us-gaap/role/ref/legacyRef
-Topic 440
-Name Accounting Standards Codification
-Publisher FASB
-URI https://asc.fasb.org//440/tableOfContent
| Name: |
us-gaap_CommitmentsAndContingenciesDisclosureTextBlock |
| Namespace Prefix: |
us-gaap_ |
| Data Type: |
dtr-types:textBlockItemType |
| Balance Type: |
na |
| Period Type: |
duration |
|
v3.23.2
Leases
|
6 Months Ended |
Jul. 31, 2023 |
|---|
| Leases |
|
| Leases |
Note
11 –Leases
We
account for leases in accordance with ASC 842 “Leases” (“ASC 842”). We determine whether an arrangement is a
lease at inception. This determination generally depends on whether the arrangement conveys the right to control the use of an identified
fixed asset explicitly or implicitly for a period of time in exchange for consideration.
We
have operating leases for offices and other facilities used for our operations. We also have finance leases comprised primarily of machinery
and equipment. Our leases have remaining lease terms of approximately 1 year to 8.25 years.
Supplemental
cash flow and other information related to leases was as follows:
Schedule
of Supplemental Cash Flow and Other Information Related to Leases
| | |
July 31, 2023 | | |
July 31, 2022 | |
| Cash paid for amounts included in the measurement of lease liabilities | |
| | | |
| | |
| Operating cash flows from operating leases | |
$ | (134,862 | ) | |
$ | (176,534 | ) |
| Financing cash flows from finance leases | |
| (92,724 | ) | |
| (130,626 | ) |
The
following table shows the weighted average lease term and weighted average discount rate for our ROU assets:
| | |
July 31, 2023 | | |
January 31, 2023 | |
| Weighted average remaining lease term (in years) | |
| | | |
| | |
| Operating leases | |
| 7.00 | | |
| 7.50 | |
| Finance leases | |
| 4.28 | | |
| 2.60 | |
| | |
| | | |
| | |
| Weighted average discount rate: | |
| | | |
| | |
| Operating leases | |
| 4.85 | % | |
| 4.85 | % |
| Finance Leases | |
| 5.86 | % | |
| 3.41 | % |
Maturities
of lease liabilities for each of the succeeding fiscal years are as follows:
Schedule
of Future Minimum Payments Required Under Maturities of Lease Liabilities
| For the Twelve months ended January 31, | |
| |
| 2024 | |
$ | 486,910 | |
| 2025 | |
| 951,205 | |
| 2026 | |
| 847,464 | |
| 2027 | |
| 691,145 | |
| 2028 | |
| 713,501 | |
| Thereafter | |
| 1,454,059 | |
| Total lease payments | |
$ | 5,144,284 | |
| Less: amounts representing interest | |
| (748,544 | ) |
| Total lease obligations | |
$ | 4,395,740 | |
|
| X |
- References
+ Details
| Name: |
MAMA_DisclosureLeasesAbstract |
| Namespace Prefix: |
MAMA_ |
| Data Type: |
xbrli:stringItemType |
| Balance Type: |
na |
| Period Type: |
duration |
|
| X |
- DefinitionThe entire disclosure for operating leases of lessee. Includes, but is not limited to, description of operating lease and maturity analysis of operating lease liability. Reference 1: http://www.xbrl.org/2003/role/disclosureRef
-Topic 842
-SubTopic 20
-Name Accounting Standards Codification
-Publisher FASB
-URI https://asc.fasb.org//842-20/tableOfContent
| Name: |
us-gaap_LesseeOperatingLeasesTextBlock |
| Namespace Prefix: |
us-gaap_ |
| Data Type: |
dtr-types:textBlockItemType |
| Balance Type: |
na |
| Period Type: |
duration |
|
v3.23.2
Income Tax Provision
|
6 Months Ended |
Jul. 31, 2023 |
|---|
| Income Tax Disclosure [Abstract] |
|
| Income Tax Provision |
Note
12 - Income Tax Provision
The
Company’s effective tax rate for the three and six months ending July 31, 2023 is 19.8% and 23.2%. Differences with statutory rate
primarily relate to state taxes. Deferred tax assets are net operating loss carryforwards and other assets.
Deferred
taxes are caused primarily by net operating loss carryforwards. Net Operating Losses (“NOLs”) generated in 2017 and prior
years can be carried forward for 20 years. NOLs generated in 2018 – 2020, as enacted by the CARES Act, can be carried forward indefinitely.
However, NOLs generated in 2021 are also carried forward indefinitely but limited to 80% of taxable income.
In
assessing the realization of deferred tax assets, management considers whether it is more likely than not that some portion or all of
the deferred tax assets will not be realized. The ultimate realization of deferred tax assets is dependent upon future generation for
taxable income during the periods in which temporary differences representing net future deductible amounts become deductible. Management
considers the scheduled reversal of deferred tax liabilities, projected future taxable income and tax planning strategies in making this
assessment. There was no valuation allowance as of July 31, 2023 or January 31, 2023.
The
Company evaluated the provisions of ASC 740 related to the accounting for uncertainty in income taxes recognized in an enterprise’s
financial statements. ASC 740 prescribes a comprehensive model for how a company should recognize, present, and disclose uncertain positions
that the Company has taken or expects to take in its tax return. For those benefits to be recognized, a tax position must be more-likely-than-not
to be sustained upon examination by taxing authorities. Differences between tax positions taken or expected to be taken in a tax return
and the net benefit recognized and measured pursuant to the interpretation are referred to as “unrecognized benefits.” A
liability is recognized (or amount of net operating loss carry forward or amount of tax refundable is reduced) for unrecognized tax benefit
because it represents an enterprise’s potential future obligation to the taxing authority for a tax position that was not recognized
as a result of applying the provisions of ASC 740.
The
actual yearly tax rate will vary due to numerous factors, such as level and geographic mix of income and losses, acquisitions, investments,
intercompany transactions, our stock price, changes in our deferred tax assets and liabilities and their valuation, changes in the laws,
regulations, administrative practices, principles, and interpretations related to tax, including changes to the global tax framework
and other laws and accounting rules in various jurisdictions.
|
| X |
- DefinitionThe entire disclosure for income taxes. Disclosures may include net deferred tax liability or asset recognized in an enterprise's statement of financial position, net change during the year in the total valuation allowance, approximate tax effect of each type of temporary difference and carryforward that gives rise to a significant portion of deferred tax liabilities and deferred tax assets, utilization of a tax carryback, and tax uncertainties information. Reference 1: http://www.xbrl.org/2003/role/disclosureRef
-Topic 946
-SubTopic 20
-Name Accounting Standards Codification
-Section 50
-Paragraph 13
-Publisher FASB
-URI https://asc.fasb.org//1943274/2147480990/946-20-50-13
Reference 2: http://www.xbrl.org/2003/role/disclosureRef
-Topic 235
-SubTopic 10
-Name Accounting Standards Codification
-Section S99
-Paragraph 1
-Subparagraph (SX 210.4-08(h)(2))
-Publisher FASB
-URI https://asc.fasb.org//1943274/2147480678/235-10-S99-1
Reference 3: http://www.xbrl.org/2003/role/disclosureRef
-Topic 740
-Name Accounting Standards Codification
-Publisher FASB
-URI https://asc.fasb.org//740/tableOfContent
Reference 4: http://www.xbrl.org/2003/role/disclosureRef
-Topic 740
-SubTopic 10
-Name Accounting Standards Codification
-Section 50
-Paragraph 14
-Publisher FASB
-URI https://asc.fasb.org//1943274/2147482685/740-10-50-14
Reference 5: http://www.xbrl.org/2003/role/disclosureRef
-Topic 740
-SubTopic 10
-Name Accounting Standards Codification
-Section 50
-Paragraph 21
-Publisher FASB
-URI https://asc.fasb.org//1943274/2147482685/740-10-50-21
Reference 6: http://www.xbrl.org/2003/role/disclosureRef
-Topic 740
-SubTopic 270
-Name Accounting Standards Codification
-Section 50
-Paragraph 1
-Publisher FASB
-URI https://asc.fasb.org//1943274/2147482526/740-270-50-1
Reference 7: http://www.xbrl.org/2003/role/disclosureRef
-Topic 740
-SubTopic 10
-Name Accounting Standards Codification
-Section 50
-Paragraph 17
-Subparagraph (b)
-Publisher FASB
-URI https://asc.fasb.org//1943274/2147482685/740-10-50-17
Reference 8: http://www.xbrl.org/2003/role/disclosureRef
-Topic 740
-SubTopic 10
-Name Accounting Standards Codification
-Section S99
-Paragraph 1
-Subparagraph (SAB TOPIC 6.I.5.Q1)
-Publisher FASB
-URI https://asc.fasb.org//1943274/2147479360/740-10-S99-1
Reference 9: http://www.xbrl.org/2003/role/disclosureRef
-Topic 740
-SubTopic 10
-Name Accounting Standards Codification
-Section S99
-Paragraph 2
-Subparagraph (SAB Topic 11.C)
-Publisher FASB
-URI https://asc.fasb.org//1943274/2147479360/740-10-S99-2
Reference 10: http://www.xbrl.org/2003/role/disclosureRef
-Topic 740
-SubTopic 30
-Name Accounting Standards Codification
-Section 50
-Paragraph 2
-Subparagraph (a)
-Publisher FASB
-URI https://asc.fasb.org//1943274/2147482603/740-30-50-2
| Name: |
us-gaap_IncomeTaxDisclosureTextBlock |
| Namespace Prefix: |
us-gaap_ |
| Data Type: |
dtr-types:textBlockItemType |
| Balance Type: |
na |
| Period Type: |
duration |
|
v3.23.2
Summary of Significant Accounting Policies (Policies)
|
6 Months Ended |
Jul. 31, 2023 |
|---|
| Accounting Policies [Abstract] |
|
| Basis of Presentation |
Basis
of Presentation
The
accompanying unaudited Condensed Consolidated Financial Statements have been prepared in accordance with accounting principles generally
accepted in the United States of America (“U.S. GAAP”) for interim financial information and with the instructions to Form
10-Q and Article 8 of Regulation S-X of the SEC for interim financial information. Accordingly, they do not include all of the information
and footnotes required by generally accepted accounting principles for complete financial statements. In the opinion of management, the
accompanying Condensed Consolidated Financial Statements of the Company and its subsidiaries, which are unaudited, include all normal
and recurring adjustments considered necessary to present fairly the Company’s financial position as of July 31, 2023, and the
results of its operations and its cash flows for the periods presented. The unaudited Condensed Consolidated Financial Statements herein
should be read together with the historical consolidated financial statements of the Company for the years ended January 31, 2023 and
2022 included in our 2023 Form 10-K. Operating results for the three and six months ended July 31, 2023 are not necessarily indicative
of the results that may be expected for the year ending January 31, 2024.
|
| Principles of Consolidation |
Principles
of Consolidation
The
Condensed Consolidated Financial Statements include the accounts of the Company and its wholly owned subsidiaries. All intercompany balances
have been eliminated in consolidation.
|
| Use of Estimates |
Use
of Estimates
The
preparation of Condensed Consolidated Financial Statements in accordance with U.S. GAAP requires management to make estimates and assumptions
that affect the amounts reported in the Condensed Consolidated Financial Statements and accompanying notes. The Company bases its estimates
on historical experience and other assumptions believed to be reasonable under the circumstances, the results of which form the basis
for making judgments about the carrying value of assets and liabilities that are not readily apparent from other sources. Such estimates
and assumptions impact, among others, the following: allowance for doubtful accounts, the fair value of stock-based payments, valuation
of the acquisition of the remaining interest of CIF (which was accounted for as an asset acquisition as substantially all of the fair
value is concentrated in customer relationships), inventory reserves, and estimates for unrealized returns, discounts, and other allowances
that are netted against revenue.
Making
estimates requires management to exercise significant judgment. It is at least reasonably possible that the estimate of the effect of
a condition, situation or set of circumstances that existed at the date of the Condensed Consolidated Financial Statements, which management
considered in formulating its estimate could change in the near term due to one or more future confirming events. Accordingly, the actual
results could differ significantly from our estimates.
|
| Risks and Uncertainties |
Risks
and Uncertainties
The
Company operates in an industry that is subject to intense competition and changes in consumer demand. The Company’s operations
are subject to significant risk and uncertainties including financial and operational risks including the potential risk of business
failure.
The
Company has experienced, and in the future expects to continue to experience variability in sales and earnings. The factors expected
to contribute to this variability include, among others, (i) the cyclical nature of the grocery industry, (ii) general economic conditions
in the various local markets in which the Company competes, including a potential general downturn in the economy, and (iii) the volatility
of prices pertaining to food and beverages in connection with the Company’s distribution of the product. These factors, among others,
make it difficult to project the Company’s operating results on a consistent basis.
|
| Cash |
Cash
The
Company considers all highly liquid instruments purchased with a maturity of three months or less to be cash equivalents. The Company
held no cash equivalents at July 31, 2023 and January 31, 2023.
The
Company minimizes its credit risk associated with cash by periodically evaluating the credit quality of its primary financial institution.
The balance at times may exceed federally insured limits.
|
| Accounts Receivable and Allowance for Doubtful Accounts |
Accounts
Receivable and Allowance for Doubtful Accounts
Accounts
receivable are stated at the amount management expects to collect from outstanding balances. The Company generally does not require collateral
to support customer receivables. The Company provides an allowance for doubtful accounts based upon a review of the outstanding accounts
receivable, historical collection information and existing economic conditions. The Company determines if receivables are past due based
on days outstanding, and amounts are written off when determined to be uncollectible by management. As of July 31, 2023 and January 31,
2023, the reserve for uncollectible accounts was approximately $93,000 and $233,000, respectively. During the three and six months ended
July 31, 2023 the Company wrote off approximately $140,000 accounts that were deemed to be uncollectible.
|
| Inventories |
Inventories
The
Company values its inventory at the lower of cost or net realizable value (“NRV”) and include direct material, direct labor,
warehousing, and overhead costs. NRV is defined as the estimated selling prices less the costs of completion, disposal, and transportation.
The cost of inventory is determined on the first-in, first-out basis. Inventories have been reduced by an allowance for excess, obsolete
and unsaleable inventories. The allowance is an estimate based on management’s review of inventories on hand compared to estimated
future usage and sales. The reserve for obsolescence as of July 31, 2023 and January 31, 2023 was approximately $126,000 and $32,000,
respectively.
Inventories
by major category are as follows:
Schedule of Inventories
| | |
July
31, 2023 | | |
January 31, 2023 | |
| Raw materials and packaging | |
$ | 1,495,179 | | |
$ | 1,883,270 | |
| Work in process | |
| 200,437 | | |
| 98,910 | |
| Finished goods | |
| 1,612,897 | | |
| 1,653,701 | |
| Total | |
$ | 3,308,513 | | |
$ | 3,635,881 | |
|
| Property, Plant and Equipment |
Property,
Plant and Equipment
Property,
plant, and equipment are recorded at cost net of depreciation. Depreciation expense is computed using straight-line methods over the
estimated useful lives.
Asset
lives for financial statement reporting of depreciation are:
Schedule
of Property and Equipment Estimated Useful Lives
| Machinery and equipment | |
| 2-7 years | |
| Furniture and fixtures | |
| 3-5 years | |
| Leasehold improvements | |
| -* | |
| (*) |
Amortized
on a straight-line basis over the remaining lease term at the time the asset was placed in service, whichever period is shorter. |
Upon
sale or retirement of property and equipment, the related cost and accumulated depreciation are removed from the accounts and any gain
or loss is reflected in the consolidated statements of operations.
|
| Goodwill and Other Intangible Assets |
Goodwill
and Other Intangible Assets
Goodwill
Goodwill represents the excess of the purchase price over the fair values
of the underlying net assets of an acquired business. The Company tests goodwill for impairment on an annual basis during the fourth quarter
of its fiscal year, or immediately if conditions indicate that such impairment could exist. The Company evaluates qualitative factors
to determine if it is more likely than not that the fair value is less than its carrying value and whether it is necessary to perform
goodwill impairment process.
As
of July 31, 2023 and January 31, 2023, there were no impairment losses recognized for goodwill.
Other
Intangible Assets
Other
intangible assets consist of trademarks, trade names and customer relationships. Intangible asset lives for financial statement reporting
of amortization are:
Schedule
of Other Intangible Assets Impairment Losses Recognized for Goodwill
| Tradenames and trademarks | |
| 3 years | |
| Customer relationships | |
| 4 – 5 years | |
|
| Fair Value of Financial Instruments |
Fair
Value of Financial Instruments
For
purpose of this disclosure, the fair value of a financial instrument is the amount at which the instrument could be exchanged in a current
transaction between willing parties, other than in a forced sale or liquidation. The carrying amount of the Company’s short-term
financial instruments approximates fair value due to the relatively short period to maturity for these instruments.
|
| Research and Development |
Research
and Development
Research
and development is expensed as incurred. Research and development expenses for the three months ended July 31, 2023 and 2022 were $94,871
and $41,792, respectively. Research and development expenses for the six months ended July 31, 2023 and 2022 were $166,056 and $68,327,
respectively.
|
| Revenue Recognition |
Revenue
Recognition
The
Company recognizes revenue in accordance with FASB Topic 606, Revenue from Contracts with Customers (Topic 606).
The
Company’s sales are generated from the sale of finished products to customers, which contains a single performance obligation and
revenue is recognized at a single point in time when ownership, risks and rewards transfer. Typically, this occurs when the goods are
received and accepted by the customer. Revenues are recognized in an amount that reflects the net consideration the Company expects to
receive in exchange for the goods. The Company reports all amounts billed to a customer in a sale transaction as revenue. The Company
elected to treat shipping and handling activities as fulfillment activities, and the related costs are recorded as selling expenses in
selling, general and administrative expenses on the condensed consolidated statements of operations.
The
Company promotes its products with consumer incentives and trade promotions. These programs include discounts, slotting fees, coupons,
rebates, in-store display incentives and volume-based incentives. Customer trade promotion and consumer incentive activities are recorded
as a reduction to the transaction price based on amounts estimated as being due to customers and consumers at the end of a period. The
Company derives these estimates principally on historical utilization and redemption rates. The Company does not receive a distinct service
in relation to the consumer incentives and trade promotions and as a result, these incentives and promotions are accounted for as a reduction
of the transaction price.
Payment
terms in the Company’s invoices are based on the billing schedule established in contracts and purchase orders with customers.
The Company recognizes the related trade receivable when the goods are received by the customer.
Expenses
such as slotting fees, sales discounts, and allowances are accounted for as a direct reduction of revenues as follows:
Schedule
of Expenses of Slotting Fees, Sales Discounts and Allowances are Accounted as Direct Reduction of Revenues
| | |
July 31, 2023 | | |
July 31, 2022 | |
| | |
For the Three Months Ended | |
| | |
July 31, 2023 | | |
July 31, 2022 | |
| Gross Sales | |
$ | 25,414,735 | | |
$ | 23,631,857 | |
| Less: Slotting, Discounts, Allowances | |
| 624,650 | | |
| 785,383 | |
| Net Sales | |
$ | 24,790,085 | | |
$ | 22,846,474 | |
| | |
July 31, 2023 | | |
July 31, 2022 | |
| | |
For the Six Months Ended | |
| | |
July 31, 2023 | | |
July 31, 2022 | |
| Gross Sales | |
$ | 49,014,645 | | |
$ | 45,980,449 | |
| Less: Slotting, Discounts, Allowances | |
| 1,103,744 | | |
| 1,303,395 | |
| Net Sales | |
$ | 47,910,901 | | |
$ | 44,677,054 | |
Disaggregation
of Revenue from Contracts with Customers. The following table disaggregates gross revenue by significant geographic area for the
three months ended July 31, 2023 and 2022:
Schedule
of Disaggregates Gross Revenue by Significant Geographic Area
| | |
July 31, 2023 | | |
July 31, 2022 | |
| | |
For the Three Months Ended | |
| | |
July 31, 2023 | | |
July 31, 2022 | |
| Northeast | |
$ | 9,385,210 | | |
$ | 9,066,443 | |
| Southeast | |
| 7,191,911 | | |
| 6,857,963 | |
| Midwest | |
| 3,987,565 | | |
| 2,560,178 | |
| West | |
| 2,693,758 | | |
| 2,543,230 | |
| Southwest | |
| 2,156,291 | | |
| 2,604,043 | |
| Total gross sales | |
$ | 25,414,735 | | |
$ | 23,631,857 | |
The
following table disaggregates gross revenue by significant geographic area for the six months ended July 31, 2023 and 2022:
| | |
July 31, 2023 | | |
July 31, 2022 | |
| | |
For the Six Months Ended | |
| | |
July 31, 2023 | | |
July 31, 2022 | |
| Northeast | |
$ | 17,951,303 | | |
$ | 17,755,723 | |
| Southeast | |
| 13,887,317 | | |
| 12,365,760 | |
| Midwest | |
| 8,254,563 | | |
| 5,384,977 | |
| West | |
| 4,615,326 | | |
| 5,442,086 | |
| Southwest | |
| 4,306,136 | | |
| 5,031,903 | |
| Total gross sales | |
$ | 49,014,645 | | |
$ | 45,980,449 | |
|
| Cost of Sales |
Cost
of Sales
Cost
of sales represents costs directly related to the production and manufacturing of the Company’s products. Costs include production
costs, freight-in, packaging, and print production costs.
|
| Advertising |
Advertising
Costs
incurred for advertising for the Company are charged to selling, general and administrative expenses as incurred. Advertising expenses
for the three months ended July 31, 2023 and 2022 were approximately $95,000 and $119,000 respectively. Advertising expenses for the
six months ended July 31, 2023 and 2022 were $304,000 and $307,000 respectively.
|
| Stock-Based Compensation |
Stock-Based
Compensation
The
Company accounts for stock-based compensation in accordance with ASC Topic 718, “Compensation – Stock Compensation”
(“ASC 718”), which establishes financial accounting and reporting standards for stock-based employee compensation.
It defines a fair value-based method of accounting for an employee stock option or similar equity instrument.
The
Company recognizes all forms of stock-based payments, including stock option grants, warrants and restricted stock grants, at their fair
value on the grant date, which are based on the estimated number of awards that are ultimately expected to vest.
Stock-based
payments, excluding restricted stock, are valued using a Black-Scholes option pricing model. Grants of stock-based payment awards issued
to non-employees for services rendered have been recorded at the fair value of the stock-based payment, which is the more readily determinable
value. The grants are amortized on a straight-line basis over the requisite service periods, which is generally the vesting period. If
an award is granted, but vesting does not occur, any previously recognized compensation cost is reversed in the period related to the
termination of service. Stock-based compensation expenses are included in cost of goods sold, selling general and administrative expenses,
or research and development, depending on the nature of the services provided, in the condensed consolidated statements of operations.
Stock-based payments issued to placement agents are classified as a direct cost of a stock offering and are recorded as a reduction of
additional paid in capital.
For
the three months ended July 31, 2023 and 2022, stock-based compensation related to options amounted to approximately $18,000 and $12,000,
respectively.
For
the six months ended July 31, 2023 and 2022, stock-based compensation related to options amounted to approximately $41,000 and $12,000,
respectively.
For
the three and six months ended July 31, 2023, the Company issued 19,960 shares valued at approximately $50,000 to certain employees as
compensation.
For
the six months ended July 31, 2023 and 2022, when computing fair value of stock-based payments, the Company has considered the following
variables:
Schedule
of Fair Value of Share-Based Payments
| | |
July 31, 2023 | | |
July 31, 2022 | |
| Risk-free interest rate | |
| N/A | | |
| 2.77 | % |
| Expected life of grants | |
| N/A | | |
| 7.5 years | |
| Expected volatility of underlying stock | |
| N/A | | |
| 85.74 | % |
| Dividends | |
| N/A | | |
| 0 | % |
|
| Earnings Per Share |
Earnings
Per Share
Basic
net income per share attributable to common stockholders excludes dilution and is computed by dividing net income or loss attributable
to common stockholders during the period by the weighted average number of common shares outstanding during the period. Diluted net income
or loss per share reflects potential dilution and is computed by dividing net income attributable to common stockholders by the weighted
average number of common shares outstanding during the period, which is increased by the number of additional common shares that would
have been outstanding if the potential common shares had been issued. However, if the effect of any additional securities are anti-dilutive
(i.e., resulting in a higher net income per share or lower net loss per share), they are excluded from the dilutive net income computation.
The dilutive effect of stock options, warrants, and restricted stock is calculated using the treasury-stock method and the dilutive effect
of the Series B Preferred Stock is calculated using the if-converted method.
The
following table provides a reconciliation of the numerator and denominator used in computing basic and diluted net income attributable
to common stockholders per common share.
Schedule
of Earnings Per Share, Basic and Diluted
| | |
July 31, 2023 | | |
July 31, 2022 | |
| | |
For the Three Months Ended | |
| | |
July 31, 2023 | | |
July 31, 2022 | |
| Numerator: | |
| | | |
| | |
| Net (loss) income attributable to common stockholders | |
$ | 1,722,678 | | |
| (743,246 | ) |
| Effect of dilutive securities: | |
| 21,233 | | |
| — | |
| | |
| | | |
| | |
| Diluted net income (loss) | |
$ | 1,743,911 | | |
$ | (743,246 | ) |
| | |
| | | |
| | |
| Denominator: | |
| | | |
| | |
| Weighted average common shares outstanding – basic | |
| 36,855,181 | | |
| 35,811,087 | |
| Dilutive securities (a): | |
| | | |
| | |
| Restricted stock | |
| 251,017 | | |
| - | |
| Options | |
| 384,369 | | |
| | |
| | |
| | | |
| - | |
| | |
| | | |
| | |
| Weighted average common shares outstanding and assumed conversion – diluted | |
| 37,490,567 | | |
| 35,811,087 | |
| | |
| | | |
| | |
| Basic net (loss) income per common share | |
$ | 0.05 | | |
$ | (0.02 | ) |
| | |
| | | |
| | |
| Diluted net (loss) income per common share | |
$ | 0.05 | | |
$ | (0.02 | ) |
| | |
| | | |
| | |
| (a) – Anti-dilutive securities excluded: | |
| - | | |
| 689,000 | |
| | |
July 31, 2023 | | |
July 31, 2022 | |
| | |
For the Six Months Ended | |
| | |
July 31, 2023 | | |
July 31, 2022 | |
| Numerator: | |
| | | |
| | |
| Net (loss) income attributable to common stockholders | |
$ | 3,096,304 | | |
| (639,549 | ) |
| Effect of dilutive securities: | |
| 48,533 | | |
| — | |
| | |
| | | |
| | |
| Diluted net income | |
$ | 3,144,837 | | |
$ | (639,549 | ) |
| | |
| | | |
| | |
| Denominator: | |
| | | |
| | |
| Weighted average common shares outstanding – basic | |
| 36,628,429 | | |
| 35,785,719 | |
| Dilutive securities (a): | |
| | | |
| | |
| Restricted stock | |
| 222,280 | | |
| - | |
| Options | |
| 344,605 | | |
| - | |
| | |
| | | |
| - | |
| | |
| | | |
| | |
| Weighted average common shares outstanding and assumed conversion – diluted | |
| 37,195,314 | | |
| 35,785,719 | |
| | |
| | | |
| | |
| Basic net (loss) income per common share | |
$ | 0.09 | | |
$ | (0.02 | ) |
| | |
| | | |
| | |
| Diluted net income (loss) per common share | |
$ | 0.08 | | |
$ | (0.02 | ) |
| | |
| | | |
| | |
| (a) – Anti-dilutive securities excluded: | |
| - | | |
| 689,000 | |
|
| Income Taxes |
Income
Taxes
Income
taxes are provided in accordance with ASC 740, “Accounting for Income Taxes”. A deferred tax asset or liability is
recorded for all temporary differences between financial and tax reporting and net operating loss carryforwards. Deferred tax expense
results from the net change during the period of deferred tax assets and liabilities.
Deferred
tax assets are reduced by a valuation allowance when, in the opinion of management, it is more likely than not that some portion or all
of the deferred tax assets will not be realized. Deferred tax assets are adjusted for the effects of changes in tax laws and rates on
the date of enactment. As of July 31, 2023 and January 31, 2023, the Company recognized a deferred tax asset of $67,908 and $717,559,
respectively, which is included in other long-term assets on the condensed consolidated balance sheets. The Company regularly evaluates
the need for a valuation allowance related to the deferred tax asset.
|
| Recent Accounting Pronouncements |
Recent
Accounting Pronouncements
In
August 2020, the FASB issued ASU No. 2020-06, Accounting for Convertible Instruments and Contracts in an Entity’s Own Equity
(“ASU 2020-06”), which simplifies an issuer’s accounting for convertible instruments by reducing the number of
accounting models that require separate accounting for embedded conversion features. ASU 2020-06 also simplifies the settlement assessment
that entities are required to perform to determine whether a contract qualifies for equity classification and makes targeted improvements
to the disclosures for convertible instruments and earnings-per-share (EPS) guidance. This update will be effective for the Company’s
fiscal years beginning after December 15, 2023, and interim periods within those fiscal years. Early adoption is permitted, but no earlier
than fiscal years beginning after December 15, 2020, and interim periods within those fiscal years. Entities can elect to adopt the new
guidance through either a modified retrospective method of transition or a fully retrospective method of transition. The adoption of
the new standard is not expected to have a significant impact on the Company’s consolidated financial statements.
Management
does not believe that any recently issued, but not yet effective accounting pronouncements, when adopted, will have a material effect
on the accompanying consolidated financial statements.
|
| X |
- References
+ Details
| Name: |
us-gaap_AccountingPoliciesAbstract |
| Namespace Prefix: |
us-gaap_ |
| Data Type: |
xbrli:stringItemType |
| Balance Type: |
na |
| Period Type: |
duration |
|
| X |
- DefinitionDisclosure of accounting policy for advertising cost. Reference 1: http://www.xbrl.org/2003/role/disclosureRef
-Name Accounting Standards Codification
-Section 50
-Paragraph 1
-Subparagraph (a)
-SubTopic 35
-Topic 720
-Publisher FASB
-URI https://asc.fasb.org//1943274/2147483406/720-35-50-1
| Name: |
us-gaap_AdvertisingCostsPolicyTextBlock |
| Namespace Prefix: |
us-gaap_ |
| Data Type: |
dtr-types:textBlockItemType |
| Balance Type: |
na |
| Period Type: |
duration |
|
| X |
- DefinitionDisclosure of accounting policy for basis of accounting, or basis of presentation, used to prepare the financial statements (for example, US Generally Accepted Accounting Principles, Other Comprehensive Basis of Accounting, IFRS).
| Name: |
us-gaap_BasisOfAccountingPolicyPolicyTextBlock |
| Namespace Prefix: |
us-gaap_ |
| Data Type: |
dtr-types:textBlockItemType |
| Balance Type: |
na |
| Period Type: |
duration |
|
| X |
- DefinitionDisclosure of accounting policy for cash and cash equivalents, including the policy for determining which items are treated as cash equivalents. Other information that may be disclosed includes (1) the nature of any restrictions on the entity's use of its cash and cash equivalents, (2) whether the entity's cash and cash equivalents are insured or expose the entity to credit risk, (3) the classification of any negative balance accounts (overdrafts), and (4) the carrying basis of cash equivalents (for example, at cost) and whether the carrying amount of cash equivalents approximates fair value. Reference 1: http://fasb.org/us-gaap/role/ref/legacyRef
-Name Accounting Standards Codification
-Topic 230
-SubTopic 10
-Section 50
-Paragraph 1
-Publisher FASB
-URI https://asc.fasb.org//1943274/2147482913/230-10-50-1
| Name: |
us-gaap_CashAndCashEquivalentsPolicyTextBlock |
| Namespace Prefix: |
us-gaap_ |
| Data Type: |
dtr-types:textBlockItemType |
| Balance Type: |
na |
| Period Type: |
duration |
|
| X |
- DefinitionDisclosure of accounting policy for salaries, bonuses, incentive awards, postretirement and postemployment benefits granted to employees, including equity-based arrangements; discloses methodologies for measurement, and the bases for recognizing related assets and liabilities and recognizing and reporting compensation expense. Reference 1: http://fasb.org/us-gaap/role/ref/legacyRef
-Name Accounting Standards Codification
-Topic 718
-SubTopic 10
-Section 50
-Paragraph 2
-Subparagraph (b),(f(1))
-Publisher FASB
-URI https://asc.fasb.org//1943274/2147480429/718-10-50-2
| Name: |
us-gaap_CompensationRelatedCostsPolicyTextBlock |
| Namespace Prefix: |
us-gaap_ |
| Data Type: |
dtr-types:textBlockItemType |
| Balance Type: |
na |
| Period Type: |
duration |
|
| X |
- DefinitionDisclosure of accounting policy for credit risk. Reference 1: http://fasb.org/us-gaap/role/ref/legacyRef
-Name Accounting Standards Codification
-Topic 942
-SubTopic 825
-Section 50
-Paragraph 1
-Publisher FASB
-URI https://asc.fasb.org//1943274/2147480981/942-825-50-1
Reference 2: http://www.xbrl.org/2003/role/disclosureRef
-Name Accounting Standards Codification
-Section 50
-Paragraph 1
-Subparagraph (d)
-SubTopic 10
-Topic 275
-Publisher FASB
-URI https://asc.fasb.org//1943274/2147482861/275-10-50-1
| Name: |
us-gaap_ConcentrationRiskCreditRisk |
| Namespace Prefix: |
us-gaap_ |
| Data Type: |
dtr-types:textBlockItemType |
| Balance Type: |
na |
| Period Type: |
duration |
|
| X |
- DefinitionDisclosure of accounting policy regarding (1) the principles it follows in consolidating or combining the separate financial statements, including the principles followed in determining the inclusion or exclusion of subsidiaries or other entities in the consolidated or combined financial statements and (2) its treatment of interests (for example, common stock, a partnership interest or other means of exerting influence) in other entities, for example consolidation or use of the equity or cost methods of accounting. The accounting policy may also address the accounting treatment for intercompany accounts and transactions, noncontrolling interest, and the income statement treatment in consolidation for issuances of stock by a subsidiary. Reference 1: http://www.xbrl.org/2003/role/exampleRef
-Topic 235
-SubTopic 10
-Name Accounting Standards Codification
-Section 50
-Paragraph 4
-Subparagraph (a)
-Publisher FASB
-URI https://asc.fasb.org//1943274/2147483426/235-10-50-4
Reference 2: http://fasb.org/us-gaap/role/ref/legacyRef
-Name Accounting Standards Codification
-Topic 810
-SubTopic 10
-Section 50
-Paragraph 1
-Publisher FASB
-URI https://asc.fasb.org//1943274/2147481203/810-10-50-1
| Name: |
us-gaap_ConsolidationPolicyTextBlock |
| Namespace Prefix: |
us-gaap_ |
| Data Type: |
dtr-types:textBlockItemType |
| Balance Type: |
na |
| Period Type: |
duration |
|
| X |
- DefinitionDisclosure of accounting policy for cost of product sold and service rendered. Reference 1: http://www.xbrl.org/2009/role/commonPracticeRef
-Name Accounting Standards Codification
-Topic 705
-Publisher FASB
-URI https://asc.fasb.org//705/tableOfContent
| Name: |
us-gaap_CostOfSalesPolicyTextBlock |
| Namespace Prefix: |
us-gaap_ |
| Data Type: |
dtr-types:textBlockItemType |
| Balance Type: |
na |
| Period Type: |
duration |
|
| X |
- DefinitionDisclosure of accounting policy for computing basic and diluted earnings or loss per share for each class of common stock and participating security. Addresses all significant policy factors, including any antidilutive items that have been excluded from the computation and takes into account stock dividends, splits and reverse splits that occur after the balance sheet date of the latest reporting period but before the issuance of the financial statements. Reference 1: http://fasb.org/us-gaap/role/ref/legacyRef
-Name Accounting Standards Codification
-Topic 260
-SubTopic 10
-Section 50
-Paragraph 1
-Subparagraph (c)
-Publisher FASB
-URI https://asc.fasb.org//1943274/2147482662/260-10-50-1
Reference 2: http://fasb.org/us-gaap/role/ref/legacyRef
-Name Accounting Standards Codification
-Topic 260
-SubTopic 10
-Section 50
-Paragraph 2
-Publisher FASB
-URI https://asc.fasb.org//1943274/2147482662/260-10-50-2
| Name: |
us-gaap_EarningsPerSharePolicyTextBlock |
| Namespace Prefix: |
us-gaap_ |
| Data Type: |
dtr-types:textBlockItemType |
| Balance Type: |
na |
| Period Type: |
duration |
|
| X |
- DefinitionDisclosure of accounting policy for determining the fair value of financial instruments. Reference 1: http://fasb.org/us-gaap/role/ref/legacyRef
-Name Accounting Standards Codification
-Section 60
-Paragraph 1
-SubTopic 10
-Topic 820
-Publisher FASB
-URI https://asc.fasb.org//1943274/2147482053/820-10-60-1
Reference 2: http://fasb.org/us-gaap/role/ref/legacyRef
-Name Accounting Standards Codification
-Section 50
-Paragraph 1
-SubTopic 10
-Topic 825
-Publisher FASB
-URI https://asc.fasb.org//1943274/2147482907/825-10-50-1
| Name: |
us-gaap_FairValueOfFinancialInstrumentsPolicy |
| Namespace Prefix: |
us-gaap_ |
| Data Type: |
dtr-types:textBlockItemType |
| Balance Type: |
na |
| Period Type: |
duration |
|
| X |
- DefinitionDisclosure of accounting policy for goodwill and intangible assets. This accounting policy also may address how an entity assesses and measures impairment of goodwill and intangible assets. Reference 1: http://fasb.org/us-gaap/role/ref/legacyRef
-Name Accounting Standards Codification
-Topic 350
-SubTopic 20
-Section 50
-Paragraph 1
-Publisher FASB
-URI https://asc.fasb.org//1943274/2147482573/350-20-50-1
Reference 2: http://fasb.org/us-gaap/role/ref/legacyRef
-Name Accounting Standards Codification
-Section 50
-Paragraph 1
-SubTopic 30
-Topic 350
-Publisher FASB
-URI https://asc.fasb.org//1943274/2147482665/350-30-50-1
| Name: |
us-gaap_GoodwillAndIntangibleAssetsPolicyTextBlock |
| Namespace Prefix: |
us-gaap_ |
| Data Type: |
dtr-types:textBlockItemType |
| Balance Type: |
na |
| Period Type: |
duration |
|
| X |
- DefinitionDisclosure of accounting policy for income taxes, which may include its accounting policies for recognizing and measuring deferred tax assets and liabilities and related valuation allowances, recognizing investment tax credits, operating loss carryforwards, tax credit carryforwards, and other carryforwards, methodologies for determining its effective income tax rate and the characterization of interest and penalties in the financial statements. Reference 1: http://www.xbrl.org/2003/role/disclosureRef
-Topic 946
-SubTopic 10
-Name Accounting Standards Codification
-Section S99
-Paragraph 3
-Subparagraph (SX 210.6-03(h)(1))
-Publisher FASB
-URI https://asc.fasb.org//1943274/2147479886/946-10-S99-3
Reference 2: http://www.xbrl.org/2003/role/disclosureRef
-Topic 740
-SubTopic 10
-Name Accounting Standards Codification
-Section 50
-Paragraph 17
-Subparagraph (b)
-Publisher FASB
-URI https://asc.fasb.org//1943274/2147482685/740-10-50-17
Reference 3: http://www.xbrl.org/2003/role/disclosureRef
-Topic 740
-SubTopic 10
-Name Accounting Standards Codification
-Section 50
-Paragraph 9
-Publisher FASB
-URI https://asc.fasb.org//1943274/2147482685/740-10-50-9
Reference 4: http://www.xbrl.org/2003/role/disclosureRef
-Topic 740
-SubTopic 10
-Name Accounting Standards Codification
-Section 45
-Paragraph 25
-Publisher FASB
-URI https://asc.fasb.org//1943274/2147482525/740-10-45-25
Reference 5: http://www.xbrl.org/2003/role/disclosureRef
-Topic 740
-SubTopic 10
-Name Accounting Standards Codification
-Section 45
-Paragraph 28
-Publisher FASB
-URI https://asc.fasb.org//1943274/2147482525/740-10-45-28
Reference 6: http://www.xbrl.org/2003/role/disclosureRef
-Topic 740
-SubTopic 10
-Name Accounting Standards Codification
-Section 50
-Paragraph 19
-Publisher FASB
-URI https://asc.fasb.org//1943274/2147482685/740-10-50-19
Reference 7: http://www.xbrl.org/2003/role/disclosureRef
-Topic 220
-SubTopic 10
-Name Accounting Standards Codification
-Section 50
-Paragraph 1
-Publisher FASB
-URI https://asc.fasb.org//1943274/2147482765/220-10-50-1
Reference 8: http://www.xbrl.org/2003/role/disclosureRef
-Topic 740
-SubTopic 10
-Name Accounting Standards Codification
-Section 50
-Paragraph 20
-Publisher FASB
-URI https://asc.fasb.org//1943274/2147482685/740-10-50-20
| Name: |
us-gaap_IncomeTaxPolicyTextBlock |
| Namespace Prefix: |
us-gaap_ |
| Data Type: |
dtr-types:textBlockItemType |
| Balance Type: |
na |
| Period Type: |
duration |
|
| X |
- DefinitionDisclosure of inventory accounting policy for inventory classes, including, but not limited to, basis for determining inventory amounts, methods by which amounts are added and removed from inventory classes, loss recognition on impairment of inventories, and situations in which inventories are stated above cost. Reference 1: http://www.xbrl.org/2003/role/disclosureRef
-Topic 210
-SubTopic 10
-Name Accounting Standards Codification
-Section 50
-Paragraph 1
-Publisher FASB
-URI https://asc.fasb.org//1943274/2147483489/210-10-50-1
Reference 2: http://www.xbrl.org/2003/role/disclosureRef
-Topic 210
-SubTopic 10
-Name Accounting Standards Codification
-Section S99
-Paragraph 1
-Subparagraph (SX 210.5-02(6)(b))
-Publisher FASB
-URI https://asc.fasb.org//1943274/2147480566/210-10-S99-1
Reference 3: http://www.xbrl.org/2003/role/exampleRef
-Topic 235
-SubTopic 10
-Name Accounting Standards Codification
-Section 50
-Paragraph 4
-Subparagraph (d)
-Publisher FASB
-URI https://asc.fasb.org//1943274/2147483426/235-10-50-4
Reference 4: http://www.xbrl.org/2003/role/disclosureRef
-Topic 912
-SubTopic 330
-Name Accounting Standards Codification
-Section 50
-Paragraph 1
-Publisher FASB
-URI https://asc.fasb.org//1943274/2147482105/912-330-50-1
Reference 5: http://www.xbrl.org/2003/role/disclosureRef
-Topic 330
-Name Accounting Standards Codification
-Publisher FASB
-URI https://asc.fasb.org//330/tableOfContent
Reference 6: http://www.xbrl.org/2003/role/disclosureRef
-Topic 330
-SubTopic 10
-Name Accounting Standards Codification
-Section 50
-Paragraph 1
-Publisher FASB
-URI https://asc.fasb.org//1943274/2147483080/330-10-50-1
Reference 7: http://www.xbrl.org/2003/role/disclosureRef
-Topic 330
-SubTopic 10
-Name Accounting Standards Codification
-Section 50
-Paragraph 4
-Publisher FASB
-URI https://asc.fasb.org//1943274/2147483080/330-10-50-4
Reference 8: http://www.xbrl.org/2003/role/disclosureRef
-Name Accounting Standards Codification
-Section 45
-Paragraph 6
-Subparagraph (a)
-SubTopic 10
-Topic 270
-Publisher FASB
-URI https://asc.fasb.org//1943274/2147482989/270-10-45-6
| Name: |
us-gaap_InventoryPolicyTextBlock |
| Namespace Prefix: |
us-gaap_ |
| Data Type: |
dtr-types:textBlockItemType |
| Balance Type: |
na |
| Period Type: |
duration |
|
| X |
- DefinitionDisclosure of accounting policy pertaining to new accounting pronouncements that may impact the entity's financial reporting. Includes, but is not limited to, quantification of the expected or actual impact.
| Name: |
us-gaap_NewAccountingPronouncementsPolicyPolicyTextBlock |
| Namespace Prefix: |
us-gaap_ |
| Data Type: |
dtr-types:textBlockItemType |
| Balance Type: |
na |
| Period Type: |
duration |
|
| X |
- DefinitionDisclosure of accounting policy for long-lived, physical asset used in normal conduct of business and not intended for resale. Includes, but is not limited to, work of art, historical treasure, and similar asset classified as collections. Reference 1: http://fasb.org/us-gaap/role/ref/legacyRef
-Name Accounting Standards Codification
-Section 50
-Paragraph 1
-SubTopic 10
-Topic 360
-Publisher FASB
-URI https://asc.fasb.org//1943274/2147482099/360-10-50-1
Reference 2: http://www.xbrl.org/2003/role/disclosureRef
-Topic 944
-SubTopic 210
-Name Accounting Standards Codification
-Section S99
-Paragraph 1
-Subparagraph (SX 210.7-03(a)(8)(a))
-Publisher FASB
-URI https://asc.fasb.org//1943274/2147479440/944-210-S99-1
Reference 3: http://www.xbrl.org/2003/role/disclosureRef
-Name Accounting Standards Codification
-Section 50
-Paragraph 6
-SubTopic 360
-Topic 958
-Publisher FASB
-URI https://asc.fasb.org//1943274/2147480321/958-360-50-6
Reference 4: http://www.xbrl.org/2003/role/disclosureRef
-Name Accounting Standards Codification
-Section 50
-Paragraph 1
-Subparagraph (d)
-SubTopic 360
-Topic 958
-Publisher FASB
-URI https://asc.fasb.org//1943274/2147480321/958-360-50-1
| Name: |
us-gaap_PropertyPlantAndEquipmentPolicyTextBlock |
| Namespace Prefix: |
us-gaap_ |
| Data Type: |
dtr-types:textBlockItemType |
| Balance Type: |
na |
| Period Type: |
duration |
|
| X |
- DefinitionDisclosure of accounting policy for receivable. Includes, but is not limited to, accounts receivable and financing receivable. Reference 1: http://www.xbrl.org/2009/role/commonPracticeRef
-Topic 310
-SubTopic 20
-Name Accounting Standards Codification
-Section 50
-Paragraph 4
-Publisher FASB
-URI https://asc.fasb.org//1943274/2147481569/310-20-50-4
Reference 2: http://www.xbrl.org/2009/role/commonPracticeRef
-Topic 310
-SubTopic 20
-Name Accounting Standards Codification
-Section 50
-Paragraph 1
-Publisher FASB
-URI https://asc.fasb.org//1943274/2147481569/310-20-50-1
Reference 3: http://www.xbrl.org/2009/role/commonPracticeRef
-Topic 310
-SubTopic 10
-Name Accounting Standards Codification
-Section 50
-Paragraph 2
-Publisher FASB
-URI https://asc.fasb.org//1943274/2147481962/310-10-50-2
Reference 4: http://www.xbrl.org/2009/role/commonPracticeRef
-Topic 310
-SubTopic 20
-Name Accounting Standards Codification
-Section 50
-Paragraph 2
-Publisher FASB
-URI https://asc.fasb.org//1943274/2147481569/310-20-50-2
| Name: |
us-gaap_ReceivablesPolicyTextBlock |
| Namespace Prefix: |
us-gaap_ |
| Data Type: |
dtr-types:textBlockItemType |
| Balance Type: |
na |
| Period Type: |
duration |
|
| X |
- DefinitionDisclosure of accounting policy for costs it has incurred (1) in a planned search or critical investigation aimed at discovery of new knowledge with the hope that such knowledge will be useful in developing a new product or service, a new process or technique, or in bringing about a significant improvement to an existing product or process; or (2) to translate research findings or other knowledge into a plan or design for a new product or process or for a significant improvement to an existing product or process. Reference 1: http://www.xbrl.org/2003/role/disclosureRef
-Topic 730
-SubTopic 10
-Name Accounting Standards Codification
-Section 05
-Paragraph 1
-Subparagraph (c)
-Publisher FASB
-URI https://asc.fasb.org//1943274/2147483044/730-10-05-1
| Name: |
us-gaap_ResearchAndDevelopmentExpensePolicy |
| Namespace Prefix: |
us-gaap_ |
| Data Type: |
dtr-types:textBlockItemType |
| Balance Type: |
na |
| Period Type: |
duration |
|
| X |
- DefinitionDisclosure of accounting policy for revenue from contract with customer. Reference 1: http://www.xbrl.org/2003/role/disclosureRef
-Topic 606
-SubTopic 10
-Name Accounting Standards Codification
-Section 50
-Paragraph 17
-Publisher FASB
-URI https://asc.fasb.org//1943274/2147479806/606-10-50-17
Reference 2: http://www.xbrl.org/2003/role/disclosureRef
-Topic 606
-SubTopic 10
-Name Accounting Standards Codification
-Section 50
-Paragraph 19
-Publisher FASB
-URI https://asc.fasb.org//1943274/2147479806/606-10-50-19
Reference 3: http://www.xbrl.org/2003/role/disclosureRef
-Topic 606
-SubTopic 10
-Name Accounting Standards Codification
-Section 50
-Paragraph 18
-Subparagraph (a)
-Publisher FASB
-URI https://asc.fasb.org//1943274/2147479806/606-10-50-18
Reference 4: http://www.xbrl.org/2003/role/disclosureRef
-Topic 606
-SubTopic 10
-Name Accounting Standards Codification
-Section 50
-Paragraph 18
-Subparagraph (b)
-Publisher FASB
-URI https://asc.fasb.org//1943274/2147479806/606-10-50-18
Reference 5: http://www.xbrl.org/2003/role/disclosureRef
-Topic 606
-SubTopic 10
-Name Accounting Standards Codification
-Section 50
-Paragraph 20
-Subparagraph (a)
-Publisher FASB
-URI https://asc.fasb.org//1943274/2147479806/606-10-50-20
Reference 6: http://www.xbrl.org/2003/role/disclosureRef
-Topic 606
-SubTopic 10
-Name Accounting Standards Codification
-Section 50
-Paragraph 20
-Subparagraph (b)
-Publisher FASB
-URI https://asc.fasb.org//1943274/2147479806/606-10-50-20
Reference 7: http://www.xbrl.org/2003/role/disclosureRef
-Topic 606
-SubTopic 10
-Name Accounting Standards Codification
-Section 50
-Paragraph 20
-Subparagraph (c)
-Publisher FASB
-URI https://asc.fasb.org//1943274/2147479806/606-10-50-20
Reference 8: http://www.xbrl.org/2003/role/disclosureRef
-Topic 606
-SubTopic 10
-Name Accounting Standards Codification
-Section 50
-Paragraph 20
-Subparagraph (d)
-Publisher FASB
-URI https://asc.fasb.org//1943274/2147479806/606-10-50-20
Reference 9: http://www.xbrl.org/2003/role/exampleRef
-Name Accounting Standards Codification
-Section 50
-Paragraph 4
-Subparagraph (e)
-SubTopic 10
-Topic 235
-Publisher FASB
-URI https://asc.fasb.org//1943274/2147483426/235-10-50-4
Reference 10: http://www.xbrl.org/2003/role/disclosureRef
-Name Accounting Standards Codification
-Topic 606
-Publisher FASB
-URI https://asc.fasb.org//606/tableOfContent
| Name: |
us-gaap_RevenueFromContractWithCustomerPolicyTextBlock |
| Namespace Prefix: |
us-gaap_ |
| Data Type: |
dtr-types:textBlockItemType |
| Balance Type: |
na |
| Period Type: |
duration |
|
| X |
- DefinitionDisclosure of accounting policy for the use of estimates in the preparation of financial statements in conformity with generally accepted accounting principles. Reference 1: http://fasb.org/us-gaap/role/ref/legacyRef
-Name Accounting Standards Codification
-Topic 275
-SubTopic 10
-Section 50
-Paragraph 9
-Publisher FASB
-URI https://asc.fasb.org//1943274/2147482861/275-10-50-9
Reference 2: http://fasb.org/us-gaap/role/ref/legacyRef
-Name Accounting Standards Codification
-Topic 275
-SubTopic 10
-Section 50
-Paragraph 4
-Publisher FASB
-URI https://asc.fasb.org//1943274/2147482861/275-10-50-4
Reference 3: http://www.xbrl.org/2003/role/disclosureRef
-Name Accounting Standards Codification
-Section 50
-Paragraph 1
-Subparagraph (b)
-SubTopic 10
-Topic 275
-Publisher FASB
-URI https://asc.fasb.org//1943274/2147482861/275-10-50-1
Reference 4: http://www.xbrl.org/2003/role/disclosureRef
-Name Accounting Standards Codification
-Section 50
-Paragraph 1
-Subparagraph (c)
-SubTopic 10
-Topic 275
-Publisher FASB
-URI https://asc.fasb.org//1943274/2147482861/275-10-50-1
Reference 5: http://www.xbrl.org/2003/role/disclosureRef
-Name Accounting Standards Codification
-Section 50
-Paragraph 11
-SubTopic 10
-Topic 275
-Publisher FASB
-URI https://asc.fasb.org//1943274/2147482861/275-10-50-11
Reference 6: http://www.xbrl.org/2003/role/disclosureRef
-Name Accounting Standards Codification
-Section 50
-Paragraph 12
-SubTopic 10
-Topic 275
-Publisher FASB
-URI https://asc.fasb.org//1943274/2147482861/275-10-50-12
Reference 7: http://fasb.org/us-gaap/role/ref/legacyRef
-Name Accounting Standards Codification
-Topic 275
-SubTopic 10
-Section 50
-Paragraph 8
-Publisher FASB
-URI https://asc.fasb.org//1943274/2147482861/275-10-50-8
| Name: |
us-gaap_UseOfEstimates |
| Namespace Prefix: |
us-gaap_ |
| Data Type: |
dtr-types:textBlockItemType |
| Balance Type: |
na |
| Period Type: |
duration |
|
v3.23.2
| X |
- DefinitionTabular disclosure of condensed income statement, including, but not limited to, income statements of consolidated entities and consolidation eliminations. Reference 1: http://www.xbrl.org/2009/role/commonPracticeRef
-Name Regulation S-X (SX)
-Number 210
-Section 12
-Subsection 04
-Paragraph (a)
-Publisher SEC
Reference 2: http://www.xbrl.org/2009/role/commonPracticeRef
-Topic 235
-SubTopic 10
-Name Accounting Standards Codification
-Section S99
-Paragraph 3
-Subparagraph (SX 210.12-04(a))
-Publisher FASB
-URI https://asc.fasb.org//1943274/2147480678/235-10-S99-3
| Name: |
srt_ScheduleOfCondensedIncomeStatementTableTextBlock |
| Namespace Prefix: |
srt_ |
| Data Type: |
dtr-types:textBlockItemType |
| Balance Type: |
na |
| Period Type: |
duration |
|
| X |
- References
+ Details
| Name: |
us-gaap_OrganizationConsolidationAndPresentationOfFinancialStatementsAbstract |
| Namespace Prefix: |
us-gaap_ |
| Data Type: |
xbrli:stringItemType |
| Balance Type: |
na |
| Period Type: |
duration |
|
v3.23.2
Summary of Significant Accounting Policies (Tables)
|
6 Months Ended |
Jul. 31, 2023 |
|---|
| Accounting Policies [Abstract] |
|
| Schedule of Inventories |
Inventories
by major category are as follows:
Schedule of Inventories
| | |
July
31, 2023 | | |
January 31, 2023 | |
| Raw materials and packaging | |
$ | 1,495,179 | | |
$ | 1,883,270 | |
| Work in process | |
| 200,437 | | |
| 98,910 | |
| Finished goods | |
| 1,612,897 | | |
| 1,653,701 | |
| Total | |
$ | 3,308,513 | | |
$ | 3,635,881 | |
|
| Schedule of Property and Equipment Estimated Useful Lives |
Asset
lives for financial statement reporting of depreciation are:
Schedule
of Property and Equipment Estimated Useful Lives
| Machinery and equipment | |
| 2-7 years | |
| Furniture and fixtures | |
| 3-5 years | |
| Leasehold improvements | |
| -* | |
| (*) |
Amortized
on a straight-line basis over the remaining lease term at the time the asset was placed in service, whichever period is shorter. |
|
| Schedule of Other Intangible Assets Impairment Losses Recognized for Goodwill |
Other
intangible assets consist of trademarks, trade names and customer relationships. Intangible asset lives for financial statement reporting
of amortization are:
Schedule
of Other Intangible Assets Impairment Losses Recognized for Goodwill
| Tradenames and trademarks | |
| 3 years | |
| Customer relationships | |
| 4 – 5 years | |
|
| Schedule of Expenses of Slotting Fees, Sales Discounts and Allowances are Accounted as Direct Reduction of Revenues |
Expenses
such as slotting fees, sales discounts, and allowances are accounted for as a direct reduction of revenues as follows:
Schedule
of Expenses of Slotting Fees, Sales Discounts and Allowances are Accounted as Direct Reduction of Revenues
| | |
July 31, 2023 | | |
July 31, 2022 | |
| | |
For the Three Months Ended | |
| | |
July 31, 2023 | | |
July 31, 2022 | |
| Gross Sales | |
$ | 25,414,735 | | |
$ | 23,631,857 | |
| Less: Slotting, Discounts, Allowances | |
| 624,650 | | |
| 785,383 | |
| Net Sales | |
$ | 24,790,085 | | |
$ | 22,846,474 | |
| | |
July 31, 2023 | | |
July 31, 2022 | |
| | |
For the Six Months Ended | |
| | |
July 31, 2023 | | |
July 31, 2022 | |
| Gross Sales | |
$ | 49,014,645 | | |
$ | 45,980,449 | |
| Less: Slotting, Discounts, Allowances | |
| 1,103,744 | | |
| 1,303,395 | |
| Net Sales | |
$ | 47,910,901 | | |
$ | 44,677,054 | |
|
| Schedule of Disaggregates Gross Revenue by Significant Geographic Area |
Schedule
of Disaggregates Gross Revenue by Significant Geographic Area
| | |
July 31, 2023 | | |
July 31, 2022 | |
| | |
For the Three Months Ended | |
| | |
July 31, 2023 | | |
July 31, 2022 | |
| Northeast | |
$ | 9,385,210 | | |
$ | 9,066,443 | |
| Southeast | |
| 7,191,911 | | |
| 6,857,963 | |
| Midwest | |
| 3,987,565 | | |
| 2,560,178 | |
| West | |
| 2,693,758 | | |
| 2,543,230 | |
| Southwest | |
| 2,156,291 | | |
| 2,604,043 | |
| Total gross sales | |
$ | 25,414,735 | | |
$ | 23,631,857 | |
The
following table disaggregates gross revenue by significant geographic area for the six months ended July 31, 2023 and 2022:
| | |
July 31, 2023 | | |
July 31, 2022 | |
| | |
For the Six Months Ended | |
| | |
July 31, 2023 | | |
July 31, 2022 | |
| Northeast | |
$ | 17,951,303 | | |
$ | 17,755,723 | |
| Southeast | |
| 13,887,317 | | |
| 12,365,760 | |
| Midwest | |
| 8,254,563 | | |
| 5,384,977 | |
| West | |
| 4,615,326 | | |
| 5,442,086 | |
| Southwest | |
| 4,306,136 | | |
| 5,031,903 | |
| Total gross sales | |
$ | 49,014,645 | | |
$ | 45,980,449 | |
|
| Schedule of Fair Value of Share-Based Payments |
For
the six months ended July 31, 2023 and 2022, when computing fair value of stock-based payments, the Company has considered the following
variables:
Schedule
of Fair Value of Share-Based Payments
| | |
July 31, 2023 | | |
July 31, 2022 | |
| Risk-free interest rate | |
| N/A | | |
| 2.77 | % |
| Expected life of grants | |
| N/A | | |
| 7.5 years | |
| Expected volatility of underlying stock | |
| N/A | | |
| 85.74 | % |
| Dividends | |
| N/A | | |
| 0 | % |
|
| Schedule of Earnings Per Share, Basic and Diluted |
The
following table provides a reconciliation of the numerator and denominator used in computing basic and diluted net income attributable
to common stockholders per common share.
Schedule
of Earnings Per Share, Basic and Diluted
| | |
July 31, 2023 | | |
July 31, 2022 | |
| | |
For the Three Months Ended | |
| | |
July 31, 2023 | | |
July 31, 2022 | |
| Numerator: | |
| | | |
| | |
| Net (loss) income attributable to common stockholders | |
$ | 1,722,678 | | |
| (743,246 | ) |
| Effect of dilutive securities: | |
| 21,233 | | |
| — | |
| | |
| | | |
| | |
| Diluted net income (loss) | |
$ | 1,743,911 | | |
$ | (743,246 | ) |
| | |
| | | |
| | |
| Denominator: | |
| | | |
| | |
| Weighted average common shares outstanding – basic | |
| 36,855,181 | | |
| 35,811,087 | |
| Dilutive securities (a): | |
| | | |
| | |
| Restricted stock | |
| 251,017 | | |
| - | |
| Options | |
| 384,369 | | |
| | |
| | |
| | | |
| - | |
| | |
| | | |
| | |
| Weighted average common shares outstanding and assumed conversion – diluted | |
| 37,490,567 | | |
| 35,811,087 | |
| | |
| | | |
| | |
| Basic net (loss) income per common share | |
$ | 0.05 | | |
$ | (0.02 | ) |
| | |
| | | |
| | |
| Diluted net (loss) income per common share | |
$ | 0.05 | | |
$ | (0.02 | ) |
| | |
| | | |
| | |
| (a) – Anti-dilutive securities excluded: | |
| - | | |
| 689,000 | |
| | |
July 31, 2023 | | |
July 31, 2022 | |
| | |
For the Six Months Ended | |
| | |
July 31, 2023 | | |
July 31, 2022 | |
| Numerator: | |
| | | |
| | |
| Net (loss) income attributable to common stockholders | |
$ | 3,096,304 | | |
| (639,549 | ) |
| Effect of dilutive securities: | |
| 48,533 | | |
| — | |
| | |
| | | |
| | |
| Diluted net income | |
$ | 3,144,837 | | |
$ | (639,549 | ) |
| | |
| | | |
| | |
| Denominator: | |
| | | |
| | |
| Weighted average common shares outstanding – basic | |
| 36,628,429 | | |
| 35,785,719 | |
| Dilutive securities (a): | |
| | | |
| | |
| Restricted stock | |
| 222,280 | | |
| - | |
| Options | |
| 344,605 | | |
| - | |
| | |
| | | |
| - | |
| | |
| | | |
| | |
| Weighted average common shares outstanding and assumed conversion – diluted | |
| 37,195,314 | | |
| 35,785,719 | |
| | |
| | | |
| | |
| Basic net (loss) income per common share | |
$ | 0.09 | | |
$ | (0.02 | ) |
| | |
| | | |
| | |
| Diluted net income (loss) per common share | |
$ | 0.08 | | |
$ | (0.02 | ) |
| | |
| | | |
| | |
| (a) – Anti-dilutive securities excluded: | |
| - | | |
| 689,000 | |
|
| X |
- DefinitionTabular disclosure of expenses of slotting fees and sales discounts accounted for direct reduction.
| Name: |
MAMA_ScheduleOfExpensesOfSlottingFeesAndSalesDiscountsAccountedForDirectReductionInRevenuesTableTextBlock |
| Namespace Prefix: |
MAMA_ |
| Data Type: |
dtr-types:textBlockItemType |
| Balance Type: |
na |
| Period Type: |
duration |
|
| X |
- DefinitionTabular disclosure of property and equipment estimated useful lives.
| Name: |
MAMA_ScheduleOfPropertyAndEquipmentEstimatedUsefulLivesTableTextBlock |
| Namespace Prefix: |
MAMA_ |
| Data Type: |
dtr-types:textBlockItemType |
| Balance Type: |
na |
| Period Type: |
duration |
|
| X |
- References
+ Details
| Name: |
us-gaap_AccountingPoliciesAbstract |
| Namespace Prefix: |
us-gaap_ |
| Data Type: |
xbrli:stringItemType |
| Balance Type: |
na |
| Period Type: |
duration |
|
| X |
- DefinitionTabular disclosure of revenue from external customers by geographic areas attributed to the entity's country of domicile and to foreign countries from which the entity derives revenue. Reference 1: http://fasb.org/us-gaap/role/ref/legacyRef
-Name Accounting Standards Codification
-Section 50
-Paragraph 41
-Subparagraph a
-SubTopic 10
-Topic 280
-Publisher FASB
-URI https://asc.fasb.org//1943274/2147482810/280-10-50-41
| Name: |
us-gaap_RevenueFromExternalCustomersByGeographicAreasTableTextBlock |
| Namespace Prefix: |
us-gaap_ |
| Data Type: |
dtr-types:textBlockItemType |
| Balance Type: |
na |
| Period Type: |
duration |
|
| X |
- DefinitionTabular disclosure of an equity-based arrangement (such as stock or unit options and stock or unit awards) with an individual employee, which is generally an employment contract between the entity and a selected officer or key employee containing a promise by the employer to pay certain equity-based awards at future dates, sometimes including a period after retirement, upon compliance with stipulated requirements. This type of arrangement is distinguished from broader based employee benefit plans as it is usually tailored to the employee. Disclosure also typically includes the amount of related compensation expense recognized during the reporting period, the number of shares or units issued during the period under such arrangements, and the carrying amount as of the balance sheet date of the related liability. Reference 1: http://fasb.org/us-gaap/role/ref/legacyRef
-Topic 710
-SubTopic 10
-Name Accounting Standards Codification
-Section 30
-Paragraph 1
-Publisher FASB
-URI https://asc.fasb.org//1943274/2147483043/710-10-30-1
Reference 2: http://fasb.org/us-gaap/role/ref/legacyRef
-Name Accounting Standards Codification
-Section 50
-Paragraph 1
-SubTopic 10
-Topic 718
-Publisher FASB
-URI https://asc.fasb.org//1943274/2147480429/718-10-50-1
Reference 3: http://fasb.org/us-gaap/role/ref/legacyRef
-Name Accounting Standards Codification
-Topic 718
-SubTopic 10
-Section 50
-Paragraph 2
-Publisher FASB
-URI https://asc.fasb.org//1943274/2147480429/718-10-50-2
Reference 4: http://fasb.org/us-gaap/role/ref/legacyRef
-Name Accounting Standards Codification
-Topic 710
-SubTopic 10
-Section 55
-Paragraph 8
-Publisher FASB
-URI https://asc.fasb.org//1943274/2147482943/710-10-55-8
| Name: |
us-gaap_ScheduleOfDeferredCompensationArrangementWithIndividualShareBasedPaymentsTextBlock |
| Namespace Prefix: |
us-gaap_ |
| Data Type: |
dtr-types:textBlockItemType |
| Balance Type: |
na |
| Period Type: |
duration |
|
| X |
- DefinitionTabular disclosure of an entity's basic and diluted earnings per share calculations, including a reconciliation of numerators and denominators of the basic and diluted per-share computations for income from continuing operations. Reference 1: http://www.xbrl.org/2009/role/commonPracticeRef
-Topic 260
-SubTopic 10
-Name Accounting Standards Codification
-Section 50
-Paragraph 1
-Subparagraph (a)
-Publisher FASB
-URI https://asc.fasb.org//1943274/2147482662/260-10-50-1
| Name: |
us-gaap_ScheduleOfEarningsPerShareBasicAndDilutedTableTextBlock |
| Namespace Prefix: |
us-gaap_ |
| Data Type: |
dtr-types:textBlockItemType |
| Balance Type: |
na |
| Period Type: |
duration |
|
| X |
- DefinitionTabular disclosure of assets, excluding financial assets and goodwill, lacking physical substance with a finite life, by either major class or business segment. Reference 1: http://fasb.org/us-gaap/role/ref/legacyRef
-Name Accounting Standards Codification
-Topic 350
-SubTopic 30
-Section 50
-Paragraph 1
-Subparagraph (a)
-Publisher FASB
-URI https://asc.fasb.org//1943274/2147482665/350-30-50-1
Reference 2: http://fasb.org/us-gaap/role/ref/legacyRef
-Name Accounting Standards Codification
-Topic 350
-SubTopic 30
-Section 50
-Paragraph 2
-Subparagraph (a)
-Publisher FASB
-URI https://asc.fasb.org//1943274/2147482665/350-30-50-2
| Name: |
us-gaap_ScheduleOfFiniteLivedIntangibleAssetsTableTextBlock |
| Namespace Prefix: |
us-gaap_ |
| Data Type: |
dtr-types:textBlockItemType |
| Balance Type: |
na |
| Period Type: |
duration |
|
| X |
- DefinitionTabular disclosure of the carrying amount as of the balance sheet date of merchandise, goods, commodities, or supplies held for future sale or to be used in manufacturing, servicing or production process. Reference 1: http://fasb.org/us-gaap/role/ref/legacyRef
-Topic 210
-SubTopic 10
-Name Accounting Standards Codification
-Section S99
-Paragraph 1
-Subparagraph (SX 210.5-02(6)(a))
-Publisher FASB
-URI https://asc.fasb.org//1943274/2147480566/210-10-S99-1
Reference 2: http://fasb.org/us-gaap/role/ref/legacyRef
-Topic 210
-SubTopic 10
-Name Accounting Standards Codification
-Section S99
-Paragraph 1
-Subparagraph (SX 210.5-02(6)(b))
-Publisher FASB
-URI https://asc.fasb.org//1943274/2147480566/210-10-S99-1
Reference 3: http://fasb.org/us-gaap/role/ref/legacyRef
-Topic 210
-SubTopic 10
-Name Accounting Standards Codification
-Section S99
-Paragraph 1
-Subparagraph (SX 210.5-02(6)(c))
-Publisher FASB
-URI https://asc.fasb.org//1943274/2147480566/210-10-S99-1
Reference 4: http://fasb.org/us-gaap/role/ref/legacyRef
-Name Accounting Standards Codification
-Topic 210
-SubTopic 10
-Section 50
-Paragraph 1
-Publisher FASB
-URI https://asc.fasb.org//1943274/2147483489/210-10-50-1
| Name: |
us-gaap_ScheduleOfInventoryCurrentTableTextBlock |
| Namespace Prefix: |
us-gaap_ |
| Data Type: |
dtr-types:textBlockItemType |
| Balance Type: |
na |
| Period Type: |
duration |
|
v3.23.2
Property Plant and Equipment (Tables)
|
6 Months Ended |
Jul. 31, 2023 |
|---|
| Property, Plant and Equipment [Abstract] |
|
| Schedule of Property and Equipment |
Property
plant and equipment on July 31, 2023 and January 31, 2023 are as follows:
Schedule of Property and Equipment
| | |
July
31, 2023 | | |
January 31, 2023 | |
| Machinery and Equipment | |
$ | 3,669,137 | | |
$ | 5,387,255 | |
| Furniture and Fixtures | |
| 236,645 | | |
| 284,781 | |
| Leasehold Improvements | |
| 2,841,159 | | |
| 3,480,061 | |
| Property and Equipment, Gross | |
| 6,746,941 | | |
| 9,152,097 | |
| Less: Accumulated Depreciation | |
| 2,679,293 | | |
| 5,729,001 | |
| Total | |
$ | 4,067,648 | | |
$ | 3,423,096 | |
|
| X |
- References
+ Details
| Name: |
us-gaap_PropertyPlantAndEquipmentAbstract |
| Namespace Prefix: |
us-gaap_ |
| Data Type: |
xbrli:stringItemType |
| Balance Type: |
na |
| Period Type: |
duration |
|
| X |
- DefinitionTabular disclosure of physical assets used in the normal conduct of business and not intended for resale. Includes, but is not limited to, balances by class of assets, depreciation and depletion expense and method used, including composite depreciation, and accumulated deprecation. Reference 1: http://fasb.org/us-gaap/role/ref/legacyRef
-Name Accounting Standards Codification
-Section 50
-Paragraph 1
-SubTopic 10
-Topic 360
-Publisher FASB
-URI https://asc.fasb.org//1943274/2147482099/360-10-50-1
| Name: |
us-gaap_PropertyPlantAndEquipmentTextBlock |
| Namespace Prefix: |
us-gaap_ |
| Data Type: |
dtr-types:textBlockItemType |
| Balance Type: |
na |
| Period Type: |
duration |
|
v3.23.2
Acquisition of CIF (Tables)
|
6 Months Ended |
Jul. 31, 2023 |
|---|
| Business Combination and Asset Acquisition [Abstract] |
|
| Schedule of Purchase Price Calculation |
Schedule
of Purchase Price Calculation
| | |
| | |
| Cash transferred upon acquisition | |
| 950,000 | |
| Related party debt issued upon acquisition | |
| 2,700,000 | |
| Sub-total | |
| 3,650,000 | |
| Carrying value of the Company’s equity method investment in CIF | |
| 1,566,828 | |
| Total purchase price | |
| 5,216,828 | |
|
| Schedule of Allocation of Purchase Price |
The
allocation of the purchase price was as follows (amounts in thousands):
Schedule
of Allocation of Purchase Price
| | |
| | |
| Cash and cash equivalents | |
$ | 304,359 | |
| Net working capital (excluding cash) | |
| 356,848 | |
| Customer relationships | |
| 4,555,621 | |
| Net assets acquired | |
$ | 5,216,828 | |
|
| X |
- References
+ Details
| Name: |
us-gaap_BusinessCombinationAndAssetAcquisitionAbstract |
| Namespace Prefix: |
us-gaap_ |
| Data Type: |
xbrli:stringItemType |
| Balance Type: |
na |
| Period Type: |
duration |
|
| X |
- DefinitionTabular disclosure of goodwill in a business combination. Reference 1: http://fasb.org/us-gaap/role/ref/legacyRef
-Name Accounting Standards Codification
-Section 50
-Paragraph 1
-SubTopic 30
-Topic 805
-Publisher FASB
-URI https://asc.fasb.org//1943274/2147479581/805-30-50-1
| Name: |
us-gaap_BusinessCombinationSegmentAllocationTableTextBlock |
| Namespace Prefix: |
us-gaap_ |
| Data Type: |
dtr-types:textBlockItemType |
| Balance Type: |
na |
| Period Type: |
duration |
|
| X |
- DefinitionTabular disclosure of a material business combination completed during the period, including background, timing, and recognized assets and liabilities. This table does not include leveraged buyouts. Reference 1: http://fasb.org/us-gaap/role/ref/legacyRef
-Name Accounting Standards Codification
-Topic 805
-SubTopic 10
-Section 50
-Paragraph 3
-Publisher FASB
-URI https://asc.fasb.org//1943274/2147479328/805-10-50-3
Reference 2: http://fasb.org/us-gaap/role/ref/legacyRef
-Name Accounting Standards Codification
-Topic 805
-SubTopic 10
-Section 50
-Paragraph 2
-Publisher FASB
-URI https://asc.fasb.org//1943274/2147479328/805-10-50-2
| Name: |
us-gaap_ScheduleOfBusinessAcquisitionsByAcquisitionTextBlock |
| Namespace Prefix: |
us-gaap_ |
| Data Type: |
dtr-types:textBlockItemType |
| Balance Type: |
na |
| Period Type: |
duration |
|
v3.23.2
Intangible assets, net (Tables)
|
6 Months Ended |
Jul. 31, 2023 |
|---|
| Goodwill and Intangible Assets Disclosure [Abstract] |
|
| Schedule of Intangibles Assets |
Intangible
assets, net consisted of the following at July 31, 2023:
Schedule of Intangibles Assets
| | |
Gross Carrying Amount | | |
Accumulated Amortization | | |
Net Carrying Amount | | |
Weighted Average Remaining Life (years) | |
| Software | |
$ | 87,639 | | |
$ | (87,639 | ) | |
$ | - | | |
| - | |
| Customer relationships | |
| 6,417,621 | | |
| (700,666 | ) | |
| 5,716,955 | | |
| 3.79 | |
| Tradename and trademarks | |
| 79,000 | | |
| (41,773 | ) | |
| 37,227 | | |
| 1.41 | |
| | |
$ | 6,584,260 | | |
$ | (830,078 | ) | |
$ | 5,754,182 | | |
| | |
Intangibles,
net consisted of the following at January 31, 2023:
| | |
Gross Carrying Amount | | |
Accumulated Amortization | | |
Net Carrying Amount | | |
Weighted Average Remaining Life | |
| Software | |
$ | 87,639 | | |
$ | (87,639 | ) | |
$ | - | | |
| - | |
| Customer relationships | |
| 1,862,000 | | |
| (409,776 | ) | |
| 1,452,224 | | |
| 3.41 | |
| Tradename and trademarks | |
| 79,000 | | |
| (28,714 | ) | |
| 50,286 | | |
| 1.91 | |
| | |
$ | 2,028,639 | | |
$ | (526,129 | ) | |
$ | 1,502,510 | | |
| | |
|
| Schedule of Estimated Aggregate Amortization Expense |
We
expect the estimated aggregate amortization expense for each of the five succeeding fiscal years to be as follows:
Schedule of Estimated Aggregate Amortization Expense
| | |
| | |
| 2024 (Remaining) | |
$ | 768,954 | |
| 2025 | |
| 1,538,766 | |
| 2026 | |
| 1,513,238 | |
| 2027 | |
| 1,466,741 | |
| 2028 | |
| 466,483 | |
| Total | |
$ | 5,754,182 | |
|
| X |
- References
+ Details
| Name: |
us-gaap_GoodwillAndIntangibleAssetsDisclosureAbstract |
| Namespace Prefix: |
us-gaap_ |
| Data Type: |
xbrli:stringItemType |
| Balance Type: |
na |
| Period Type: |
duration |
|
| X |
- DefinitionTabular disclosure of the characteristics, including initial carrying value, residual amount, weighted average useful life, of finite-lived intangible assets acquired during the period by major class. A major class is composed of intangible assets that can be grouped together because they are similar, either by nature or by their use in the operations of the company. Reference 1: http://fasb.org/us-gaap/role/ref/legacyRef
-Name Accounting Standards Codification
-Topic 350
-SubTopic 30
-Section 50
-Paragraph 1
-Subparagraph (a)
-Publisher FASB
-URI https://asc.fasb.org//1943274/2147482665/350-30-50-1
| Name: |
us-gaap_ScheduleOfAcquiredFiniteLivedIntangibleAssetsByMajorClassTextBlock |
| Namespace Prefix: |
us-gaap_ |
| Data Type: |
dtr-types:textBlockItemType |
| Balance Type: |
na |
| Period Type: |
duration |
|
| X |
- DefinitionTabular disclosure of the amount of amortization expense expected to be recorded in succeeding fiscal years for finite-lived intangible assets. Reference 1: http://fasb.org/us-gaap/role/ref/legacyRef
-Name Accounting Standards Codification
-Topic 350
-SubTopic 30
-Section 50
-Paragraph 2
-Subparagraph (a)
-Publisher FASB
-URI https://asc.fasb.org//1943274/2147482665/350-30-50-2
| Name: |
us-gaap_ScheduleofFiniteLivedIntangibleAssetsFutureAmortizationExpenseTableTextBlock |
| Namespace Prefix: |
us-gaap_ |
| Data Type: |
dtr-types:textBlockItemType |
| Balance Type: |
na |
| Period Type: |
duration |
|
v3.23.2
Stockholders’ Equity (Tables)
|
6 Months Ended |
Jul. 31, 2023 |
|---|
| Equity [Abstract] |
|
| Schedule of Restricted Stock Option Activity |
The
following is a summary of the Company’s restricted stock units activity:
Schedule
of Restricted Stock Option Activity
| | |
Restricted Stock Units | | |
Weighted Average Exercise Price | |
| Unvested – February 1, 2023 | |
| 367,647 | | |
$ | 1.36 | |
| Granted | |
| 39,773 | | |
$ | 1.76 | |
| Vested | |
| - | | |
$ | - | |
| Forfeited | |
| - | | |
$ | - | |
| Outstanding – July 31, 2023 | |
| 407,420 | | |
$ | 1.40 | |
|
| Summary of Option Activity |
The
following is a summary of the Company’s option activity:
Summary
of Option Activity
| | |
Options | | |
Weighted Average Exercise Price | | |
Weighted Average Remaining Contractual Life (in years) | | |
Aggregate Intrinsic Value | |
| Outstanding – February 1, 2023 | |
| 689,000 | | |
$ | 0.77 | | |
| 2.95 | | |
$ | 544,760 | |
| Granted | |
| - | | |
$ | - | | |
| | | |
| | |
| Exercised | |
| 206,000 | | |
$ | 0.40 | | |
| | | |
| | |
| Expired/forfeited | |
| - | | |
| - | | |
| | | |
| | |
| Outstanding – July 31, 2023 | |
| 483,000 | | |
$ | 0.92 | | |
| 2.68 | | |
$ | 1,347,410 | |
| Exercisable – July 31, 2023 | |
| 370,500 | | |
$ | 0.75 | | |
| 1.55 | | |
$ | 1,096,535 | |
|
| Schedule of Warrants Activity |
The
following is a summary of the Company’s warrant activity:
Schedule
of Warrants Activity
| | |
Warrants | | |
Weighted Average Exercise Price | |
| Outstanding – February 1, 2023 | |
| 13,650 | | |
$ | 2.25 | |
| Exercisable – February 1, 2023 | |
| 13,650 | | |
$ | 2.25 | |
| Granted | |
| - | | |
$ | | |
| Exercised | |
| 13,650 | | |
$ | - | |
| Outstanding – July 31, 2023 | |
| - | | |
$ | - | |
| Exercisable – July 31, 2023 | |
| - | | |
$ | - | |
|
| X |
- References
+ Details
| Name: |
us-gaap_EquityAbstract |
| Namespace Prefix: |
us-gaap_ |
| Data Type: |
xbrli:stringItemType |
| Balance Type: |
na |
| Period Type: |
duration |
|
| X |
- DefinitionTabular disclosure of the changes in outstanding nonvested restricted stock units. Reference 1: http://fasb.org/us-gaap/role/ref/legacyRef
-Name Accounting Standards Codification
-Topic 718
-SubTopic 10
-Section 50
-Paragraph 2
-Subparagraph (c)(2)
-Publisher FASB
-URI https://asc.fasb.org//1943274/2147480429/718-10-50-2
| Name: |
us-gaap_ScheduleOfNonvestedRestrictedStockUnitsActivityTableTextBlock |
| Namespace Prefix: |
us-gaap_ |
| Data Type: |
dtr-types:textBlockItemType |
| Balance Type: |
na |
| Period Type: |
duration |
|
| X |
- DefinitionTabular disclosure for stock option plans. Includes, but is not limited to, outstanding awards at beginning and end of year, grants, exercises, forfeitures, and weighted-average grant date fair value. Reference 1: http://fasb.org/us-gaap/role/ref/legacyRef
-Name Accounting Standards Codification
-Topic 718
-SubTopic 10
-Section 50
-Paragraph 2
-Subparagraph (c)(1)
-Publisher FASB
-URI https://asc.fasb.org//1943274/2147480429/718-10-50-2
Reference 2: http://fasb.org/us-gaap/role/ref/legacyRef
-Name Accounting Standards Codification
-Section 50
-Paragraph 2
-Subparagraph (d)
-SubTopic 10
-Topic 718
-Publisher FASB
-URI https://asc.fasb.org//1943274/2147480429/718-10-50-2
Reference 3: http://fasb.org/us-gaap/role/ref/legacyRef
-Name Accounting Standards Codification
-Section 50
-Paragraph 2
-Subparagraph (e)
-SubTopic 10
-Topic 718
-Publisher FASB
-URI https://asc.fasb.org//1943274/2147480429/718-10-50-2
| Name: |
us-gaap_ScheduleOfShareBasedCompensationStockOptionsActivityTableTextBlock |
| Namespace Prefix: |
us-gaap_ |
| Data Type: |
dtr-types:textBlockItemType |
| Balance Type: |
na |
| Period Type: |
duration |
|
| X |
- DefinitionTabular disclosure of warrants or rights issued. Warrants and rights outstanding are derivative securities that give the holder the right to purchase securities (usually equity) from the issuer at a specific price within a certain time frame. Warrants are often included in a new debt issue to entice investors by a higher return potential. The main difference between warrants and call options is that warrants are issued and guaranteed by the company, whereas options are exchange instruments and are not issued by the company. Also, the lifetime of a warrant is often measured in years, while the lifetime of a typical option is measured in months. Disclose the title of issue of securities called for by warrants and rights outstanding, the aggregate amount of securities called for by warrants and rights outstanding, the date from which the warrants or rights are exercisable, and the price at which the warrant or right is exercisable. Reference 1: http://fasb.org/us-gaap/role/ref/legacyRef
-Name Accounting Standards Codification
-Topic 718
-SubTopic 10
-Section 50
-Paragraph 1
-Subparagraph (a)
-Publisher FASB
-URI https://asc.fasb.org//1943274/2147480429/718-10-50-1
| Name: |
us-gaap_ScheduleOfStockholdersEquityNoteWarrantsOrRightsTextBlock |
| Namespace Prefix: |
us-gaap_ |
| Data Type: |
dtr-types:textBlockItemType |
| Balance Type: |
na |
| Period Type: |
duration |
|
v3.23.2
Leases (Tables)
|
6 Months Ended |
Jul. 31, 2023 |
|---|
| Leases |
|
| Schedule of Supplemental Cash Flow and Other Information Related to Leases |
Supplemental
cash flow and other information related to leases was as follows:
Schedule
of Supplemental Cash Flow and Other Information Related to Leases
| | |
July 31, 2023 | | |
July 31, 2022 | |
| Cash paid for amounts included in the measurement of lease liabilities | |
| | | |
| | |
| Operating cash flows from operating leases | |
$ | (134,862 | ) | |
$ | (176,534 | ) |
| Financing cash flows from finance leases | |
| (92,724 | ) | |
| (130,626 | ) |
The
following table shows the weighted average lease term and weighted average discount rate for our ROU assets:
| | |
July 31, 2023 | | |
January 31, 2023 | |
| Weighted average remaining lease term (in years) | |
| | | |
| | |
| Operating leases | |
| 7.00 | | |
| 7.50 | |
| Finance leases | |
| 4.28 | | |
| 2.60 | |
| | |
| | | |
| | |
| Weighted average discount rate: | |
| | | |
| | |
| Operating leases | |
| 4.85 | % | |
| 4.85 | % |
| Finance Leases | |
| 5.86 | % | |
| 3.41 | % |
|
| Schedule of Future Minimum Payments Required Under Maturities of Lease Liabilities |
Maturities
of lease liabilities for each of the succeeding fiscal years are as follows:
Schedule
of Future Minimum Payments Required Under Maturities of Lease Liabilities
| For the Twelve months ended January 31, | |
| |
| 2024 | |
$ | 486,910 | |
| 2025 | |
| 951,205 | |
| 2026 | |
| 847,464 | |
| 2027 | |
| 691,145 | |
| 2028 | |
| 713,501 | |
| Thereafter | |
| 1,454,059 | |
| Total lease payments | |
$ | 5,144,284 | |
| Less: amounts representing interest | |
| (748,544 | ) |
| Total lease obligations | |
$ | 4,395,740 | |
|
| X |
- References
+ Details
| Name: |
MAMA_DisclosureLeasesAbstract |
| Namespace Prefix: |
MAMA_ |
| Data Type: |
xbrli:stringItemType |
| Balance Type: |
na |
| Period Type: |
duration |
|
| X |
- DefinitionSchedule of Supplemental Cash Flow and Other Information Related to Leases [Table Text Block]
| Name: |
MAMA_ScheduleOfSupplementalCashFlowAndOtherInformationRelatedToLeasesTableTextBlock |
| Namespace Prefix: |
MAMA_ |
| Data Type: |
dtr-types:textBlockItemType |
| Balance Type: |
na |
| Period Type: |
duration |
|
| X |
- DefinitionTabular disclosure of undiscounted cash flows of lessee's operating lease liability. Includes, but is not limited to, reconciliation of undiscounted cash flows to operating lease liability recognized in statement of financial position. Reference 1: http://www.xbrl.org/2009/role/commonPracticeRef
-Topic 842
-SubTopic 20
-Name Accounting Standards Codification
-Section 50
-Paragraph 6
-Publisher FASB
-URI https://asc.fasb.org//1943274/2147478964/842-20-50-6
| Name: |
us-gaap_LesseeOperatingLeaseLiabilityMaturityTableTextBlock |
| Namespace Prefix: |
us-gaap_ |
| Data Type: |
dtr-types:textBlockItemType |
| Balance Type: |
na |
| Period Type: |
duration |
|
v3.23.2
Schedule of Results of Operations (Details) - USD ($)
|
3 Months Ended |
5 Months Ended |
6 Months Ended |
Jul. 31, 2023 |
Jul. 31, 2022 |
Jun. 28, 2023 |
Jul. 31, 2023 |
Jul. 31, 2022 |
| Restructuring Cost and Reserve [Line Items] |
|
|
|
|
|
| Revenues |
$ 24,790,085
|
$ 22,846,474
|
|
$ 47,910,901
|
$ 44,677,054
|
| Net income |
$ 1,743,911
|
$ (743,246)
|
|
$ 3,144,837
|
$ (639,549)
|
| Chef Inspirational Foods, Inc. [Member] |
|
|
|
|
|
| Restructuring Cost and Reserve [Line Items] |
|
|
|
|
|
| Revenues |
|
|
$ 13,720,817
|
|
|
| Net income |
|
|
$ 930,592
|
|
|
| X |
- DefinitionThe portion of profit or loss for the period, net of income taxes, which is attributable to the parent. Reference 1: http://www.xbrl.org/2003/role/disclosureRef
-Topic 235
-SubTopic 10
-Name Accounting Standards Codification
-Section S99
-Paragraph 1
-Subparagraph (SX 210.4-08(g)(1)(ii))
-Publisher FASB
-URI https://asc.fasb.org//1943274/2147480678/235-10-S99-1
Reference 2: http://www.xbrl.org/2003/role/disclosureRef
-Topic 323
-SubTopic 10
-Name Accounting Standards Codification
-Section 50
-Paragraph 3
-Subparagraph (c)
-Publisher FASB
-URI https://asc.fasb.org//1943274/2147481687/323-10-50-3
Reference 3: http://www.xbrl.org/2003/role/disclosureRef
-Topic 825
-SubTopic 10
-Name Accounting Standards Codification
-Section 50
-Paragraph 28
-Subparagraph (f)
-Publisher FASB
-URI https://asc.fasb.org//1943274/2147482907/825-10-50-28
Reference 4: http://www.xbrl.org/2003/role/disclosureRef
-Topic 220
-SubTopic 10
-Name Accounting Standards Codification
-Section 50
-Paragraph 6
-Publisher FASB
-URI https://asc.fasb.org//1943274/2147482765/220-10-50-6
Reference 5: http://www.xbrl.org/2003/role/disclosureRef
-Topic 250
-SubTopic 10
-Name Accounting Standards Codification
-Section 50
-Paragraph 3
-Publisher FASB
-URI https://asc.fasb.org//1943274/2147483443/250-10-50-3
Reference 6: http://www.xbrl.org/2003/role/disclosureRef
-Topic 250
-SubTopic 10
-Name Accounting Standards Codification
-Section 50
-Paragraph 1
-Subparagraph (b)(2)
-Publisher FASB
-URI https://asc.fasb.org//1943274/2147483443/250-10-50-1
Reference 7: http://www.xbrl.org/2003/role/disclosureRef
-Topic 815
-SubTopic 40
-Name Accounting Standards Codification
-Section 65
-Paragraph 1
-Subparagraph (f)
-Publisher FASB
-URI https://asc.fasb.org//1943274/2147480175/815-40-65-1
Reference 8: http://www.xbrl.org/2003/role/disclosureRef
-Topic 250
-SubTopic 10
-Name Accounting Standards Codification
-Section 50
-Paragraph 8
-Publisher FASB
-URI https://asc.fasb.org//1943274/2147483443/250-10-50-8
Reference 9: http://www.xbrl.org/2003/role/disclosureRef
-Topic 250
-SubTopic 10
-Name Accounting Standards Codification
-Section 50
-Paragraph 9
-Publisher FASB
-URI https://asc.fasb.org//1943274/2147483443/250-10-50-9
Reference 10: http://www.xbrl.org/2003/role/disclosureRef
-Topic 250
-SubTopic 10
-Name Accounting Standards Codification
-Section 50
-Paragraph 11
-Subparagraph (a)
-Publisher FASB
-URI https://asc.fasb.org//1943274/2147483443/250-10-50-11
Reference 11: http://www.xbrl.org/2003/role/disclosureRef
-Topic 250
-SubTopic 10
-Name Accounting Standards Codification
-Section 50
-Paragraph 11
-Subparagraph (b)
-Publisher FASB
-URI https://asc.fasb.org//1943274/2147483443/250-10-50-11
Reference 12: http://www.xbrl.org/2003/role/disclosureRef
-Topic 250
-SubTopic 10
-Name Accounting Standards Codification
-Section 50
-Paragraph 4
-Publisher FASB
-URI https://asc.fasb.org//1943274/2147483443/250-10-50-4
Reference 13: http://www.xbrl.org/2003/role/exampleRef
-Topic 946
-SubTopic 830
-Name Accounting Standards Codification
-Section 55
-Paragraph 10
-Publisher FASB
-URI https://asc.fasb.org//1943274/2147480167/946-830-55-10
Reference 14: http://www.xbrl.org/2003/role/disclosureRef
-Topic 946
-SubTopic 220
-Name Accounting Standards Codification
-Section 45
-Paragraph 7
-Publisher FASB
-URI https://asc.fasb.org//1943274/2147483581/946-220-45-7
Reference 15: http://www.xbrl.org/2003/role/disclosureRef
-Topic 944
-SubTopic 220
-Name Accounting Standards Codification
-Section S99
-Paragraph 1
-Subparagraph (SX 210.7-04(18))
-Publisher FASB
-URI https://asc.fasb.org//1943274/2147483586/944-220-S99-1
Reference 16: http://www.xbrl.org/2003/role/disclosureRef
-Topic 280
-SubTopic 10
-Name Accounting Standards Codification
-Section 50
-Paragraph 22
-Publisher FASB
-URI https://asc.fasb.org//1943274/2147482810/280-10-50-22
Reference 17: http://www.xbrl.org/2003/role/disclosureRef
-Topic 946
-SubTopic 220
-Name Accounting Standards Codification
-Section S99
-Paragraph 1
-Subparagraph (SX 210.6-07(9))
-Publisher FASB
-URI https://asc.fasb.org//1943274/2147483575/946-220-S99-1
Reference 18: http://www.xbrl.org/2003/role/disclosureRef
-Topic 946
-SubTopic 220
-Name Accounting Standards Codification
-Section S99
-Paragraph 3
-Subparagraph (SX 210.6-09(1)(d))
-Publisher FASB
-URI https://asc.fasb.org//1943274/2147483575/946-220-S99-3
Reference 19: http://www.xbrl.org/2003/role/disclosureRef
-Topic 470
-SubTopic 10
-Name Accounting Standards Codification
-Section S99
-Paragraph 1A
-Subparagraph (SX 210.13-01(a)(4)(i))
-Publisher FASB
-URI https://asc.fasb.org//1943274/2147480097/470-10-S99-1A
Reference 20: http://www.xbrl.org/2009/role/commonPracticeRef
-Topic 470
-SubTopic 10
-Name Accounting Standards Codification
-Section S99
-Paragraph 1A
-Subparagraph (SX 210.13-01(a)(4)(ii))
-Publisher FASB
-URI https://asc.fasb.org//1943274/2147480097/470-10-S99-1A
Reference 21: http://www.xbrl.org/2003/role/disclosureRef
-Topic 470
-SubTopic 10
-Name Accounting Standards Codification
-Section S99
-Paragraph 1A
-Subparagraph (SX 210.13-01(a)(4)(iii)(A))
-Publisher FASB
-URI https://asc.fasb.org//1943274/2147480097/470-10-S99-1A
Reference 22: http://www.xbrl.org/2003/role/disclosureRef
-Topic 470
-SubTopic 10
-Name Accounting Standards Codification
-Section S99
-Paragraph 1A
-Subparagraph (SX 210.13-01(a)(4)(iv))
-Publisher FASB
-URI https://asc.fasb.org//1943274/2147480097/470-10-S99-1A
Reference 23: http://www.xbrl.org/2003/role/disclosureRef
-Topic 470
-SubTopic 10
-Name Accounting Standards Codification
-Section S99
-Paragraph 1A
-Subparagraph (SX 210.13-01(a)(5))
-Publisher FASB
-URI https://asc.fasb.org//1943274/2147480097/470-10-S99-1A
Reference 24: http://www.xbrl.org/2003/role/disclosureRef
-Topic 470
-SubTopic 10
-Name Accounting Standards Codification
-Section S99
-Paragraph 1B
-Subparagraph (SX 210.13-02(a)(4)(i))
-Publisher FASB
-URI https://asc.fasb.org//1943274/2147480097/470-10-S99-1B
Reference 25: http://www.xbrl.org/2003/role/disclosureRef
-Topic 470
-SubTopic 10
-Name Accounting Standards Codification
-Section S99
-Paragraph 1B
-Subparagraph (SX 210.13-02(a)(4)(iii)(A))
-Publisher FASB
-URI https://asc.fasb.org//1943274/2147480097/470-10-S99-1B
Reference 26: http://www.xbrl.org/2003/role/disclosureRef
-Topic 470
-SubTopic 10
-Name Accounting Standards Codification
-Section S99
-Paragraph 1B
-Subparagraph (SX 210.13-02(a)(4)(iii)(B))
-Publisher FASB
-URI https://asc.fasb.org//1943274/2147480097/470-10-S99-1B
Reference 27: http://www.xbrl.org/2003/role/disclosureRef
-Topic 470
-SubTopic 10
-Name Accounting Standards Codification
-Section S99
-Paragraph 1B
-Subparagraph (SX 210.13-02(a)(4)(iv))
-Publisher FASB
-URI https://asc.fasb.org//1943274/2147480097/470-10-S99-1B
Reference 28: http://www.xbrl.org/2003/role/disclosureRef
-Topic 470
-SubTopic 10
-Name Accounting Standards Codification
-Section S99
-Paragraph 1B
-Subparagraph (SX 210.13-02(a)(5))
-Publisher FASB
-URI https://asc.fasb.org//1943274/2147480097/470-10-S99-1B
Reference 29: http://www.xbrl.org/2003/role/disclosureRef
-Topic 280
-SubTopic 10
-Name Accounting Standards Codification
-Section 50
-Paragraph 30
-Subparagraph (b)
-Publisher FASB
-URI https://asc.fasb.org//1943274/2147482810/280-10-50-30
Reference 30: http://www.xbrl.org/2003/role/disclosureRef
-Topic 280
-SubTopic 10
-Name Accounting Standards Codification
-Section 50
-Paragraph 32
-Subparagraph (f)
-Publisher FASB
-URI https://asc.fasb.org//1943274/2147482810/280-10-50-32
Reference 31: http://www.xbrl.org/2003/role/disclosureRef
-Topic 260
-SubTopic 10
-Name Accounting Standards Codification
-Section 45
-Paragraph 60B
-Subparagraph (a)
-Publisher FASB
-URI https://asc.fasb.org//1943274/2147482689/260-10-45-60B
Reference 32: http://www.xbrl.org/2003/role/exampleRef
-Topic 280
-SubTopic 10
-Name Accounting Standards Codification
-Section 50
-Paragraph 31
-Publisher FASB
-URI https://asc.fasb.org//1943274/2147482810/280-10-50-31
Reference 33: http://www.xbrl.org/2003/role/disclosureRef
-Topic 280
-SubTopic 10
-Name Accounting Standards Codification
-Section 50
-Paragraph 32
-Subparagraph (c)
-Publisher FASB
-URI https://asc.fasb.org//1943274/2147482810/280-10-50-32
Reference 34: http://www.xbrl.org/2003/role/disclosureRef
-Topic 205
-SubTopic 20
-Name Accounting Standards Codification
-Section 50
-Paragraph 7
-Publisher FASB
-URI https://asc.fasb.org//1943274/2147483499/205-20-50-7
Reference 35: http://fasb.org/us-gaap/role/ref/legacyRef
-Topic 230
-SubTopic 10
-Name Accounting Standards Codification
-Section 45
-Paragraph 28
-Publisher FASB
-URI https://asc.fasb.org//1943274/2147482740/230-10-45-28
Reference 36: http://www.xbrl.org/2003/role/disclosureRef
-Topic 220
-SubTopic 10
-Name Accounting Standards Codification
-Section 45
-Paragraph 1A
-Subparagraph (a)
-Publisher FASB
-URI https://asc.fasb.org//1943274/2147482790/220-10-45-1A
Reference 37: http://www.xbrl.org/2003/role/disclosureRef
-Topic 220
-SubTopic 10
-Name Accounting Standards Codification
-Section 45
-Paragraph 1B
-Subparagraph (a)
-Publisher FASB
-URI https://asc.fasb.org//1943274/2147482790/220-10-45-1B
Reference 38: http://fasb.org/us-gaap/role/ref/legacyRef
-Topic 220
-SubTopic 10
-Name Accounting Standards Codification
-Section S99
-Paragraph 2
-Subparagraph (SX 210.5-03(20))
-Publisher FASB
-URI https://asc.fasb.org//1943274/2147483621/220-10-S99-2
Reference 39: http://fasb.org/us-gaap/role/ref/legacyRef
-Topic 942
-SubTopic 220
-Name Accounting Standards Codification
-Section S99
-Paragraph 1
-Subparagraph (SX 210.9-04(22))
-Publisher FASB
-URI https://asc.fasb.org//1943274/2147483589/942-220-S99-1
| Name: |
us-gaap_NetIncomeLoss |
| Namespace Prefix: |
us-gaap_ |
| Data Type: |
xbrli:monetaryItemType |
| Balance Type: |
credit |
| Period Type: |
duration |
|
| X |
- DefinitionLine items represent financial concepts included in a table. These concepts are used to disclose reportable information associated with domain members defined in one or many axes to the table. Reference 1: http://www.xbrl.org/2003/role/disclosureRef
-Topic 420
-SubTopic 10
-Name Accounting Standards Codification
-Section 50
-Paragraph 1
-Subparagraph (c)
-Publisher FASB
-URI https://asc.fasb.org//1943274/2147482017/420-10-50-1
Reference 2: http://www.xbrl.org/2003/role/disclosureRef
-Topic 420
-SubTopic 10
-Name Accounting Standards Codification
-Section 50
-Paragraph 1
-Subparagraph (b)(2)
-Publisher FASB
-URI https://asc.fasb.org//1943274/2147482017/420-10-50-1
Reference 3: http://www.xbrl.org/2003/role/disclosureRef
-Topic 420
-SubTopic 10
-Name Accounting Standards Codification
-Section 50
-Paragraph 1
-Subparagraph (b)(1)
-Publisher FASB
-URI https://asc.fasb.org//1943274/2147482017/420-10-50-1
Reference 4: http://www.xbrl.org/2003/role/disclosureRef
-Topic 420
-SubTopic 10
-Name Accounting Standards Codification
-Section S99
-Paragraph 2
-Subparagraph (SAB Topic 5.P.4(b)(2))
-Publisher FASB
-URI https://asc.fasb.org//1943274/2147479823/420-10-S99-2
Reference 5: http://www.xbrl.org/2003/role/disclosureRef
-Topic 420
-SubTopic 10
-Name Accounting Standards Codification
-Section S99
-Paragraph 2
-Subparagraph (SAB Topic 5.P.4(b)(1))
-Publisher FASB
-URI https://asc.fasb.org//1943274/2147479823/420-10-S99-2
Reference 6: http://www.xbrl.org/2003/role/disclosureRef
-Topic 420
-SubTopic 10
-Name Accounting Standards Codification
-Section S99
-Paragraph 2
-Subparagraph (SAB Topic 5.P.4(d))
-Publisher FASB
-URI https://asc.fasb.org//1943274/2147479823/420-10-S99-2
Reference 7: http://www.xbrl.org/2003/role/disclosureRef
-Topic 420
-SubTopic 10
-Name Accounting Standards Codification
-Section 50
-Paragraph 1
-Subparagraph (d)
-Publisher FASB
-URI https://asc.fasb.org//1943274/2147482017/420-10-50-1
| Name: |
us-gaap_RestructuringCostAndReserveLineItems |
| Namespace Prefix: |
us-gaap_ |
| Data Type: |
xbrli:stringItemType |
| Balance Type: |
na |
| Period Type: |
duration |
|
| X |
- DefinitionAmount, excluding tax collected from customer, of revenue from satisfaction of performance obligation by transferring promised good or service to customer. Tax collected from customer is tax assessed by governmental authority that is both imposed on and concurrent with specific revenue-producing transaction, including, but not limited to, sales, use, value added and excise. Reference 1: http://www.xbrl.org/2003/role/disclosureRef
-Topic 924
-SubTopic 10
-Name Accounting Standards Codification
-Section S99
-Paragraph 1
-Subparagraph (SAB Topic 11.L)
-Publisher FASB
-URI https://asc.fasb.org//1943274/2147479941/924-10-S99-1
Reference 2: http://www.xbrl.org/2003/role/disclosureRef
-Topic 606
-SubTopic 10
-Name Accounting Standards Codification
-Section 50
-Paragraph 5
-Publisher FASB
-URI https://asc.fasb.org//1943274/2147479806/606-10-50-5
Reference 3: http://www.xbrl.org/2003/role/disclosureRef
-Topic 280
-SubTopic 10
-Name Accounting Standards Codification
-Section 50
-Paragraph 30
-Subparagraph (a)
-Publisher FASB
-URI https://asc.fasb.org//1943274/2147482810/280-10-50-30
Reference 4: http://www.xbrl.org/2003/role/disclosureRef
-Topic 280
-SubTopic 10
-Name Accounting Standards Codification
-Section 50
-Paragraph 42
-Publisher FASB
-URI https://asc.fasb.org//1943274/2147482810/280-10-50-42
Reference 5: http://www.xbrl.org/2003/role/disclosureRef
-Topic 280
-SubTopic 10
-Name Accounting Standards Codification
-Section 50
-Paragraph 22
-Subparagraph (b)
-Publisher FASB
-URI https://asc.fasb.org//1943274/2147482810/280-10-50-22
Reference 6: http://www.xbrl.org/2003/role/disclosureRef
-Topic 280
-SubTopic 10
-Name Accounting Standards Codification
-Section 50
-Paragraph 32
-Subparagraph (b)
-Publisher FASB
-URI https://asc.fasb.org//1943274/2147482810/280-10-50-32
Reference 7: http://www.xbrl.org/2003/role/disclosureRef
-Topic 280
-SubTopic 10
-Name Accounting Standards Codification
-Section 50
-Paragraph 40
-Publisher FASB
-URI https://asc.fasb.org//1943274/2147482810/280-10-50-40
Reference 8: http://www.xbrl.org/2003/role/disclosureRef
-Topic 280
-SubTopic 10
-Name Accounting Standards Codification
-Section 50
-Paragraph 22
-Subparagraph (a)
-Publisher FASB
-URI https://asc.fasb.org//1943274/2147482810/280-10-50-22
Reference 9: http://www.xbrl.org/2003/role/disclosureRef
-Topic 280
-SubTopic 10
-Name Accounting Standards Codification
-Section 50
-Paragraph 32
-Subparagraph (a)
-Publisher FASB
-URI https://asc.fasb.org//1943274/2147482810/280-10-50-32
Reference 10: http://www.xbrl.org/2003/role/disclosureRef
-Topic 280
-SubTopic 10
-Name Accounting Standards Codification
-Section 50
-Paragraph 41
-Subparagraph (a)
-Publisher FASB
-URI https://asc.fasb.org//1943274/2147482810/280-10-50-41
Reference 11: http://www.xbrl.org/2003/role/disclosureRef
-Topic 606
-SubTopic 10
-Name Accounting Standards Codification
-Section 50
-Paragraph 4
-Subparagraph (a)
-Publisher FASB
-URI https://asc.fasb.org//1943274/2147479806/606-10-50-4
| Name: |
us-gaap_RevenueFromContractWithCustomerExcludingAssessedTax |
| Namespace Prefix: |
us-gaap_ |
| Data Type: |
xbrli:monetaryItemType |
| Balance Type: |
credit |
| Period Type: |
duration |
|
| X |
- Details
| Name: |
us-gaap_BusinessAcquisitionAxis=MAMA_ChefInspirationalFoodsIncMember |
| Namespace Prefix: |
|
| Data Type: |
na |
| Balance Type: |
|
| Period Type: |
|
|
v3.23.2
Nature of Operations and Basis of Presentation (Details Narrative) - Chef Inspirational Foods, Inc. [Member]
|
Jun. 28, 2022
USD ($)
|
| Restructuring Cost and Reserve [Line Items] |
|
| Minority interest rate |
24.00%
|
| Investments |
$ 1,200,000
|
| Investments in cash |
500,000
|
| Investments in common stock |
$ 700,000
|
| Option to purchase remaining interest rate |
76.00%
|
| Two Year From Acquisition Date [Member] |
|
| Restructuring Cost and Reserve [Line Items] |
|
| Investments |
$ 3,650,000
|
| Investments in cash |
950,000
|
| Promissory note |
2,700,000
|
| First Anniversary [Member] |
|
| Restructuring Cost and Reserve [Line Items] |
|
| Promissory note principal payment |
1,200,000
|
| Second Anniversary [Member] |
|
| Restructuring Cost and Reserve [Line Items] |
|
| Promissory note principal payment |
$ 1,500,000
|
| X |
- DefinitionValue of equity interests (such as common shares, preferred shares, or partnership interest) issued or issuable to acquire the entity. Reference 1: http://fasb.org/us-gaap/role/ref/legacyRef
-Topic 805
-SubTopic 30
-Name Accounting Standards Codification
-Section 50
-Paragraph 1
-Subparagraph (b)(4)
-Publisher FASB
-URI https://asc.fasb.org//1943274/2147479581/805-30-50-1
| Name: |
us-gaap_BusinessAcquisitionEquityInterestIssuedOrIssuableValueAssigned |
| Namespace Prefix: |
us-gaap_ |
| Data Type: |
xbrli:monetaryItemType |
| Balance Type: |
credit |
| Period Type: |
instant |
|
| X |
- DefinitionPercentage of voting equity interests acquired at the acquisition date in the business combination. Reference 1: http://fasb.org/us-gaap/role/ref/legacyRef
-Name Accounting Standards Codification
-Topic 805
-SubTopic 10
-Section 50
-Paragraph 2
-Subparagraph (c)
-Publisher FASB
-URI https://asc.fasb.org//1943274/2147479328/805-10-50-2
| Name: |
us-gaap_BusinessAcquisitionPercentageOfVotingInterestsAcquired |
| Namespace Prefix: |
us-gaap_ |
| Data Type: |
dtr-types:percentItemType |
| Balance Type: |
na |
| Period Type: |
instant |
|
| X |
- DefinitionPercentage of equity in the acquiree held by the acquirer immediately before the acquisition date in a business combination.
| Name: |
us-gaap_BusinessCombinationStepAcquisitionEquityInterestInAcquireePercentage |
| Namespace Prefix: |
us-gaap_ |
| Data Type: |
dtr-types:percentItemType |
| Balance Type: |
na |
| Period Type: |
instant |
|
| X |
- DefinitionSum of the carrying amounts as of the balance sheet date of all investments. Reference 1: http://www.xbrl.org/2003/role/disclosureRef
-Topic 944
-SubTopic 210
-Name Accounting Standards Codification
-Section S99
-Paragraph 1
-Subparagraph (SX 210.7-03(a)(1)(h))
-Publisher FASB
-URI https://asc.fasb.org//1943274/2147479440/944-210-S99-1
| Name: |
us-gaap_Investments |
| Namespace Prefix: |
us-gaap_ |
| Data Type: |
xbrli:monetaryItemType |
| Balance Type: |
debit |
| Period Type: |
instant |
|
| X |
- DefinitionIncluding the current and noncurrent portions, aggregate carrying amount of all types of notes payable, as of the balance sheet date, with initial maturities beyond one year or beyond the normal operating cycle, if longer. Reference 1: http://fasb.org/us-gaap/role/ref/legacyRef
-Name Accounting Standards Codification
-Section S99
-Paragraph 1
-Subparagraph (SX 210.5-02(22))
-SubTopic 10
-Topic 210
-Publisher FASB
-URI https://asc.fasb.org//1943274/2147480566/210-10-S99-1
Reference 2: http://www.xbrl.org/2009/role/commonPracticeRef
-Topic 944
-SubTopic 210
-Name Accounting Standards Codification
-Section S99
-Paragraph 1
-Subparagraph (SX 210.7-03(a)(16)(a)(2))
-Publisher FASB
-URI https://asc.fasb.org//1943274/2147479440/944-210-S99-1
Reference 3: http://fasb.org/us-gaap/role/ref/legacyRef
-Topic 942
-SubTopic 210
-Name Accounting Standards Codification
-Section S99
-Paragraph 1
-Subparagraph (SX 210.9-03(16))
-Publisher FASB
-URI https://asc.fasb.org//1943274/2147479853/942-210-S99-1
| Name: |
us-gaap_NotesPayable |
| Namespace Prefix: |
us-gaap_ |
| Data Type: |
xbrli:monetaryItemType |
| Balance Type: |
credit |
| Period Type: |
instant |
|
| X |
- DefinitionThe cash outflow associated with the acquisition of business during the period. The cash portion only of the acquisition price. Reference 1: http://www.xbrl.org/2003/role/disclosureRef
-Topic 805
-SubTopic 30
-Name Accounting Standards Codification
-Section 50
-Paragraph 1
-Subparagraph (b)(1)
-Publisher FASB
-URI https://asc.fasb.org//1943274/2147479581/805-30-50-1
Reference 2: http://fasb.org/us-gaap/role/ref/legacyRef
-Name Accounting Standards Codification
-Topic 230
-SubTopic 10
-Section 45
-Paragraph 13
-Subparagraph (b)
-Publisher FASB
-URI https://asc.fasb.org//1943274/2147482740/230-10-45-13
| Name: |
us-gaap_PaymentsToAcquireBusinessesGross |
| Namespace Prefix: |
us-gaap_ |
| Data Type: |
xbrli:monetaryItemType |
| Balance Type: |
credit |
| Period Type: |
duration |
|
| X |
- DefinitionThe cash inflow from a borrowing supported by a written promise to pay an obligation. Reference 1: http://fasb.org/us-gaap/role/ref/legacyRef
-Name Accounting Standards Codification
-Topic 230
-SubTopic 10
-Section 45
-Paragraph 14
-Subparagraph (b)
-Publisher FASB
-URI https://asc.fasb.org//1943274/2147482740/230-10-45-14
| Name: |
us-gaap_ProceedsFromNotesPayable |
| Namespace Prefix: |
us-gaap_ |
| Data Type: |
xbrli:monetaryItemType |
| Balance Type: |
debit |
| Period Type: |
duration |
|
| X |
- DefinitionLine items represent financial concepts included in a table. These concepts are used to disclose reportable information associated with domain members defined in one or many axes to the table. Reference 1: http://www.xbrl.org/2003/role/disclosureRef
-Topic 420
-SubTopic 10
-Name Accounting Standards Codification
-Section 50
-Paragraph 1
-Subparagraph (c)
-Publisher FASB
-URI https://asc.fasb.org//1943274/2147482017/420-10-50-1
Reference 2: http://www.xbrl.org/2003/role/disclosureRef
-Topic 420
-SubTopic 10
-Name Accounting Standards Codification
-Section 50
-Paragraph 1
-Subparagraph (b)(2)
-Publisher FASB
-URI https://asc.fasb.org//1943274/2147482017/420-10-50-1
Reference 3: http://www.xbrl.org/2003/role/disclosureRef
-Topic 420
-SubTopic 10
-Name Accounting Standards Codification
-Section 50
-Paragraph 1
-Subparagraph (b)(1)
-Publisher FASB
-URI https://asc.fasb.org//1943274/2147482017/420-10-50-1
Reference 4: http://www.xbrl.org/2003/role/disclosureRef
-Topic 420
-SubTopic 10
-Name Accounting Standards Codification
-Section S99
-Paragraph 2
-Subparagraph (SAB Topic 5.P.4(b)(2))
-Publisher FASB
-URI https://asc.fasb.org//1943274/2147479823/420-10-S99-2
Reference 5: http://www.xbrl.org/2003/role/disclosureRef
-Topic 420
-SubTopic 10
-Name Accounting Standards Codification
-Section S99
-Paragraph 2
-Subparagraph (SAB Topic 5.P.4(b)(1))
-Publisher FASB
-URI https://asc.fasb.org//1943274/2147479823/420-10-S99-2
Reference 6: http://www.xbrl.org/2003/role/disclosureRef
-Topic 420
-SubTopic 10
-Name Accounting Standards Codification
-Section S99
-Paragraph 2
-Subparagraph (SAB Topic 5.P.4(d))
-Publisher FASB
-URI https://asc.fasb.org//1943274/2147479823/420-10-S99-2
Reference 7: http://www.xbrl.org/2003/role/disclosureRef
-Topic 420
-SubTopic 10
-Name Accounting Standards Codification
-Section 50
-Paragraph 1
-Subparagraph (d)
-Publisher FASB
-URI https://asc.fasb.org//1943274/2147482017/420-10-50-1
| Name: |
us-gaap_RestructuringCostAndReserveLineItems |
| Namespace Prefix: |
us-gaap_ |
| Data Type: |
xbrli:stringItemType |
| Balance Type: |
na |
| Period Type: |
duration |
|
| X |
- Details
| Name: |
us-gaap_BusinessAcquisitionAxis=MAMA_ChefInspirationalFoodsIncMember |
| Namespace Prefix: |
|
| Data Type: |
na |
| Balance Type: |
|
| Period Type: |
|
|
| X |
- Details
| Name: |
srt_StatementScenarioAxis=MAMA_TwoYearFromAcquisitionDateMember |
| Namespace Prefix: |
|
| Data Type: |
na |
| Balance Type: |
|
| Period Type: |
|
|
| X |
- Details
| Name: |
srt_StatementScenarioAxis=MAMA_FirstAnniversaryMember |
| Namespace Prefix: |
|
| Data Type: |
na |
| Balance Type: |
|
| Period Type: |
|
|
| X |
- Details
| Name: |
srt_StatementScenarioAxis=MAMA_SecondAnniversaryMember |
| Namespace Prefix: |
|
| Data Type: |
na |
| Balance Type: |
|
| Period Type: |
|
|
v3.23.2
Schedule of Inventories (Details) - USD ($)
|
Jul. 31, 2023 |
Jan. 31, 2023 |
| Accounting Policies [Abstract] |
|
|
| Raw materials and packaging |
$ 1,495,179
|
$ 1,883,270
|
| Work in process |
200,437
|
98,910
|
| Finished goods |
1,612,897
|
1,653,701
|
| Total |
$ 3,308,513
|
$ 3,635,881
|
| X |
- References
+ Details
| Name: |
us-gaap_AccountingPoliciesAbstract |
| Namespace Prefix: |
us-gaap_ |
| Data Type: |
xbrli:stringItemType |
| Balance Type: |
na |
| Period Type: |
duration |
|
| X |
- DefinitionAmount before valuation and LIFO reserves of completed merchandise or goods expected to be sold within one year or operating cycle, if longer. Reference 1: http://www.xbrl.org/2009/role/commonPracticeRef
-Topic 210
-SubTopic 10
-Name Accounting Standards Codification
-Section S99
-Paragraph 1
-Subparagraph (SX 210.5-02(6)(a)(1))
-Publisher FASB
-URI https://asc.fasb.org//1943274/2147480566/210-10-S99-1
| Name: |
us-gaap_InventoryFinishedGoods |
| Namespace Prefix: |
us-gaap_ |
| Data Type: |
xbrli:monetaryItemType |
| Balance Type: |
debit |
| Period Type: |
instant |
|
| X |
- DefinitionAmount after valuation and LIFO reserves of inventory expected to be sold, or consumed within one year or operating cycle, if longer. Reference 1: http://www.xbrl.org/2003/role/exampleRef
-Topic 852
-SubTopic 10
-Name Accounting Standards Codification
-Section 55
-Paragraph 10
-Publisher FASB
-URI https://asc.fasb.org//1943274/2147481372/852-10-55-10
Reference 2: http://www.xbrl.org/2003/role/exampleRef
-Topic 210
-SubTopic 10
-Name Accounting Standards Codification
-Section 45
-Paragraph 1
-Subparagraph (b)
-Publisher FASB
-URI https://asc.fasb.org//1943274/2147483467/210-10-45-1
Reference 3: http://www.xbrl.org/2003/role/disclosureRef
-Topic 210
-SubTopic 10
-Name Accounting Standards Codification
-Section S99
-Paragraph 1
-Subparagraph (SX 210.5-02(6))
-Publisher FASB
-URI https://asc.fasb.org//1943274/2147480566/210-10-S99-1
| Name: |
us-gaap_InventoryNet |
| Namespace Prefix: |
us-gaap_ |
| Data Type: |
xbrli:monetaryItemType |
| Balance Type: |
debit |
| Period Type: |
instant |
|
| X |
- DefinitionGross amount of unprocessed materials to be used in manufacturing or production process and supplies that will be consumed. Reference 1: http://www.xbrl.org/2009/role/commonPracticeRef
-Topic 210
-SubTopic 10
-Name Accounting Standards Codification
-Section S99
-Paragraph 1
-Subparagraph (SX 210.5-02(6))
-Publisher FASB
-URI https://asc.fasb.org//1943274/2147480566/210-10-S99-1
| Name: |
us-gaap_InventoryRawMaterialsAndSupplies |
| Namespace Prefix: |
us-gaap_ |
| Data Type: |
xbrli:monetaryItemType |
| Balance Type: |
debit |
| Period Type: |
instant |
|
| X |
- DefinitionAmount before valuation and LIFO reserves of merchandise or goods in the production process expected to be completed within one year or operating cycle, if longer. Reference 1: http://www.xbrl.org/2009/role/commonPracticeRef
-Topic 210
-SubTopic 10
-Name Accounting Standards Codification
-Section S99
-Paragraph 1
-Subparagraph (SX 210.5-02(6)(a)(3))
-Publisher FASB
-URI https://asc.fasb.org//1943274/2147480566/210-10-S99-1
| Name: |
us-gaap_InventoryWorkInProcess |
| Namespace Prefix: |
us-gaap_ |
| Data Type: |
xbrli:monetaryItemType |
| Balance Type: |
debit |
| Period Type: |
instant |
|
v3.23.2
| X |
- DefinitionLine items represent financial concepts included in a table. These concepts are used to disclose reportable information associated with domain members defined in one or many axes to the table.
| Name: |
us-gaap_PropertyPlantAndEquipmentLineItems |
| Namespace Prefix: |
us-gaap_ |
| Data Type: |
xbrli:stringItemType |
| Balance Type: |
na |
| Period Type: |
duration |
|
| X |
- DefinitionUseful life of long lived, physical assets used in the normal conduct of business and not intended for resale, in 'PnYnMnDTnHnMnS' format, for example, 'P1Y5M13D' represents the reported fact of one year, five months, and thirteen days. Examples include, but not limited to, land, buildings, machinery and equipment, office equipment, furniture and fixtures, and computer equipment.
| Name: |
us-gaap_PropertyPlantAndEquipmentUsefulLife |
| Namespace Prefix: |
us-gaap_ |
| Data Type: |
xbrli:durationItemType |
| Balance Type: |
na |
| Period Type: |
instant |
|
| X |
- Details
| Name: |
us-gaap_PropertyPlantAndEquipmentByTypeAxis=us-gaap_LeaseholdImprovementsMember |
| Namespace Prefix: |
|
| Data Type: |
na |
| Balance Type: |
|
| Period Type: |
|
|
| X |
- Details
| Name: |
srt_RangeAxis=srt_MinimumMember |
| Namespace Prefix: |
|
| Data Type: |
na |
| Balance Type: |
|
| Period Type: |
|
|
| X |
- Details
| Name: |
us-gaap_PropertyPlantAndEquipmentByTypeAxis=us-gaap_MachineryAndEquipmentMember |
| Namespace Prefix: |
|
| Data Type: |
na |
| Balance Type: |
|
| Period Type: |
|
|
| X |
- Details
| Name: |
us-gaap_PropertyPlantAndEquipmentByTypeAxis=us-gaap_FurnitureAndFixturesMember |
| Namespace Prefix: |
|
| Data Type: |
na |
| Balance Type: |
|
| Period Type: |
|
|
| X |
- Details
| Name: |
srt_RangeAxis=srt_MaximumMember |
| Namespace Prefix: |
|
| Data Type: |
na |
| Balance Type: |
|
| Period Type: |
|
|
v3.23.2
| X |
- DefinitionUseful life of finite-lived intangible assets, in 'PnYnMnDTnHnMnS' format, for example, 'P1Y5M13D' represents the reported fact of one year, five months, and thirteen days.
| Name: |
us-gaap_FiniteLivedIntangibleAssetUsefulLife |
| Namespace Prefix: |
us-gaap_ |
| Data Type: |
xbrli:durationItemType |
| Balance Type: |
na |
| Period Type: |
instant |
|
| X |
- DefinitionLine items represent financial concepts included in a table. These concepts are used to disclose reportable information associated with domain members defined in one or many axes to the table.
| Name: |
us-gaap_PropertyPlantAndEquipmentLineItems |
| Namespace Prefix: |
us-gaap_ |
| Data Type: |
xbrli:stringItemType |
| Balance Type: |
na |
| Period Type: |
duration |
|
| X |
- Details
| Name: |
us-gaap_FiniteLivedIntangibleAssetsByMajorClassAxis=us-gaap_TrademarksAndTradeNamesMember |
| Namespace Prefix: |
|
| Data Type: |
na |
| Balance Type: |
|
| Period Type: |
|
|
| X |
- Details
| Name: |
us-gaap_FiniteLivedIntangibleAssetsByMajorClassAxis=us-gaap_CustomerRelationshipsMember |
| Namespace Prefix: |
|
| Data Type: |
na |
| Balance Type: |
|
| Period Type: |
|
|
| X |
- Details
| Name: |
srt_RangeAxis=srt_MinimumMember |
| Namespace Prefix: |
|
| Data Type: |
na |
| Balance Type: |
|
| Period Type: |
|
|
| X |
- Details
| Name: |
srt_RangeAxis=srt_MaximumMember |
| Namespace Prefix: |
|
| Data Type: |
na |
| Balance Type: |
|
| Period Type: |
|
|
v3.23.2
Schedule of Expenses of Slotting Fees, Sales Discounts and Allowances are Accounted as Direct Reduction of Revenues (Details) - USD ($)
|
3 Months Ended |
6 Months Ended |
Jul. 31, 2023 |
Jul. 31, 2022 |
Jul. 31, 2023 |
Jul. 31, 2022 |
| Accounting Policies [Abstract] |
|
|
|
|
| Gross Sales |
$ 25,414,735
|
$ 23,631,857
|
$ 49,014,645
|
$ 45,980,449
|
| Less: Slotting, Discounts, Allowances |
624,650
|
785,383
|
1,103,744
|
1,303,395
|
| Net Sales |
$ 24,790,085
|
$ 22,846,474
|
$ 47,910,901
|
$ 44,677,054
|
| X |
- DefinitionSales discount returns and allowances goods.
| Name: |
MAMA_SalesDiscountReturnsAndAllowancesGoods |
| Namespace Prefix: |
MAMA_ |
| Data Type: |
xbrli:monetaryItemType |
| Balance Type: |
debit |
| Period Type: |
duration |
|
| X |
- References
+ Details
| Name: |
us-gaap_AccountingPoliciesAbstract |
| Namespace Prefix: |
us-gaap_ |
| Data Type: |
xbrli:stringItemType |
| Balance Type: |
na |
| Period Type: |
duration |
|
| X |
- DefinitionAmount, excluding tax collected from customer, of revenue from satisfaction of performance obligation by transferring promised good or service to customer. Tax collected from customer is tax assessed by governmental authority that is both imposed on and concurrent with specific revenue-producing transaction, including, but not limited to, sales, use, value added and excise. Reference 1: http://www.xbrl.org/2003/role/disclosureRef
-Topic 924
-SubTopic 10
-Name Accounting Standards Codification
-Section S99
-Paragraph 1
-Subparagraph (SAB Topic 11.L)
-Publisher FASB
-URI https://asc.fasb.org//1943274/2147479941/924-10-S99-1
Reference 2: http://www.xbrl.org/2003/role/disclosureRef
-Topic 606
-SubTopic 10
-Name Accounting Standards Codification
-Section 50
-Paragraph 5
-Publisher FASB
-URI https://asc.fasb.org//1943274/2147479806/606-10-50-5
Reference 3: http://www.xbrl.org/2003/role/disclosureRef
-Topic 280
-SubTopic 10
-Name Accounting Standards Codification
-Section 50
-Paragraph 30
-Subparagraph (a)
-Publisher FASB
-URI https://asc.fasb.org//1943274/2147482810/280-10-50-30
Reference 4: http://www.xbrl.org/2003/role/disclosureRef
-Topic 280
-SubTopic 10
-Name Accounting Standards Codification
-Section 50
-Paragraph 42
-Publisher FASB
-URI https://asc.fasb.org//1943274/2147482810/280-10-50-42
Reference 5: http://www.xbrl.org/2003/role/disclosureRef
-Topic 280
-SubTopic 10
-Name Accounting Standards Codification
-Section 50
-Paragraph 22
-Subparagraph (b)
-Publisher FASB
-URI https://asc.fasb.org//1943274/2147482810/280-10-50-22
Reference 6: http://www.xbrl.org/2003/role/disclosureRef
-Topic 280
-SubTopic 10
-Name Accounting Standards Codification
-Section 50
-Paragraph 32
-Subparagraph (b)
-Publisher FASB
-URI https://asc.fasb.org//1943274/2147482810/280-10-50-32
Reference 7: http://www.xbrl.org/2003/role/disclosureRef
-Topic 280
-SubTopic 10
-Name Accounting Standards Codification
-Section 50
-Paragraph 40
-Publisher FASB
-URI https://asc.fasb.org//1943274/2147482810/280-10-50-40
Reference 8: http://www.xbrl.org/2003/role/disclosureRef
-Topic 280
-SubTopic 10
-Name Accounting Standards Codification
-Section 50
-Paragraph 22
-Subparagraph (a)
-Publisher FASB
-URI https://asc.fasb.org//1943274/2147482810/280-10-50-22
Reference 9: http://www.xbrl.org/2003/role/disclosureRef
-Topic 280
-SubTopic 10
-Name Accounting Standards Codification
-Section 50
-Paragraph 32
-Subparagraph (a)
-Publisher FASB
-URI https://asc.fasb.org//1943274/2147482810/280-10-50-32
Reference 10: http://www.xbrl.org/2003/role/disclosureRef
-Topic 280
-SubTopic 10
-Name Accounting Standards Codification
-Section 50
-Paragraph 41
-Subparagraph (a)
-Publisher FASB
-URI https://asc.fasb.org//1943274/2147482810/280-10-50-41
Reference 11: http://www.xbrl.org/2003/role/disclosureRef
-Topic 606
-SubTopic 10
-Name Accounting Standards Codification
-Section 50
-Paragraph 4
-Subparagraph (a)
-Publisher FASB
-URI https://asc.fasb.org//1943274/2147479806/606-10-50-4
| Name: |
us-gaap_RevenueFromContractWithCustomerExcludingAssessedTax |
| Namespace Prefix: |
us-gaap_ |
| Data Type: |
xbrli:monetaryItemType |
| Balance Type: |
credit |
| Period Type: |
duration |
|
v3.23.2
Schedule of Disaggregates Gross Revenue by Significant Geographic Area (Details) - USD ($)
|
3 Months Ended |
6 Months Ended |
Jul. 31, 2023 |
Jul. 31, 2022 |
Jul. 31, 2023 |
Jul. 31, 2022 |
| Total gross sales |
$ 25,414,735
|
$ 23,631,857
|
$ 49,014,645
|
$ 45,980,449
|
| Northeast [Member] |
|
|
|
|
| Total gross sales |
9,385,210
|
9,066,443
|
17,951,303
|
17,755,723
|
| Southeast [Member] |
|
|
|
|
| Total gross sales |
7,191,911
|
6,857,963
|
13,887,317
|
12,365,760
|
| Midwest [Member] |
|
|
|
|
| Total gross sales |
3,987,565
|
2,560,178
|
8,254,563
|
5,384,977
|
| West [Member] |
|
|
|
|
| Total gross sales |
2,693,758
|
2,543,230
|
4,615,326
|
5,442,086
|
| Southwest [Member] |
|
|
|
|
| Total gross sales |
$ 2,156,291
|
$ 2,604,043
|
$ 4,306,136
|
$ 5,031,903
|
| X |
- Details
| Name: |
us-gaap_StatementBusinessSegmentsAxis=MAMA_NortheastMember |
| Namespace Prefix: |
|
| Data Type: |
na |
| Balance Type: |
|
| Period Type: |
|
|
| X |
- Details
| Name: |
us-gaap_StatementBusinessSegmentsAxis=MAMA_SoutheastMember |
| Namespace Prefix: |
|
| Data Type: |
na |
| Balance Type: |
|
| Period Type: |
|
|
| X |
- Details
| Name: |
us-gaap_StatementBusinessSegmentsAxis=MAMA_MidwestMember |
| Namespace Prefix: |
|
| Data Type: |
na |
| Balance Type: |
|
| Period Type: |
|
|
| X |
- Details
| Name: |
us-gaap_StatementBusinessSegmentsAxis=MAMA_WestMember |
| Namespace Prefix: |
|
| Data Type: |
na |
| Balance Type: |
|
| Period Type: |
|
|
| X |
- Details
| Name: |
us-gaap_StatementBusinessSegmentsAxis=MAMA_SouthwestMember |
| Namespace Prefix: |
|
| Data Type: |
na |
| Balance Type: |
|
| Period Type: |
|
|
v3.23.2
| X |
- References
+ Details
| Name: |
us-gaap_AccountingPoliciesAbstract |
| Namespace Prefix: |
us-gaap_ |
| Data Type: |
xbrli:stringItemType |
| Balance Type: |
na |
| Period Type: |
duration |
|
| X |
- DefinitionThe estimated dividend rate (a percentage of the share price) to be paid (expected dividends) to holders of the underlying shares over the option's term. Reference 1: http://www.xbrl.org/2003/role/disclosureRef
-Topic 718
-SubTopic 10
-Name Accounting Standards Codification
-Section 50
-Paragraph 2
-Subparagraph (f)(2)(iii)
-Publisher FASB
-URI https://asc.fasb.org//1943274/2147480429/718-10-50-2
| Name: |
us-gaap_ShareBasedCompensationArrangementByShareBasedPaymentAwardFairValueAssumptionsExpectedDividendRate |
| Namespace Prefix: |
us-gaap_ |
| Data Type: |
dtr-types:percentItemType |
| Balance Type: |
na |
| Period Type: |
duration |
|
| X |
- DefinitionThe estimated measure of the percentage by which a share price is expected to fluctuate during a period. Volatility also may be defined as a probability-weighted measure of the dispersion of returns about the mean. The volatility of a share price is the standard deviation of the continuously compounded rates of return on the share over a specified period. That is the same as the standard deviation of the differences in the natural logarithms of the stock prices plus dividends, if any, over the period. Reference 1: http://www.xbrl.org/2003/role/disclosureRef
-Topic 718
-SubTopic 10
-Name Accounting Standards Codification
-Section 50
-Paragraph 2
-Subparagraph (f)(2)(ii)
-Publisher FASB
-URI https://asc.fasb.org//1943274/2147480429/718-10-50-2
| Name: |
us-gaap_ShareBasedCompensationArrangementByShareBasedPaymentAwardFairValueAssumptionsExpectedVolatilityRate |
| Namespace Prefix: |
us-gaap_ |
| Data Type: |
dtr-types:percentItemType |
| Balance Type: |
na |
| Period Type: |
duration |
|
| X |
- DefinitionThe risk-free interest rate assumption that is used in valuing an option on its own shares. Reference 1: http://www.xbrl.org/2003/role/disclosureRef
-Topic 718
-SubTopic 10
-Name Accounting Standards Codification
-Section 50
-Paragraph 2
-Subparagraph (f)(2)(iv)
-Publisher FASB
-URI https://asc.fasb.org//1943274/2147480429/718-10-50-2
| Name: |
us-gaap_ShareBasedCompensationArrangementByShareBasedPaymentAwardFairValueAssumptionsRiskFreeInterestRate |
| Namespace Prefix: |
us-gaap_ |
| Data Type: |
dtr-types:percentItemType |
| Balance Type: |
na |
| Period Type: |
duration |
|
| X |
- DefinitionExpected term of award under share-based payment arrangement, in 'PnYnMnDTnHnMnS' format, for example, 'P1Y5M13D' represents reported fact of one year, five months, and thirteen days. Reference 1: http://www.xbrl.org/2003/role/disclosureRef
-Topic 718
-SubTopic 10
-Name Accounting Standards Codification
-Section 50
-Paragraph 2
-Subparagraph (f)(2)(i)
-Publisher FASB
-URI https://asc.fasb.org//1943274/2147480429/718-10-50-2
| Name: |
us-gaap_SharebasedCompensationArrangementBySharebasedPaymentAwardFairValueAssumptionsExpectedTerm1 |
| Namespace Prefix: |
us-gaap_ |
| Data Type: |
xbrli:durationItemType |
| Balance Type: |
na |
| Period Type: |
duration |
|
v3.23.2
Schedule of Earnings Per Share, Basic and Diluted (Details) - USD ($)
|
3 Months Ended |
6 Months Ended |
Jul. 31, 2023 |
Jul. 31, 2022 |
Jul. 31, 2023 |
Jul. 31, 2022 |
| Accounting Policies [Abstract] |
|
|
|
|
| Net (loss) income attributable to common stockholders |
$ 1,722,678
|
$ (743,246)
|
$ 3,096,304
|
$ (639,549)
|
| Effect of dilutive securities: |
21,233
|
|
48,533
|
|
| Diluted net income |
$ 1,743,911
|
$ (743,246)
|
$ 3,144,837
|
$ (639,549)
|
| Weighted average common shares outstanding – basic |
36,855,181
|
35,811,087
|
36,628,429
|
35,785,719
|
| Restricted stock |
251,017
|
|
222,280
|
|
| Options |
384,369
|
|
344,605
|
|
| Weighted average common shares outstanding and assumed conversion – diluted |
37,490,567
|
35,811,087
|
37,195,314
|
35,785,719
|
| Basic net (loss) income per common share |
$ 0.05
|
$ (0.02)
|
$ 0.09
|
$ (0.02)
|
| Diluted net income (loss) per common share |
$ 0.05
|
$ (0.02)
|
$ 0.08
|
$ (0.02)
|
| (a) – Anti-dilutive securities excluded: |
|
689,000
|
|
689,000
|
| X |
- DefinitionAdditional shares included in the calculation of diluted EPS as a result of the potentially dilutive effect of options using the treasury stock method.
| Name: |
MAMA_IncrementalCommonSharesAttributableToOptions |
| Namespace Prefix: |
MAMA_ |
| Data Type: |
xbrli:sharesItemType |
| Balance Type: |
na |
| Period Type: |
duration |
|
| X |
- References
+ Details
| Name: |
us-gaap_AccountingPoliciesAbstract |
| Namespace Prefix: |
us-gaap_ |
| Data Type: |
xbrli:stringItemType |
| Balance Type: |
na |
| Period Type: |
duration |
|
| X |
- DefinitionSecurities (including those issuable pursuant to contingent stock agreements) that could potentially dilute basic earnings per share (EPS) or earnings per unit (EPU) in the future that were not included in the computation of diluted EPS or EPU because to do so would increase EPS or EPU amounts or decrease loss per share or unit amounts for the period presented. Reference 1: http://www.xbrl.org/2003/role/disclosureRef
-Topic 260
-SubTopic 10
-Name Accounting Standards Codification
-Section 50
-Paragraph 1
-Subparagraph (c)
-Publisher FASB
-URI https://asc.fasb.org//1943274/2147482662/260-10-50-1
| Name: |
us-gaap_AntidilutiveSecuritiesExcludedFromComputationOfEarningsPerShareAmount |
| Namespace Prefix: |
us-gaap_ |
| Data Type: |
xbrli:sharesItemType |
| Balance Type: |
na |
| Period Type: |
duration |
|
| X |
- DefinitionAmount of increase (decrease) to net income used for calculating diluted earnings per share (EPS), resulting from the assumed exercise stock options, restrictive stock units (RSUs), convertible preferred stock of an employee stock ownership plan (ESOP), and other dilutive convertible securities. Reference 1: http://fasb.org/us-gaap/role/ref/legacyRef
-Name Accounting Standards Codification
-Topic 260
-SubTopic 10
-Section 50
-Paragraph 1
-Publisher FASB
-URI https://asc.fasb.org//1943274/2147482662/260-10-50-1
| Name: |
us-gaap_DilutiveSecurities |
| Namespace Prefix: |
us-gaap_ |
| Data Type: |
xbrli:monetaryItemType |
| Balance Type: |
credit |
| Period Type: |
duration |
|
| X |
- DefinitionThe amount of net income (loss) for the period per each share of common stock or unit outstanding during the reporting period. Reference 1: http://www.xbrl.org/2003/role/disclosureRef
-Topic 250
-SubTopic 10
-Name Accounting Standards Codification
-Section 50
-Paragraph 3
-Publisher FASB
-URI https://asc.fasb.org//1943274/2147483443/250-10-50-3
Reference 2: http://www.xbrl.org/2003/role/disclosureRef
-Topic 260
-SubTopic 10
-Name Accounting Standards Codification
-Section 55
-Paragraph 15
-Publisher FASB
-URI https://asc.fasb.org//1943274/2147482635/260-10-55-15
Reference 3: http://www.xbrl.org/2003/role/disclosureRef
-Topic 815
-SubTopic 40
-Name Accounting Standards Codification
-Section 65
-Paragraph 1
-Subparagraph (e)(4)
-Publisher FASB
-URI https://asc.fasb.org//1943274/2147480175/815-40-65-1
Reference 4: http://www.xbrl.org/2003/role/disclosureRef
-Topic 815
-SubTopic 40
-Name Accounting Standards Codification
-Section 65
-Paragraph 1
-Subparagraph (f)
-Publisher FASB
-URI https://asc.fasb.org//1943274/2147480175/815-40-65-1
Reference 5: http://www.xbrl.org/2003/role/disclosureRef
-Topic 250
-SubTopic 10
-Name Accounting Standards Codification
-Section 50
-Paragraph 11
-Subparagraph (a)
-Publisher FASB
-URI https://asc.fasb.org//1943274/2147483443/250-10-50-11
Reference 6: http://www.xbrl.org/2003/role/disclosureRef
-Topic 250
-SubTopic 10
-Name Accounting Standards Codification
-Section 50
-Paragraph 11
-Subparagraph (b)
-Publisher FASB
-URI https://asc.fasb.org//1943274/2147483443/250-10-50-11
Reference 7: http://www.xbrl.org/2003/role/disclosureRef
-Topic 250
-SubTopic 10
-Name Accounting Standards Codification
-Section 50
-Paragraph 7
-Subparagraph (a)
-Publisher FASB
-URI https://asc.fasb.org//1943274/2147483443/250-10-50-7
Reference 8: http://www.xbrl.org/2003/role/disclosureRef
-Topic 260
-SubTopic 10
-Name Accounting Standards Codification
-Section 45
-Paragraph 2
-Publisher FASB
-URI https://asc.fasb.org//1943274/2147482689/260-10-45-2
Reference 9: http://www.xbrl.org/2003/role/disclosureRef
-Topic 260
-SubTopic 10
-Name Accounting Standards Codification
-Section 45
-Paragraph 60B
-Subparagraph (d)
-Publisher FASB
-URI https://asc.fasb.org//1943274/2147482689/260-10-45-60B
Reference 10: http://www.xbrl.org/2003/role/disclosureRef
-Topic 250
-SubTopic 10
-Name Accounting Standards Codification
-Section 50
-Paragraph 4
-Publisher FASB
-URI https://asc.fasb.org//1943274/2147483443/250-10-50-4
Reference 11: http://www.xbrl.org/2003/role/disclosureRef
-Topic 260
-SubTopic 10
-Name Accounting Standards Codification
-Section 50
-Paragraph 1
-Subparagraph (a)
-Publisher FASB
-URI https://asc.fasb.org//1943274/2147482662/260-10-50-1
Reference 12: http://www.xbrl.org/2003/role/disclosureRef
-Topic 260
-SubTopic 10
-Name Accounting Standards Codification
-Section 45
-Paragraph 10
-Publisher FASB
-URI https://asc.fasb.org//1943274/2147482689/260-10-45-10
Reference 13: http://www.xbrl.org/2003/role/disclosureRef
-Topic 220
-SubTopic 10
-Name Accounting Standards Codification
-Section S99
-Paragraph 2
-Subparagraph (SX 210.5-03(25))
-Publisher FASB
-URI https://asc.fasb.org//1943274/2147483621/220-10-S99-2
Reference 14: http://www.xbrl.org/2003/role/disclosureRef
-Topic 942
-SubTopic 220
-Name Accounting Standards Codification
-Section S99
-Paragraph 1
-Subparagraph (SX 210.9-04(27))
-Publisher FASB
-URI https://asc.fasb.org//1943274/2147483589/942-220-S99-1
Reference 15: http://www.xbrl.org/2003/role/disclosureRef
-Topic 944
-SubTopic 220
-Name Accounting Standards Codification
-Section S99
-Paragraph 1
-Subparagraph (SX 210.7-04(23))
-Publisher FASB
-URI https://asc.fasb.org//1943274/2147483586/944-220-S99-1
Reference 16: http://www.xbrl.org/2003/role/exampleRef
-Topic 260
-SubTopic 10
-Name Accounting Standards Codification
-Section 55
-Paragraph 52
-Publisher FASB
-URI https://asc.fasb.org//1943274/2147482635/260-10-55-52
Reference 17: http://www.xbrl.org/2003/role/disclosureRef
-Topic 260
-SubTopic 10
-Name Accounting Standards Codification
-Section 45
-Paragraph 7
-Publisher FASB
-URI https://asc.fasb.org//1943274/2147482689/260-10-45-7
| Name: |
us-gaap_EarningsPerShareBasic |
| Namespace Prefix: |
us-gaap_ |
| Data Type: |
dtr-types:perShareItemType |
| Balance Type: |
na |
| Period Type: |
duration |
|
| X |
- DefinitionThe amount of net income (loss) for the period available to each share of common stock or common unit outstanding during the reporting period and to each share or unit that would have been outstanding assuming the issuance of common shares or units for all dilutive potential common shares or units outstanding during the reporting period. Reference 1: http://www.xbrl.org/2003/role/disclosureRef
-Topic 250
-SubTopic 10
-Name Accounting Standards Codification
-Section 50
-Paragraph 3
-Publisher FASB
-URI https://asc.fasb.org//1943274/2147483443/250-10-50-3
Reference 2: http://www.xbrl.org/2003/role/disclosureRef
-Topic 260
-SubTopic 10
-Name Accounting Standards Codification
-Section 55
-Paragraph 15
-Publisher FASB
-URI https://asc.fasb.org//1943274/2147482635/260-10-55-15
Reference 3: http://www.xbrl.org/2003/role/disclosureRef
-Topic 815
-SubTopic 40
-Name Accounting Standards Codification
-Section 65
-Paragraph 1
-Subparagraph (e)(4)
-Publisher FASB
-URI https://asc.fasb.org//1943274/2147480175/815-40-65-1
Reference 4: http://www.xbrl.org/2003/role/disclosureRef
-Topic 815
-SubTopic 40
-Name Accounting Standards Codification
-Section 65
-Paragraph 1
-Subparagraph (f)
-Publisher FASB
-URI https://asc.fasb.org//1943274/2147480175/815-40-65-1
Reference 5: http://www.xbrl.org/2003/role/disclosureRef
-Topic 250
-SubTopic 10
-Name Accounting Standards Codification
-Section 50
-Paragraph 11
-Subparagraph (a)
-Publisher FASB
-URI https://asc.fasb.org//1943274/2147483443/250-10-50-11
Reference 6: http://www.xbrl.org/2003/role/disclosureRef
-Topic 250
-SubTopic 10
-Name Accounting Standards Codification
-Section 50
-Paragraph 11
-Subparagraph (b)
-Publisher FASB
-URI https://asc.fasb.org//1943274/2147483443/250-10-50-11
Reference 7: http://www.xbrl.org/2003/role/disclosureRef
-Topic 250
-SubTopic 10
-Name Accounting Standards Codification
-Section 50
-Paragraph 7
-Subparagraph (a)
-Publisher FASB
-URI https://asc.fasb.org//1943274/2147483443/250-10-50-7
Reference 8: http://www.xbrl.org/2003/role/disclosureRef
-Topic 260
-SubTopic 10
-Name Accounting Standards Codification
-Section 45
-Paragraph 2
-Publisher FASB
-URI https://asc.fasb.org//1943274/2147482689/260-10-45-2
Reference 9: http://www.xbrl.org/2003/role/disclosureRef
-Topic 260
-SubTopic 10
-Name Accounting Standards Codification
-Section 45
-Paragraph 60B
-Subparagraph (d)
-Publisher FASB
-URI https://asc.fasb.org//1943274/2147482689/260-10-45-60B
Reference 10: http://www.xbrl.org/2003/role/disclosureRef
-Topic 250
-SubTopic 10
-Name Accounting Standards Codification
-Section 50
-Paragraph 4
-Publisher FASB
-URI https://asc.fasb.org//1943274/2147483443/250-10-50-4
Reference 11: http://www.xbrl.org/2003/role/disclosureRef
-Topic 260
-SubTopic 10
-Name Accounting Standards Codification
-Section 50
-Paragraph 1
-Subparagraph (a)
-Publisher FASB
-URI https://asc.fasb.org//1943274/2147482662/260-10-50-1
Reference 12: http://www.xbrl.org/2003/role/disclosureRef
-Topic 220
-SubTopic 10
-Name Accounting Standards Codification
-Section S99
-Paragraph 2
-Subparagraph (SX 210.5-03(25))
-Publisher FASB
-URI https://asc.fasb.org//1943274/2147483621/220-10-S99-2
Reference 13: http://www.xbrl.org/2003/role/disclosureRef
-Topic 942
-SubTopic 220
-Name Accounting Standards Codification
-Section S99
-Paragraph 1
-Subparagraph (SX 210.9-04(27))
-Publisher FASB
-URI https://asc.fasb.org//1943274/2147483589/942-220-S99-1
Reference 14: http://www.xbrl.org/2003/role/disclosureRef
-Topic 944
-SubTopic 220
-Name Accounting Standards Codification
-Section S99
-Paragraph 1
-Subparagraph (SX 210.7-04(23))
-Publisher FASB
-URI https://asc.fasb.org//1943274/2147483586/944-220-S99-1
Reference 15: http://www.xbrl.org/2003/role/exampleRef
-Topic 260
-SubTopic 10
-Name Accounting Standards Codification
-Section 55
-Paragraph 52
-Publisher FASB
-URI https://asc.fasb.org//1943274/2147482635/260-10-55-52
Reference 16: http://www.xbrl.org/2003/role/disclosureRef
-Topic 260
-SubTopic 10
-Name Accounting Standards Codification
-Section 45
-Paragraph 7
-Publisher FASB
-URI https://asc.fasb.org//1943274/2147482689/260-10-45-7
| Name: |
us-gaap_EarningsPerShareDiluted |
| Namespace Prefix: |
us-gaap_ |
| Data Type: |
dtr-types:perShareItemType |
| Balance Type: |
na |
| Period Type: |
duration |
|
| X |
- DefinitionThe portion of profit or loss for the period, net of income taxes, which is attributable to the parent, and includes adjustments resulting from the assumption that dilutive convertible securities were converted, options or warrants were exercised, or that other shares were issued upon the satisfaction of certain conditions.
| Name: |
us-gaap_NetIncomeLossAttributableToParentDiluted |
| Namespace Prefix: |
us-gaap_ |
| Data Type: |
xbrli:monetaryItemType |
| Balance Type: |
credit |
| Period Type: |
duration |
|
| X |
- DefinitionAmount, after deduction of tax, noncontrolling interests, dividends on preferred stock and participating securities; of income (loss) available to common shareholders. Reference 1: http://www.xbrl.org/2003/role/disclosureRef
-Topic 250
-SubTopic 10
-Name Accounting Standards Codification
-Section 50
-Paragraph 3
-Publisher FASB
-URI https://asc.fasb.org//1943274/2147483443/250-10-50-3
Reference 2: http://www.xbrl.org/2003/role/disclosureRef
-Topic 250
-SubTopic 10
-Name Accounting Standards Codification
-Section 50
-Paragraph 11
-Subparagraph (a)
-Publisher FASB
-URI https://asc.fasb.org//1943274/2147483443/250-10-50-11
Reference 3: http://www.xbrl.org/2003/role/disclosureRef
-Topic 250
-SubTopic 10
-Name Accounting Standards Codification
-Section 50
-Paragraph 11
-Subparagraph (b)
-Publisher FASB
-URI https://asc.fasb.org//1943274/2147483443/250-10-50-11
Reference 4: http://www.xbrl.org/2003/role/disclosureRef
-Topic 250
-SubTopic 10
-Name Accounting Standards Codification
-Section 50
-Paragraph 4
-Publisher FASB
-URI https://asc.fasb.org//1943274/2147483443/250-10-50-4
Reference 5: http://www.xbrl.org/2003/role/disclosureRef
-Topic 220
-SubTopic 10
-Name Accounting Standards Codification
-Section S99
-Paragraph 5
-Subparagraph (SAB Topic 6.B)
-Publisher FASB
-URI https://asc.fasb.org//1943274/2147483621/220-10-S99-5
Reference 6: http://www.xbrl.org/2003/role/disclosureRef
-Topic 280
-SubTopic 10
-Name Accounting Standards Codification
-Section 50
-Paragraph 22
-Publisher FASB
-URI https://asc.fasb.org//1943274/2147482810/280-10-50-22
Reference 7: http://www.xbrl.org/2003/role/disclosureRef
-Topic 260
-SubTopic 10
-Name Accounting Standards Codification
-Section 50
-Paragraph 1
-Subparagraph (a)
-Publisher FASB
-URI https://asc.fasb.org//1943274/2147482662/260-10-50-1
Reference 8: http://www.xbrl.org/2003/role/disclosureRef
-Topic 280
-SubTopic 10
-Name Accounting Standards Codification
-Section 50
-Paragraph 30
-Subparagraph (b)
-Publisher FASB
-URI https://asc.fasb.org//1943274/2147482810/280-10-50-30
Reference 9: http://www.xbrl.org/2003/role/disclosureRef
-Topic 280
-SubTopic 10
-Name Accounting Standards Codification
-Section 50
-Paragraph 32
-Subparagraph (f)
-Publisher FASB
-URI https://asc.fasb.org//1943274/2147482810/280-10-50-32
Reference 10: http://www.xbrl.org/2003/role/disclosureRef
-Topic 260
-SubTopic 10
-Name Accounting Standards Codification
-Section 45
-Paragraph 10
-Publisher FASB
-URI https://asc.fasb.org//1943274/2147482689/260-10-45-10
Reference 11: http://www.xbrl.org/2003/role/exampleRef
-Topic 280
-SubTopic 10
-Name Accounting Standards Codification
-Section 50
-Paragraph 31
-Publisher FASB
-URI https://asc.fasb.org//1943274/2147482810/280-10-50-31
Reference 12: http://www.xbrl.org/2003/role/disclosureRef
-Topic 280
-SubTopic 10
-Name Accounting Standards Codification
-Section 50
-Paragraph 32
-Subparagraph (c)
-Publisher FASB
-URI https://asc.fasb.org//1943274/2147482810/280-10-50-32
Reference 13: http://www.xbrl.org/2003/role/disclosureRef
-Topic 260
-SubTopic 10
-Name Accounting Standards Codification
-Section 45
-Paragraph 11
-Publisher FASB
-URI https://asc.fasb.org//1943274/2147482689/260-10-45-11
Reference 14: http://www.xbrl.org/2003/role/disclosureRef
-Topic 260
-SubTopic 10
-Name Accounting Standards Codification
-Section 45
-Paragraph 60B
-Subparagraph (c)
-Publisher FASB
-URI https://asc.fasb.org//1943274/2147482689/260-10-45-60B
| Name: |
us-gaap_NetIncomeLossAvailableToCommonStockholdersBasic |
| Namespace Prefix: |
us-gaap_ |
| Data Type: |
xbrli:monetaryItemType |
| Balance Type: |
credit |
| Period Type: |
duration |
|
| X |
- DefinitionThe average number of shares or units issued and outstanding that are used in calculating diluted EPS or earnings per unit (EPU), determined based on the timing of issuance of shares or units in the period. Reference 1: http://www.xbrl.org/2003/role/disclosureRef
-Topic 260
-SubTopic 10
-Name Accounting Standards Codification
-Section 50
-Paragraph 1
-Subparagraph (a)
-Publisher FASB
-URI https://asc.fasb.org//1943274/2147482662/260-10-50-1
Reference 2: http://www.xbrl.org/2003/role/disclosureRef
-Topic 260
-SubTopic 10
-Name Accounting Standards Codification
-Section 45
-Paragraph 16
-Publisher FASB
-URI https://asc.fasb.org//1943274/2147482689/260-10-45-16
| Name: |
us-gaap_WeightedAverageNumberOfDilutedSharesOutstanding |
| Namespace Prefix: |
us-gaap_ |
| Data Type: |
xbrli:sharesItemType |
| Balance Type: |
na |
| Period Type: |
duration |
|
| X |
- DefinitionNumber of [basic] shares or units, after adjustment for contingently issuable shares or units and other shares or units not deemed outstanding, determined by relating the portion of time within a reporting period that common shares or units have been outstanding to the total time in that period. Reference 1: http://www.xbrl.org/2003/role/disclosureRef
-Topic 260
-SubTopic 10
-Name Accounting Standards Codification
-Section 50
-Paragraph 1
-Subparagraph (a)
-Publisher FASB
-URI https://asc.fasb.org//1943274/2147482662/260-10-50-1
Reference 2: http://www.xbrl.org/2003/role/disclosureRef
-Topic 260
-SubTopic 10
-Name Accounting Standards Codification
-Section 45
-Paragraph 10
-Publisher FASB
-URI https://asc.fasb.org//1943274/2147482689/260-10-45-10
| Name: |
us-gaap_WeightedAverageNumberOfSharesOutstandingBasic |
| Namespace Prefix: |
us-gaap_ |
| Data Type: |
xbrli:sharesItemType |
| Balance Type: |
na |
| Period Type: |
duration |
|
v3.23.2
Summary of Significant Accounting Policies (Details Narrative) - USD ($)
|
3 Months Ended |
6 Months Ended |
|
Jul. 31, 2023 |
Jul. 31, 2022 |
Jul. 31, 2023 |
Jul. 31, 2022 |
Jan. 31, 2023 |
| Share-Based Compensation Arrangement by Share-Based Payment Award [Line Items] |
|
|
|
|
|
| Cash equivalents |
$ 0
|
|
$ 0
|
|
$ 0
|
| Accounts receivable reserves |
93,000
|
|
93,000
|
|
233,000
|
| Deemed uncollectible |
140,000
|
|
140,000
|
|
|
| Inventory reserve for obsolescence |
126,000
|
|
126,000
|
|
32,000
|
| Research and development expense |
94,871
|
$ 41,792
|
166,056
|
$ 68,327
|
|
| Advertising expense |
95,000
|
119,000
|
304,000
|
307,000
|
|
| Share based compensation |
|
|
110,173
|
12,333
|
|
| Employees compensation |
104,789
|
|
160,173
|
|
|
| Deferred tax assets |
$ 67,908
|
|
$ 67,908
|
|
$ 717,559
|
| Employees [Member] |
|
|
|
|
|
| Share-Based Compensation Arrangement by Share-Based Payment Award [Line Items] |
|
|
|
|
|
| Employees compensation, shares |
19,960
|
|
19,960
|
|
|
| Employees compensation |
$ 50,000
|
|
$ 50,000
|
|
|
| Share-Based Payment Arrangement, Option [Member] |
|
|
|
|
|
| Share-Based Compensation Arrangement by Share-Based Payment Award [Line Items] |
|
|
|
|
|
| Share based compensation |
$ 18,000
|
$ 12,000
|
$ 40,561
|
$ 12,333
|
|
| X |
- DefinitionAllowance for doubtful accounts receivable deemed uncollectible.
| Name: |
MAMA_AllowanceForDoubtfulAccountsReceivableDeemedUncollectible |
| Namespace Prefix: |
MAMA_ |
| Data Type: |
xbrli:monetaryItemType |
| Balance Type: |
credit |
| Period Type: |
duration |
|
| X |
- DefinitionAmount charged to advertising expense for the period, which are expenses incurred with the objective of increasing revenue for a specified brand, product or product line. Reference 1: http://www.xbrl.org/2003/role/disclosureRef
-Topic 720
-SubTopic 35
-Name Accounting Standards Codification
-Section 50
-Paragraph 1
-Subparagraph (b)
-Publisher FASB
-URI https://asc.fasb.org//1943274/2147483406/720-35-50-1
| Name: |
us-gaap_AdvertisingExpense |
| Namespace Prefix: |
us-gaap_ |
| Data Type: |
xbrli:monetaryItemType |
| Balance Type: |
debit |
| Period Type: |
duration |
|
| X |
- DefinitionAmount of allowance for credit loss on accounts receivable, classified as current. Reference 1: http://www.xbrl.org/2003/role/disclosureRef
-Topic 210
-SubTopic 10
-Name Accounting Standards Codification
-Section S99
-Paragraph 1
-Subparagraph (SX 210.5-02(4))
-Publisher FASB
-URI https://asc.fasb.org//1943274/2147480566/210-10-S99-1
Reference 2: http://www.xbrl.org/2003/role/disclosureRef
-Topic 326
-SubTopic 20
-Name Accounting Standards Codification
-Section 45
-Paragraph 1
-Publisher FASB
-URI https://asc.fasb.org//1943274/2147479344/326-20-45-1
Reference 3: http://www.xbrl.org/2003/role/disclosureRef
-Topic 310
-SubTopic 10
-Name Accounting Standards Codification
-Section 50
-Paragraph 4
-Publisher FASB
-URI https://asc.fasb.org//1943274/2147481962/310-10-50-4
| Name: |
us-gaap_AllowanceForDoubtfulAccountsReceivableCurrent |
| Namespace Prefix: |
us-gaap_ |
| Data Type: |
xbrli:monetaryItemType |
| Balance Type: |
credit |
| Period Type: |
instant |
|
| X |
- DefinitionAmount of short-term, highly liquid investments that are both readily convertible to known amounts of cash and so near their maturity that they present insignificant risk of changes in value because of changes in interest rates. Excludes cash and cash equivalents within disposal group and discontinued operation. Reference 1: http://www.xbrl.org/2009/role/commonPracticeRef
-Topic 944
-SubTopic 210
-Name Accounting Standards Codification
-Section S99
-Paragraph 1
-Subparagraph (SX 210.7-03(a)(2))
-Publisher FASB
-URI https://asc.fasb.org//1943274/2147479440/944-210-S99-1
Reference 2: http://www.xbrl.org/2009/role/commonPracticeRef
-Topic 210
-SubTopic 10
-Name Accounting Standards Codification
-Section S99
-Paragraph 1
-Subparagraph (SX 210.5-02(1))
-Publisher FASB
-URI https://asc.fasb.org//1943274/2147480566/210-10-S99-1
| Name: |
us-gaap_CashEquivalentsAtCarryingValue |
| Namespace Prefix: |
us-gaap_ |
| Data Type: |
xbrli:monetaryItemType |
| Balance Type: |
debit |
| Period Type: |
instant |
|
| X |
- DefinitionAmount after allocation of valuation allowances of deferred tax asset attributable to deductible temporary differences and carryforwards. Reference 1: http://www.xbrl.org/2009/role/commonPracticeRef
-Topic 740
-SubTopic 10
-Name Accounting Standards Codification
-Section 50
-Paragraph 2
-Publisher FASB
-URI https://asc.fasb.org//1943274/2147482685/740-10-50-2
| Name: |
us-gaap_DeferredTaxAssetsNet |
| Namespace Prefix: |
us-gaap_ |
| Data Type: |
xbrli:monetaryItemType |
| Balance Type: |
debit |
| Period Type: |
instant |
|
| X |
- DefinitionAmount by which inventory stated at last-in first-out (LIFO) is less than (in excess of) inventory stated at other inventory cost methods. Reference 1: http://www.xbrl.org/2009/role/commonPracticeRef
-Topic 210
-SubTopic 10
-Name Accounting Standards Codification
-Section S99
-Paragraph 1
-Subparagraph (SX 210.5-02(6)(c))
-Publisher FASB
-URI https://asc.fasb.org//1943274/2147480566/210-10-S99-1
| Name: |
us-gaap_InventoryLIFOReserve |
| Namespace Prefix: |
us-gaap_ |
| Data Type: |
xbrli:monetaryItemType |
| Balance Type: |
credit |
| Period Type: |
instant |
|
| X |
- DefinitionThe aggregate costs incurred (1) in a planned search or critical investigation aimed at discovery of new knowledge with the hope that such knowledge will be useful in developing a new product or service, a new process or technique, or in bringing about a significant improvement to an existing product or process; or (2) to translate research findings or other knowledge into a plan or design for a new product or process or for a significant improvement to an existing product or process whether intended for sale or the entity's use, during the reporting period charged to research and development projects, including the costs of developing computer software up to the point in time of achieving technological feasibility, and costs allocated in accounting for a business combination to in-process projects deemed to have no alternative future use. Reference 1: http://www.xbrl.org/2003/role/disclosureRef
-Topic 730
-SubTopic 10
-Name Accounting Standards Codification
-Section 50
-Paragraph 1
-Publisher FASB
-URI https://asc.fasb.org//1943274/2147482916/730-10-50-1
Reference 2: http://www.xbrl.org/2009/role/commonPracticeRef
-Topic 912
-SubTopic 730
-Name Accounting Standards Codification
-Section 25
-Paragraph 1
-Publisher FASB
-URI https://asc.fasb.org//1943274/2147482517/912-730-25-1
Reference 3: http://fasb.org/us-gaap/role/ref/legacyRef
-Name Accounting Standards Codification
-Topic 985
-SubTopic 20
-Section 50
-Paragraph 1
-Publisher FASB
-URI https://asc.fasb.org//1943274/2147481283/985-20-50-1
| Name: |
us-gaap_ResearchAndDevelopmentExpense |
| Namespace Prefix: |
us-gaap_ |
| Data Type: |
xbrli:monetaryItemType |
| Balance Type: |
debit |
| Period Type: |
duration |
|
| X |
- DefinitionAmount of noncash expense for share-based payment arrangement. Reference 1: http://fasb.org/us-gaap/role/ref/legacyRef
-Name Accounting Standards Codification
-Section 45
-Paragraph 28
-Subparagraph (a)
-SubTopic 10
-Topic 230
-Publisher FASB
-URI https://asc.fasb.org//1943274/2147482740/230-10-45-28
| Name: |
us-gaap_ShareBasedCompensation |
| Namespace Prefix: |
us-gaap_ |
| Data Type: |
xbrli:monetaryItemType |
| Balance Type: |
debit |
| Period Type: |
duration |
|
| X |
- DefinitionLine items represent financial concepts included in a table. These concepts are used to disclose reportable information associated with domain members defined in one or many axes to the table. Reference 1: http://www.xbrl.org/2003/role/disclosureRef
-Topic 718
-SubTopic 10
-Name Accounting Standards Codification
-Section 35
-Paragraph 1D
-Publisher FASB
-URI https://asc.fasb.org//1943274/2147480483/718-10-35-1D
Reference 2: http://www.xbrl.org/2003/role/disclosureRef
-Topic 718
-SubTopic 10
-Name Accounting Standards Codification
-Section 35
-Paragraph 3
-Publisher FASB
-URI https://asc.fasb.org//1943274/2147480483/718-10-35-3
Reference 3: http://www.xbrl.org/2003/role/disclosureRef
-Topic 718
-SubTopic 10
-Name Accounting Standards Codification
-Section 50
-Paragraph 2
-Subparagraph (a)(1)
-Publisher FASB
-URI https://asc.fasb.org//1943274/2147480429/718-10-50-2
Reference 4: http://www.xbrl.org/2003/role/disclosureRef
-Topic 718
-SubTopic 10
-Name Accounting Standards Codification
-Section 50
-Paragraph 2
-Subparagraph (a)(2)
-Publisher FASB
-URI https://asc.fasb.org//1943274/2147480429/718-10-50-2
Reference 5: http://www.xbrl.org/2003/role/disclosureRef
-Topic 718
-SubTopic 10
-Name Accounting Standards Codification
-Section 50
-Paragraph 2
-Subparagraph (a)(3)
-Publisher FASB
-URI https://asc.fasb.org//1943274/2147480429/718-10-50-2
Reference 6: http://www.xbrl.org/2003/role/disclosureRef
-Topic 718
-SubTopic 10
-Name Accounting Standards Codification
-Section 50
-Paragraph 2
-Subparagraph (c)(1)(i)
-Publisher FASB
-URI https://asc.fasb.org//1943274/2147480429/718-10-50-2
Reference 7: http://www.xbrl.org/2003/role/disclosureRef
-Topic 718
-SubTopic 10
-Name Accounting Standards Codification
-Section 50
-Paragraph 2
-Subparagraph (c)(1)(ii)
-Publisher FASB
-URI https://asc.fasb.org//1943274/2147480429/718-10-50-2
Reference 8: http://www.xbrl.org/2003/role/disclosureRef
-Topic 718
-SubTopic 10
-Name Accounting Standards Codification
-Section 50
-Paragraph 2
-Subparagraph (c)(1)(iii)
-Publisher FASB
-URI https://asc.fasb.org//1943274/2147480429/718-10-50-2
Reference 9: http://www.xbrl.org/2003/role/disclosureRef
-Topic 718
-SubTopic 10
-Name Accounting Standards Codification
-Section 50
-Paragraph 2
-Subparagraph (c)(1)(iv)
-Publisher FASB
-URI https://asc.fasb.org//1943274/2147480429/718-10-50-2
Reference 10: http://www.xbrl.org/2003/role/disclosureRef
-Topic 718
-SubTopic 10
-Name Accounting Standards Codification
-Section 50
-Paragraph 2
-Subparagraph (c)(1)(iv)(01)
-Publisher FASB
-URI https://asc.fasb.org//1943274/2147480429/718-10-50-2
Reference 11: http://www.xbrl.org/2003/role/disclosureRef
-Topic 718
-SubTopic 10
-Name Accounting Standards Codification
-Section 50
-Paragraph 2
-Subparagraph (c)(1)(iv)(02)
-Publisher FASB
-URI https://asc.fasb.org//1943274/2147480429/718-10-50-2
Reference 12: http://www.xbrl.org/2003/role/disclosureRef
-Topic 718
-SubTopic 10
-Name Accounting Standards Codification
-Section 50
-Paragraph 2
-Subparagraph (c)(1)(iv)(03)
-Publisher FASB
-URI https://asc.fasb.org//1943274/2147480429/718-10-50-2
Reference 13: http://www.xbrl.org/2003/role/disclosureRef
-Topic 718
-SubTopic 10
-Name Accounting Standards Codification
-Section 50
-Paragraph 2
-Subparagraph (c)(1)(iv)(04)
-Publisher FASB
-URI https://asc.fasb.org//1943274/2147480429/718-10-50-2
Reference 14: http://www.xbrl.org/2003/role/disclosureRef
-Topic 718
-SubTopic 10
-Name Accounting Standards Codification
-Section 50
-Paragraph 2
-Subparagraph (c)(2)(i)
-Publisher FASB
-URI https://asc.fasb.org//1943274/2147480429/718-10-50-2
Reference 15: http://www.xbrl.org/2003/role/disclosureRef
-Topic 718
-SubTopic 10
-Name Accounting Standards Codification
-Section 50
-Paragraph 2
-Subparagraph (c)(2)(ii)
-Publisher FASB
-URI https://asc.fasb.org//1943274/2147480429/718-10-50-2
Reference 16: http://www.xbrl.org/2003/role/disclosureRef
-Topic 718
-SubTopic 10
-Name Accounting Standards Codification
-Section 50
-Paragraph 2
-Subparagraph (c)(2)(iii)
-Publisher FASB
-URI https://asc.fasb.org//1943274/2147480429/718-10-50-2
Reference 17: http://www.xbrl.org/2003/role/disclosureRef
-Topic 718
-SubTopic 10
-Name Accounting Standards Codification
-Section 50
-Paragraph 2
-Subparagraph (c)(2)(iii)(01)
-Publisher FASB
-URI https://asc.fasb.org//1943274/2147480429/718-10-50-2
Reference 18: http://www.xbrl.org/2003/role/disclosureRef
-Topic 718
-SubTopic 10
-Name Accounting Standards Codification
-Section 50
-Paragraph 2
-Subparagraph (c)(2)(iii)(02)
-Publisher FASB
-URI https://asc.fasb.org//1943274/2147480429/718-10-50-2
Reference 19: http://www.xbrl.org/2003/role/disclosureRef
-Topic 718
-SubTopic 10
-Name Accounting Standards Codification
-Section 50
-Paragraph 2
-Subparagraph (c)(2)(iii)(03)
-Publisher FASB
-URI https://asc.fasb.org//1943274/2147480429/718-10-50-2
Reference 20: http://www.xbrl.org/2003/role/disclosureRef
-Topic 718
-SubTopic 10
-Name Accounting Standards Codification
-Section 50
-Paragraph 2
-Subparagraph (d)(1)
-Publisher FASB
-URI https://asc.fasb.org//1943274/2147480429/718-10-50-2
Reference 21: http://www.xbrl.org/2003/role/disclosureRef
-Topic 718
-SubTopic 10
-Name Accounting Standards Codification
-Section 50
-Paragraph 2
-Subparagraph (d)(2)
-Publisher FASB
-URI https://asc.fasb.org//1943274/2147480429/718-10-50-2
Reference 22: http://www.xbrl.org/2003/role/disclosureRef
-Topic 718
-SubTopic 10
-Name Accounting Standards Codification
-Section 50
-Paragraph 2
-Subparagraph (e)(1)
-Publisher FASB
-URI https://asc.fasb.org//1943274/2147480429/718-10-50-2
Reference 23: http://www.xbrl.org/2003/role/disclosureRef
-Topic 718
-SubTopic 10
-Name Accounting Standards Codification
-Section 50
-Paragraph 2
-Subparagraph (e)(2)
-Publisher FASB
-URI https://asc.fasb.org//1943274/2147480429/718-10-50-2
Reference 24: http://www.xbrl.org/2003/role/disclosureRef
-Topic 718
-SubTopic 10
-Name Accounting Standards Codification
-Section 50
-Paragraph 2
-Subparagraph (f)(2)(i)
-Publisher FASB
-URI https://asc.fasb.org//1943274/2147480429/718-10-50-2
Reference 25: http://www.xbrl.org/2003/role/disclosureRef
-Topic 718
-SubTopic 10
-Name Accounting Standards Codification
-Section 50
-Paragraph 2
-Subparagraph (f)(2)(ii)
-Publisher FASB
-URI https://asc.fasb.org//1943274/2147480429/718-10-50-2
Reference 26: http://www.xbrl.org/2003/role/disclosureRef
-Topic 718
-SubTopic 10
-Name Accounting Standards Codification
-Section 50
-Paragraph 2
-Subparagraph (f)(2)(iii)
-Publisher FASB
-URI https://asc.fasb.org//1943274/2147480429/718-10-50-2
Reference 27: http://www.xbrl.org/2003/role/disclosureRef
-Topic 718
-SubTopic 10
-Name Accounting Standards Codification
-Section 50
-Paragraph 2
-Subparagraph (f)(2)(iv)
-Publisher FASB
-URI https://asc.fasb.org//1943274/2147480429/718-10-50-2
Reference 28: http://www.xbrl.org/2003/role/disclosureRef
-Topic 718
-SubTopic 10
-Name Accounting Standards Codification
-Section 50
-Paragraph 2
-Subparagraph (f)(2)(v)
-Publisher FASB
-URI https://asc.fasb.org//1943274/2147480429/718-10-50-2
| Name: |
us-gaap_ShareBasedCompensationArrangementByShareBasedPaymentAwardLineItems |
| Namespace Prefix: |
us-gaap_ |
| Data Type: |
xbrli:stringItemType |
| Balance Type: |
na |
| Period Type: |
duration |
|
| X |
- DefinitionNumber, after forfeiture, of shares or units issued under share-based payment arrangement. Excludes shares or units issued under employee stock ownership plan (ESOP). Reference 1: http://fasb.org/us-gaap/role/ref/legacyRef
-Name Accounting Standards Codification
-Section 50
-Paragraph 2
-SubTopic 10
-Topic 505
-Publisher FASB
-URI https://asc.fasb.org//1943274/2147481112/505-10-50-2
Reference 2: http://fasb.org/us-gaap/role/ref/legacyRef
-Topic 210
-SubTopic 10
-Name Accounting Standards Codification
-Section S99
-Paragraph 1
-Subparagraph (SX 210.5-02(28))
-Publisher FASB
-URI https://asc.fasb.org//1943274/2147480566/210-10-S99-1
Reference 3: http://fasb.org/us-gaap/role/ref/legacyRef
-Topic 505
-SubTopic 10
-Name Accounting Standards Codification
-Section S99
-Paragraph 1
-Subparagraph (SX 210.3-04)
-Publisher FASB
-URI https://asc.fasb.org//1943274/2147480008/505-10-S99-1
Reference 4: http://fasb.org/us-gaap/role/ref/legacyRef
-Topic 210
-SubTopic 10
-Name Accounting Standards Codification
-Section S99
-Paragraph 1
-Subparagraph (SX 210.5-02(29))
-Publisher FASB
-URI https://asc.fasb.org//1943274/2147480566/210-10-S99-1
| Name: |
us-gaap_StockIssuedDuringPeriodSharesShareBasedCompensation |
| Namespace Prefix: |
us-gaap_ |
| Data Type: |
xbrli:sharesItemType |
| Balance Type: |
na |
| Period Type: |
duration |
|
| X |
- DefinitionValue, after forfeiture, of shares issued under share-based payment arrangement. Excludes employee stock ownership plan (ESOP). Reference 1: http://fasb.org/us-gaap/role/ref/legacyRef
-Topic 210
-SubTopic 10
-Name Accounting Standards Codification
-Section S99
-Paragraph 1
-Subparagraph (SX 210.5-02(28))
-Publisher FASB
-URI https://asc.fasb.org//1943274/2147480566/210-10-S99-1
Reference 2: http://fasb.org/us-gaap/role/ref/legacyRef
-Topic 505
-SubTopic 10
-Name Accounting Standards Codification
-Section S99
-Paragraph 1
-Subparagraph (SX 210.3-04)
-Publisher FASB
-URI https://asc.fasb.org//1943274/2147480008/505-10-S99-1
Reference 3: http://fasb.org/us-gaap/role/ref/legacyRef
-Topic 210
-SubTopic 10
-Name Accounting Standards Codification
-Section S99
-Paragraph 1
-Subparagraph (SX 210.5-02(29))
-Publisher FASB
-URI https://asc.fasb.org//1943274/2147480566/210-10-S99-1
Reference 4: http://fasb.org/us-gaap/role/ref/legacyRef
-Name Accounting Standards Codification
-Topic 718
-SubTopic 10
-Section 50
-Paragraph 2
-Subparagraph (d)(1)
-Publisher FASB
-URI https://asc.fasb.org//1943274/2147480429/718-10-50-2
| Name: |
us-gaap_StockIssuedDuringPeriodValueShareBasedCompensation |
| Namespace Prefix: |
us-gaap_ |
| Data Type: |
xbrli:monetaryItemType |
| Balance Type: |
credit |
| Period Type: |
duration |
|
| X |
- Details
| Name: |
srt_TitleOfIndividualAxis=MAMA_EmployeesMember |
| Namespace Prefix: |
|
| Data Type: |
na |
| Balance Type: |
|
| Period Type: |
|
|
| X |
- Details
| Name: |
us-gaap_AwardTypeAxis=us-gaap_EmployeeStockOptionMember |
| Namespace Prefix: |
|
| Data Type: |
na |
| Balance Type: |
|
| Period Type: |
|
|
v3.23.2
Schedule of Property and Equipment (Details) - USD ($)
|
Jul. 31, 2023 |
Jan. 31, 2023 |
| Property, Plant and Equipment [Abstract] |
|
|
| Machinery and Equipment |
$ 3,669,137
|
$ 5,387,255
|
| Furniture and Fixtures |
236,645
|
284,781
|
| Leasehold Improvements |
2,841,159
|
3,480,061
|
| Property and Equipment, Gross |
6,746,941
|
9,152,097
|
| Less: Accumulated Depreciation |
2,679,293
|
5,729,001
|
| Total |
$ 4,067,648
|
$ 3,423,096
|
| X |
- DefinitionAmount of accumulated depreciation, depletion and amortization for physical assets used in the normal conduct of business to produce goods and services. Reference 1: http://www.xbrl.org/2003/role/disclosureRef
-Topic 944
-SubTopic 210
-Name Accounting Standards Codification
-Section S99
-Paragraph 1
-Subparagraph (SX 210.7-03(a)(8)(b))
-Publisher FASB
-URI https://asc.fasb.org//1943274/2147479440/944-210-S99-1
Reference 2: http://www.xbrl.org/2003/role/disclosureRef
-Topic 210
-SubTopic 10
-Name Accounting Standards Codification
-Section S99
-Paragraph 1
-Subparagraph (SX 210.5-02(14))
-Publisher FASB
-URI https://asc.fasb.org//1943274/2147480566/210-10-S99-1
Reference 3: http://fasb.org/us-gaap/role/ref/legacyRef
-Name Accounting Standards Codification
-Topic 360
-SubTopic 10
-Section 50
-Paragraph 1
-Subparagraph (c)
-Publisher FASB
-URI https://asc.fasb.org//1943274/2147482099/360-10-50-1
| Name: |
us-gaap_AccumulatedDepreciationDepletionAndAmortizationPropertyPlantAndEquipment |
| Namespace Prefix: |
us-gaap_ |
| Data Type: |
xbrli:monetaryItemType |
| Balance Type: |
credit |
| Period Type: |
instant |
|
| X |
- DefinitionAmount before accumulated depreciation of equipment commonly used in offices and stores that have no permanent connection to the structure of a building or utilities. Examples include, but are not limited to, desks, chairs, tables, and bookcases. Reference 1: http://fasb.org/us-gaap/role/ref/legacyRef
-Topic 360
-SubTopic 10
-Name Accounting Standards Codification
-Section 50
-Paragraph 1
-Subparagraph (b)
-Publisher FASB
-URI https://asc.fasb.org//1943274/2147482099/360-10-50-1
| Name: |
us-gaap_FurnitureAndFixturesGross |
| Namespace Prefix: |
us-gaap_ |
| Data Type: |
xbrli:monetaryItemType |
| Balance Type: |
debit |
| Period Type: |
instant |
|
| X |
- DefinitionAmount before accumulated depreciation of additions or improvements to assets held under a lease arrangement. Reference 1: http://fasb.org/us-gaap/role/ref/legacyRef
-Topic 360
-SubTopic 10
-Name Accounting Standards Codification
-Section 50
-Paragraph 1
-Subparagraph (b)
-Publisher FASB
-URI https://asc.fasb.org//1943274/2147482099/360-10-50-1
| Name: |
us-gaap_LeaseholdImprovementsGross |
| Namespace Prefix: |
us-gaap_ |
| Data Type: |
xbrli:monetaryItemType |
| Balance Type: |
debit |
| Period Type: |
instant |
|
| X |
- DefinitionAmount before accumulated depreciation of tangible personal property used to produce goods and services, including, but is not limited to, tools, dies and molds, computer and office equipment. Reference 1: http://fasb.org/us-gaap/role/ref/legacyRef
-Topic 360
-SubTopic 10
-Name Accounting Standards Codification
-Section 50
-Paragraph 1
-Subparagraph (b)
-Publisher FASB
-URI https://asc.fasb.org//1943274/2147482099/360-10-50-1
| Name: |
us-gaap_MachineryAndEquipmentGross |
| Namespace Prefix: |
us-gaap_ |
| Data Type: |
xbrli:monetaryItemType |
| Balance Type: |
debit |
| Period Type: |
instant |
|
| X |
- References
+ Details
| Name: |
us-gaap_PropertyPlantAndEquipmentAbstract |
| Namespace Prefix: |
us-gaap_ |
| Data Type: |
xbrli:stringItemType |
| Balance Type: |
na |
| Period Type: |
duration |
|
| X |
- DefinitionAmount before accumulated depreciation, depletion and amortization of physical assets used in the normal conduct of business and not intended for resale. Examples include, but are not limited to, land, buildings, machinery and equipment, office equipment, and furniture and fixtures. Reference 1: http://www.xbrl.org/2003/role/disclosureRef
-Topic 944
-SubTopic 210
-Name Accounting Standards Codification
-Section S99
-Paragraph 1
-Subparagraph (SX 210.7-03(a)(8))
-Publisher FASB
-URI https://asc.fasb.org//1943274/2147479440/944-210-S99-1
Reference 2: http://www.xbrl.org/2003/role/disclosureRef
-Topic 210
-SubTopic 10
-Name Accounting Standards Codification
-Section S99
-Paragraph 1
-Subparagraph (SX 210.5-02(13))
-Publisher FASB
-URI https://asc.fasb.org//1943274/2147480566/210-10-S99-1
Reference 3: http://fasb.org/us-gaap/role/ref/legacyRef
-Topic 360
-SubTopic 10
-Name Accounting Standards Codification
-Section 50
-Paragraph 1
-Subparagraph (b)
-Publisher FASB
-URI https://asc.fasb.org//1943274/2147482099/360-10-50-1
| Name: |
us-gaap_PropertyPlantAndEquipmentGross |
| Namespace Prefix: |
us-gaap_ |
| Data Type: |
xbrli:monetaryItemType |
| Balance Type: |
debit |
| Period Type: |
instant |
|
| X |
- DefinitionAmount after accumulated depreciation, depletion and amortization of physical assets used in the normal conduct of business to produce goods and services and not intended for resale. Examples include, but are not limited to, land, buildings, machinery and equipment, office equipment, and furniture and fixtures. Reference 1: http://fasb.org/us-gaap/role/ref/legacyRef
-Name Accounting Standards Codification
-Section 50
-Paragraph 1
-SubTopic 10
-Topic 360
-Publisher FASB
-URI https://asc.fasb.org//1943274/2147482099/360-10-50-1
Reference 2: http://www.xbrl.org/2003/role/exampleRef
-Topic 852
-SubTopic 10
-Name Accounting Standards Codification
-Section 55
-Paragraph 10
-Publisher FASB
-URI https://asc.fasb.org//1943274/2147481372/852-10-55-10
Reference 3: http://www.xbrl.org/2003/role/disclosureRef
-Topic 944
-SubTopic 210
-Name Accounting Standards Codification
-Section S99
-Paragraph 1
-Subparagraph (SX 210.7-03(a)(8))
-Publisher FASB
-URI https://asc.fasb.org//1943274/2147479440/944-210-S99-1
Reference 4: http://www.xbrl.org/2003/role/disclosureRef
-Topic 942
-SubTopic 360
-Name Accounting Standards Codification
-Section 50
-Paragraph 1
-Publisher FASB
-URI https://asc.fasb.org//1943274/2147480842/942-360-50-1
| Name: |
us-gaap_PropertyPlantAndEquipmentNet |
| Namespace Prefix: |
us-gaap_ |
| Data Type: |
xbrli:monetaryItemType |
| Balance Type: |
debit |
| Period Type: |
instant |
|
v3.23.2
| X |
- DefinitionThe amount of expense recognized in the current period that reflects the allocation of the cost of tangible assets over the assets' useful lives. Includes production and non-production related depreciation. Reference 1: http://fasb.org/us-gaap/role/ref/legacyRef
-Name Accounting Standards Codification
-Section 45
-Paragraph 28
-Subparagraph (b)
-SubTopic 10
-Topic 230
-Publisher FASB
-URI https://asc.fasb.org//1943274/2147482740/230-10-45-28
Reference 2: http://fasb.org/us-gaap/role/ref/legacyRef
-Name Accounting Standards Codification
-Topic 360
-SubTopic 10
-Section 50
-Paragraph 1
-Subparagraph (a)
-Publisher FASB
-URI https://asc.fasb.org//1943274/2147482099/360-10-50-1
| Name: |
us-gaap_Depreciation |
| Namespace Prefix: |
us-gaap_ |
| Data Type: |
xbrli:monetaryItemType |
| Balance Type: |
debit |
| Period Type: |
duration |
|
| X |
- References
+ Details
| Name: |
us-gaap_PropertyPlantAndEquipmentAbstract |
| Namespace Prefix: |
us-gaap_ |
| Data Type: |
xbrli:stringItemType |
| Balance Type: |
na |
| Period Type: |
duration |
|
v3.23.2
Schedule of Purchase Price Calculation (Details) - CIF Acquisition [Member]
|
Jun. 28, 2023
USD ($)
|
| Business Acquisition [Line Items] |
|
| Cash transferred upon acquisition |
$ 950,000
|
| Related party debt issued upon acquisition |
2,700,000
|
| Sub-total |
3,650,000
|
| Carrying value of the Company’s equity method investment in CIF |
1,566,828
|
| Total purchase price |
$ 5,216,828
|
| X |
- DefinitionAmount of cash transferred upon acquisition in a business combination.
| Name: |
MAMA_BusinessCombinationCashTransferredUponAcquisition |
| Namespace Prefix: |
MAMA_ |
| Data Type: |
xbrli:monetaryItemType |
| Balance Type: |
credit |
| Period Type: |
duration |
|
| X |
- DefinitionLine items represent financial concepts included in a table. These concepts are used to disclose reportable information associated with domain members defined in one or many axes to the table. Reference 1: http://www.xbrl.org/2003/role/disclosureRef
-Topic 805
-SubTopic 20
-Name Accounting Standards Codification
-Section 50
-Paragraph 5
-Subparagraph (a)
-Publisher FASB
-URI https://asc.fasb.org//1943274/2147479907/805-20-50-5
| Name: |
us-gaap_BusinessAcquisitionLineItems |
| Namespace Prefix: |
us-gaap_ |
| Data Type: |
xbrli:stringItemType |
| Balance Type: |
na |
| Period Type: |
duration |
|
| X |
- DefinitionAmount of consideration transferred, consisting of acquisition-date fair value of assets transferred by the acquirer, liabilities incurred by the acquirer, and equity interest issued by the acquirer. Reference 1: http://fasb.org/us-gaap/role/ref/legacyRef
-Name Accounting Standards Codification
-Section 30
-Paragraph 8
-SubTopic 30
-Topic 805
-Publisher FASB
-URI https://asc.fasb.org//1943274/2147479637/805-30-30-8
Reference 2: http://fasb.org/us-gaap/role/ref/legacyRef
-Name Accounting Standards Codification
-Section 50
-Paragraph 1
-Subparagraph (b)
-SubTopic 30
-Topic 805
-Publisher FASB
-URI https://asc.fasb.org//1943274/2147479581/805-30-50-1
Reference 3: http://fasb.org/us-gaap/role/ref/legacyRef
-Name Accounting Standards Codification
-Section 30
-Paragraph 7
-SubTopic 30
-Topic 805
-Publisher FASB
-URI https://asc.fasb.org//1943274/2147479637/805-30-30-7
| Name: |
us-gaap_BusinessCombinationConsiderationTransferred1 |
| Namespace Prefix: |
us-gaap_ |
| Data Type: |
xbrli:monetaryItemType |
| Balance Type: |
credit |
| Period Type: |
duration |
|
| X |
- DefinitionAmount of equity interests of the acquirer, including instruments or interests issued or issuable in consideration for the business combination. Reference 1: http://fasb.org/us-gaap/role/ref/legacyRef
-Name Accounting Standards Codification
-Section 30
-Paragraph 8
-SubTopic 30
-Topic 805
-Publisher FASB
-URI https://asc.fasb.org//1943274/2147479637/805-30-30-8
Reference 2: http://fasb.org/us-gaap/role/ref/legacyRef
-Name Accounting Standards Codification
-Section 30
-Paragraph 7
-SubTopic 30
-Topic 805
-Publisher FASB
-URI https://asc.fasb.org//1943274/2147479637/805-30-30-7
| Name: |
us-gaap_BusinessCombinationConsiderationTransferredEquityInterestsIssuedAndIssuable |
| Namespace Prefix: |
us-gaap_ |
| Data Type: |
xbrli:monetaryItemType |
| Balance Type: |
credit |
| Period Type: |
duration |
|
| X |
- DefinitionAmount of tangible or intangible assets, including a business or subsidiary of the acquirer transferred by the entity to the former owners of the acquiree. Excludes cash. Reference 1: http://fasb.org/us-gaap/role/ref/legacyRef
-Name Accounting Standards Codification
-Section 50
-Paragraph 1
-Subparagraph (b)(2)
-SubTopic 30
-Topic 805
-Publisher FASB
-URI https://asc.fasb.org//1943274/2147479581/805-30-50-1
| Name: |
us-gaap_BusinessCombinationConsiderationTransferredOther1 |
| Namespace Prefix: |
us-gaap_ |
| Data Type: |
xbrli:monetaryItemType |
| Balance Type: |
credit |
| Period Type: |
duration |
|
| X |
- DefinitionThe cash outflow associated with the acquisition of business during the period. The cash portion only of the acquisition price. Reference 1: http://www.xbrl.org/2003/role/disclosureRef
-Topic 805
-SubTopic 30
-Name Accounting Standards Codification
-Section 50
-Paragraph 1
-Subparagraph (b)(1)
-Publisher FASB
-URI https://asc.fasb.org//1943274/2147479581/805-30-50-1
Reference 2: http://fasb.org/us-gaap/role/ref/legacyRef
-Name Accounting Standards Codification
-Topic 230
-SubTopic 10
-Section 45
-Paragraph 13
-Subparagraph (b)
-Publisher FASB
-URI https://asc.fasb.org//1943274/2147482740/230-10-45-13
| Name: |
us-gaap_PaymentsToAcquireBusinessesGross |
| Namespace Prefix: |
us-gaap_ |
| Data Type: |
xbrli:monetaryItemType |
| Balance Type: |
credit |
| Period Type: |
duration |
|
| X |
- Details
| Name: |
us-gaap_BusinessAcquisitionAxis=MAMA_CifAcquisitionMember |
| Namespace Prefix: |
|
| Data Type: |
na |
| Balance Type: |
|
| Period Type: |
|
|
v3.23.2
| X |
- DefinitionAmount of customer relationships.
| Name: |
MAMA_BusinessCombinationRecognizedIdentifiableAssetsAcquiredAndLiabilitiesAssumedCustomerRelationships |
| Namespace Prefix: |
MAMA_ |
| Data Type: |
xbrli:monetaryItemType |
| Balance Type: |
debit |
| Period Type: |
instant |
|
| X |
- DefinitionLine items represent financial concepts included in a table. These concepts are used to disclose reportable information associated with domain members defined in one or many axes to the table. Reference 1: http://www.xbrl.org/2003/role/disclosureRef
-Topic 805
-SubTopic 20
-Name Accounting Standards Codification
-Section 50
-Paragraph 5
-Subparagraph (a)
-Publisher FASB
-URI https://asc.fasb.org//1943274/2147479907/805-20-50-5
| Name: |
us-gaap_BusinessAcquisitionLineItems |
| Namespace Prefix: |
us-gaap_ |
| Data Type: |
xbrli:stringItemType |
| Balance Type: |
na |
| Period Type: |
duration |
|
| X |
- DefinitionAmount of assets acquired at the acquisition date. Reference 1: http://fasb.org/us-gaap/role/ref/legacyRef
-Name Accounting Standards Codification
-Topic 805
-SubTopic 20
-Section 50
-Paragraph 1
-Subparagraph (c)
-Publisher FASB
-URI https://asc.fasb.org//1943274/2147479907/805-20-50-1
| Name: |
us-gaap_BusinessCombinationRecognizedIdentifiableAssetsAcquiredAndLiabilitiesAssumedAssets |
| Namespace Prefix: |
us-gaap_ |
| Data Type: |
xbrli:monetaryItemType |
| Balance Type: |
debit |
| Period Type: |
instant |
|
| X |
- DefinitionAmount of currency on hand as well as demand deposits with banks or financial institutions, acquired at the acquisition date. Includes other kinds of accounts that have the general characteristics of demand deposits. Also includes short-term, highly liquid investments that are both readily convertible to known amounts of cash and so near their maturity that they present insignificant risk of changes in value because of changes in interest rates. Reference 1: http://fasb.org/us-gaap/role/ref/legacyRef
-Name Accounting Standards Codification
-Topic 805
-SubTopic 20
-Section 50
-Paragraph 1
-Subparagraph (c)
-Publisher FASB
-URI https://asc.fasb.org//1943274/2147479907/805-20-50-1
| Name: |
us-gaap_BusinessCombinationRecognizedIdentifiableAssetsAcquiredAndLiabilitiesAssumedCashAndEquivalents |
| Namespace Prefix: |
us-gaap_ |
| Data Type: |
xbrli:monetaryItemType |
| Balance Type: |
debit |
| Period Type: |
instant |
|
| X |
- DefinitionAmount of other assets expected to be realized or consumed before one year or the normal operating cycle, if longer, acquired at the acquisition date. Reference 1: http://fasb.org/us-gaap/role/ref/legacyRef
-Name Accounting Standards Codification
-Topic 805
-SubTopic 20
-Section 50
-Paragraph 1
-Subparagraph (c)
-Publisher FASB
-URI https://asc.fasb.org//1943274/2147479907/805-20-50-1
| Name: |
us-gaap_BusinessCombinationRecognizedIdentifiableAssetsAcquiredAndLiabilitiesAssumedCurrentAssetsOther |
| Namespace Prefix: |
us-gaap_ |
| Data Type: |
xbrli:monetaryItemType |
| Balance Type: |
debit |
| Period Type: |
instant |
|
| X |
- Details
| Name: |
us-gaap_BusinessAcquisitionAxis=MAMA_CifAcquisitionMember |
| Namespace Prefix: |
|
| Data Type: |
na |
| Balance Type: |
|
| Period Type: |
|
|
v3.23.2
| X |
- DefinitionLine items represent financial concepts included in a table. These concepts are used to disclose reportable information associated with domain members defined in one or many axes to the table. Reference 1: http://www.xbrl.org/2003/role/disclosureRef
-Topic 805
-SubTopic 20
-Name Accounting Standards Codification
-Section 50
-Paragraph 5
-Subparagraph (a)
-Publisher FASB
-URI https://asc.fasb.org//1943274/2147479907/805-20-50-5
| Name: |
us-gaap_BusinessAcquisitionLineItems |
| Namespace Prefix: |
us-gaap_ |
| Data Type: |
xbrli:stringItemType |
| Balance Type: |
na |
| Period Type: |
duration |
|
| X |
- DefinitionAmount of consideration transferred, consisting of acquisition-date fair value of assets transferred by the acquirer, liabilities incurred by the acquirer, and equity interest issued by the acquirer. Reference 1: http://fasb.org/us-gaap/role/ref/legacyRef
-Name Accounting Standards Codification
-Section 30
-Paragraph 8
-SubTopic 30
-Topic 805
-Publisher FASB
-URI https://asc.fasb.org//1943274/2147479637/805-30-30-8
Reference 2: http://fasb.org/us-gaap/role/ref/legacyRef
-Name Accounting Standards Codification
-Section 50
-Paragraph 1
-Subparagraph (b)
-SubTopic 30
-Topic 805
-Publisher FASB
-URI https://asc.fasb.org//1943274/2147479581/805-30-50-1
Reference 3: http://fasb.org/us-gaap/role/ref/legacyRef
-Name Accounting Standards Codification
-Section 30
-Paragraph 7
-SubTopic 30
-Topic 805
-Publisher FASB
-URI https://asc.fasb.org//1943274/2147479637/805-30-30-7
| Name: |
us-gaap_BusinessCombinationConsiderationTransferred1 |
| Namespace Prefix: |
us-gaap_ |
| Data Type: |
xbrli:monetaryItemType |
| Balance Type: |
credit |
| Period Type: |
duration |
|
| X |
- Details
| Name: |
us-gaap_BusinessAcquisitionAxis=MAMA_CifAcquisitionMember |
| Namespace Prefix: |
|
| Data Type: |
na |
| Balance Type: |
|
| Period Type: |
|
|
v3.23.2
Schedule of Intangibles Assets (Details) - USD ($)
|
Jul. 31, 2023 |
Jan. 31, 2023 |
| Finite-Lived Intangible Assets [Line Items] |
|
|
| Gross Carrying Amount |
$ 6,584,260
|
$ 2,028,639
|
| Accumulated Amortization |
(830,078)
|
(526,129)
|
| Net Carrying Amount |
5,754,182
|
1,502,510
|
| Software [Member] |
|
|
| Finite-Lived Intangible Assets [Line Items] |
|
|
| Gross Carrying Amount |
87,639
|
87,639
|
| Accumulated Amortization |
(87,639)
|
(87,639)
|
| Net Carrying Amount |
|
|
| Weighted Average Remaining Life |
|
|
| Customer Relationships [Member] |
|
|
| Finite-Lived Intangible Assets [Line Items] |
|
|
| Gross Carrying Amount |
$ 6,417,621
|
$ 1,862,000
|
| Accumulated Amortization |
(700,666)
|
(409,776)
|
| Net Carrying Amount |
$ 5,716,955
|
$ 1,452,224
|
| Weighted Average Remaining Life |
3 years 9 months 14 days
|
3 years 4 months 28 days
|
| Trademarks and Trade Names [Member] |
|
|
| Finite-Lived Intangible Assets [Line Items] |
|
|
| Gross Carrying Amount |
$ 79,000
|
$ 79,000
|
| Accumulated Amortization |
(41,773)
|
(28,714)
|
| Net Carrying Amount |
$ 37,227
|
$ 50,286
|
| Weighted Average Remaining Life |
1 year 4 months 28 days
|
1 year 10 months 28 days
|
| X |
- DefinitionAccumulated amount of amortization of assets, excluding financial assets and goodwill, lacking physical substance with a finite life. Reference 1: http://www.xbrl.org/2003/role/disclosureRef
-Topic 210
-SubTopic 10
-Name Accounting Standards Codification
-Section S99
-Paragraph 1
-Subparagraph (SX 210.5-02(16))
-Publisher FASB
-URI https://asc.fasb.org//1943274/2147480566/210-10-S99-1
Reference 2: http://www.xbrl.org/2003/role/disclosureRef
-Topic 350
-SubTopic 30
-Name Accounting Standards Codification
-Section 50
-Paragraph 2
-Subparagraph (a)(1)
-Publisher FASB
-URI https://asc.fasb.org//1943274/2147482665/350-30-50-2
| Name: |
us-gaap_FiniteLivedIntangibleAssetsAccumulatedAmortization |
| Namespace Prefix: |
us-gaap_ |
| Data Type: |
xbrli:monetaryItemType |
| Balance Type: |
credit |
| Period Type: |
instant |
|
| X |
- DefinitionAmount before amortization of assets, excluding financial assets and goodwill, lacking physical substance with a finite life. Reference 1: http://www.xbrl.org/2003/role/disclosureRef
-Topic 928
-SubTopic 340
-Name Accounting Standards Codification
-Section 50
-Paragraph 1
-Publisher FASB
-URI https://asc.fasb.org//1943274/2147483147/928-340-50-1
Reference 2: http://fasb.org/us-gaap/role/ref/legacyRef
-Topic 350
-SubTopic 30
-Name Accounting Standards Codification
-Section 50
-Paragraph 2
-Subparagraph (a)(1)
-Publisher FASB
-URI https://asc.fasb.org//1943274/2147482665/350-30-50-2
| Name: |
us-gaap_FiniteLivedIntangibleAssetsGross |
| Namespace Prefix: |
us-gaap_ |
| Data Type: |
xbrli:monetaryItemType |
| Balance Type: |
debit |
| Period Type: |
instant |
|
| X |
- DefinitionLine items represent financial concepts included in a table. These concepts are used to disclose reportable information associated with domain members defined in one or many axes to the table. Reference 1: http://www.xbrl.org/2003/role/disclosureRef
-Topic 926
-SubTopic 20
-Name Accounting Standards Codification
-Section 50
-Paragraph 5
-Publisher FASB
-URI https://asc.fasb.org//1943274/2147483154/926-20-50-5
| Name: |
us-gaap_FiniteLivedIntangibleAssetsLineItems |
| Namespace Prefix: |
us-gaap_ |
| Data Type: |
xbrli:stringItemType |
| Balance Type: |
na |
| Period Type: |
duration |
|
| X |
- DefinitionAmount after amortization of assets, excluding financial assets and goodwill, lacking physical substance with a finite life. Reference 1: http://www.xbrl.org/2003/role/disclosureRef
-Topic 926
-SubTopic 20
-Name Accounting Standards Codification
-Section 50
-Paragraph 5
-Publisher FASB
-URI https://asc.fasb.org//1943274/2147483154/926-20-50-5
Reference 2: http://fasb.org/us-gaap/role/ref/legacyRef
-Topic 350
-SubTopic 30
-Name Accounting Standards Codification
-Section 50
-Paragraph 2
-Subparagraph (a)(1)
-Publisher FASB
-URI https://asc.fasb.org//1943274/2147482665/350-30-50-2
| Name: |
us-gaap_FiniteLivedIntangibleAssetsNet |
| Namespace Prefix: |
us-gaap_ |
| Data Type: |
xbrli:monetaryItemType |
| Balance Type: |
debit |
| Period Type: |
instant |
|
| X |
- DefinitionRemaining amortization period of finite-lived intangible assets, in 'PnYnMnDTnHnMnS' format, for example, 'P1Y5M13D' represents the reported fact of one year, five months, and thirteen days. Reference 1: http://www.xbrl.org/2003/role/disclosureRef
-Topic 926
-SubTopic 20
-Name Accounting Standards Codification
-Section 50
-Paragraph 5
-Publisher FASB
-URI https://asc.fasb.org//1943274/2147483154/926-20-50-5
| Name: |
us-gaap_FiniteLivedIntangibleAssetsRemainingAmortizationPeriod1 |
| Namespace Prefix: |
us-gaap_ |
| Data Type: |
xbrli:durationItemType |
| Balance Type: |
na |
| Period Type: |
instant |
|
| X |
- Details
| Name: |
us-gaap_FiniteLivedIntangibleAssetsByMajorClassAxis=MAMA_SoftwareMember |
| Namespace Prefix: |
|
| Data Type: |
na |
| Balance Type: |
|
| Period Type: |
|
|
| X |
- Details
| Name: |
us-gaap_FiniteLivedIntangibleAssetsByMajorClassAxis=us-gaap_CustomerRelationshipsMember |
| Namespace Prefix: |
|
| Data Type: |
na |
| Balance Type: |
|
| Period Type: |
|
|
| X |
- Details
| Name: |
us-gaap_FiniteLivedIntangibleAssetsByMajorClassAxis=us-gaap_TrademarksAndTradeNamesMember |
| Namespace Prefix: |
|
| Data Type: |
na |
| Balance Type: |
|
| Period Type: |
|
|
v3.23.2
Schedule of Estimated Aggregate Amortization Expense (Details) - USD ($)
|
Jul. 31, 2023 |
Jan. 31, 2023 |
| Goodwill and Intangible Assets Disclosure [Abstract] |
|
|
| 2024 (Remaining) |
$ 768,954
|
|
| 2025 |
1,538,766
|
|
| 2026 |
1,513,238
|
|
| 2027 |
1,466,741
|
|
| 2028 |
466,483
|
|
| Total |
$ 5,754,182
|
$ 1,502,510
|
| X |
- DefinitionAmount of amortization for assets, excluding financial assets and goodwill, lacking physical substance with finite life expected to be recognized in next fiscal year following current fiscal year. Excludes interim and annual periods when interim periods are reported from current statement of financial position date (rolling approach). Reference 1: http://fasb.org/us-gaap/role/ref/legacyRef
-Topic 350
-SubTopic 30
-Name Accounting Standards Codification
-Section 50
-Paragraph 2
-Subparagraph (a)(3)
-Publisher FASB
-URI https://asc.fasb.org//1943274/2147482665/350-30-50-2
| Name: |
us-gaap_FiniteLivedIntangibleAssetsAmortizationExpenseNextTwelveMonths |
| Namespace Prefix: |
us-gaap_ |
| Data Type: |
xbrli:monetaryItemType |
| Balance Type: |
debit |
| Period Type: |
instant |
|
| X |
- DefinitionAmount of amortization for assets, excluding financial assets and goodwill, lacking physical substance with finite life expected to be recognized in remainder of current fiscal year.
| Name: |
us-gaap_FiniteLivedIntangibleAssetsAmortizationExpenseRemainderOfFiscalYear |
| Namespace Prefix: |
us-gaap_ |
| Data Type: |
xbrli:monetaryItemType |
| Balance Type: |
debit |
| Period Type: |
instant |
|
| X |
- DefinitionAmount of amortization for assets, excluding financial assets and goodwill, lacking physical substance with finite life expected to be recognized in fourth fiscal year following current fiscal year. Excludes interim and annual periods when interim periods are reported from current statement of financial position date (rolling approach). Reference 1: http://fasb.org/us-gaap/role/ref/legacyRef
-Topic 350
-SubTopic 30
-Name Accounting Standards Codification
-Section 50
-Paragraph 2
-Subparagraph (a)(3)
-Publisher FASB
-URI https://asc.fasb.org//1943274/2147482665/350-30-50-2
| Name: |
us-gaap_FiniteLivedIntangibleAssetsAmortizationExpenseYearFour |
| Namespace Prefix: |
us-gaap_ |
| Data Type: |
xbrli:monetaryItemType |
| Balance Type: |
debit |
| Period Type: |
instant |
|
| X |
- DefinitionAmount of amortization for assets, excluding financial assets and goodwill, lacking physical substance with finite life expected to be recognized in third fiscal year following current fiscal year. Excludes interim and annual periods when interim periods are reported from current statement of financial position date (rolling approach). Reference 1: http://fasb.org/us-gaap/role/ref/legacyRef
-Topic 350
-SubTopic 30
-Name Accounting Standards Codification
-Section 50
-Paragraph 2
-Subparagraph (a)(3)
-Publisher FASB
-URI https://asc.fasb.org//1943274/2147482665/350-30-50-2
| Name: |
us-gaap_FiniteLivedIntangibleAssetsAmortizationExpenseYearThree |
| Namespace Prefix: |
us-gaap_ |
| Data Type: |
xbrli:monetaryItemType |
| Balance Type: |
debit |
| Period Type: |
instant |
|
| X |
- DefinitionAmount of amortization for assets, excluding financial assets and goodwill, lacking physical substance with finite life expected to be recognized in second fiscal year following current fiscal year. Excludes interim and annual periods when interim periods are reported from current statement of financial position date (rolling approach). Reference 1: http://fasb.org/us-gaap/role/ref/legacyRef
-Topic 350
-SubTopic 30
-Name Accounting Standards Codification
-Section 50
-Paragraph 2
-Subparagraph (a)(3)
-Publisher FASB
-URI https://asc.fasb.org//1943274/2147482665/350-30-50-2
| Name: |
us-gaap_FiniteLivedIntangibleAssetsAmortizationExpenseYearTwo |
| Namespace Prefix: |
us-gaap_ |
| Data Type: |
xbrli:monetaryItemType |
| Balance Type: |
debit |
| Period Type: |
instant |
|
| X |
- DefinitionAmount after amortization of assets, excluding financial assets and goodwill, lacking physical substance with a finite life. Reference 1: http://www.xbrl.org/2003/role/disclosureRef
-Topic 926
-SubTopic 20
-Name Accounting Standards Codification
-Section 50
-Paragraph 5
-Publisher FASB
-URI https://asc.fasb.org//1943274/2147483154/926-20-50-5
Reference 2: http://fasb.org/us-gaap/role/ref/legacyRef
-Topic 350
-SubTopic 30
-Name Accounting Standards Codification
-Section 50
-Paragraph 2
-Subparagraph (a)(1)
-Publisher FASB
-URI https://asc.fasb.org//1943274/2147482665/350-30-50-2
| Name: |
us-gaap_FiniteLivedIntangibleAssetsNet |
| Namespace Prefix: |
us-gaap_ |
| Data Type: |
xbrli:monetaryItemType |
| Balance Type: |
debit |
| Period Type: |
instant |
|
| X |
- References
+ Details
| Name: |
us-gaap_GoodwillAndIntangibleAssetsDisclosureAbstract |
| Namespace Prefix: |
us-gaap_ |
| Data Type: |
xbrli:stringItemType |
| Balance Type: |
na |
| Period Type: |
duration |
|
v3.23.2
Intangible assets, net (Details Narrative) - USD ($)
|
3 Months Ended |
6 Months Ended |
|
Jul. 31, 2023 |
Jul. 31, 2022 |
Jul. 31, 2023 |
Jul. 31, 2022 |
Jun. 28, 2023 |
| Restructuring Cost and Reserve [Line Items] |
|
|
|
|
|
| Amortization expense |
$ 202,053
|
$ 116,986
|
$ 303,949
|
$ 230,156
|
|
| CIF Acquisition [Member] |
|
|
|
|
|
| Restructuring Cost and Reserve [Line Items] |
|
|
|
|
|
| Customer relationships |
|
|
|
|
$ 4,555,621
|
| X |
- DefinitionAmount of customer relationships.
| Name: |
MAMA_BusinessCombinationRecognizedIdentifiableAssetsAcquiredAndLiabilitiesAssumedCustomerRelationships |
| Namespace Prefix: |
MAMA_ |
| Data Type: |
xbrli:monetaryItemType |
| Balance Type: |
debit |
| Period Type: |
instant |
|
| X |
- DefinitionThe aggregate expense charged against earnings to allocate the cost of intangible assets (nonphysical assets not used in production) in a systematic and rational manner to the periods expected to benefit from such assets. As a noncash expense, this element is added back to net income when calculating cash provided by or used in operations using the indirect method. Reference 1: http://fasb.org/us-gaap/role/ref/legacyRef
-Name Accounting Standards Codification
-Section 45
-Paragraph 28
-Subparagraph (b)
-SubTopic 10
-Topic 230
-Publisher FASB
-URI https://asc.fasb.org//1943274/2147482740/230-10-45-28
Reference 2: http://fasb.org/us-gaap/role/ref/legacyRef
-Name Accounting Standards Codification
-Topic 350
-SubTopic 30
-Section 45
-Paragraph 2
-Publisher FASB
-URI https://asc.fasb.org//1943274/2147482686/350-30-45-2
Reference 3: http://fasb.org/us-gaap/role/ref/legacyRef
-Name Accounting Standards Codification
-Topic 350
-SubTopic 30
-Section 50
-Paragraph 2
-Subparagraph (a)(2)
-Publisher FASB
-URI https://asc.fasb.org//1943274/2147482665/350-30-50-2
| Name: |
us-gaap_AmortizationOfIntangibleAssets |
| Namespace Prefix: |
us-gaap_ |
| Data Type: |
xbrli:monetaryItemType |
| Balance Type: |
debit |
| Period Type: |
duration |
|
| X |
- DefinitionLine items represent financial concepts included in a table. These concepts are used to disclose reportable information associated with domain members defined in one or many axes to the table. Reference 1: http://www.xbrl.org/2003/role/disclosureRef
-Topic 420
-SubTopic 10
-Name Accounting Standards Codification
-Section 50
-Paragraph 1
-Subparagraph (c)
-Publisher FASB
-URI https://asc.fasb.org//1943274/2147482017/420-10-50-1
Reference 2: http://www.xbrl.org/2003/role/disclosureRef
-Topic 420
-SubTopic 10
-Name Accounting Standards Codification
-Section 50
-Paragraph 1
-Subparagraph (b)(2)
-Publisher FASB
-URI https://asc.fasb.org//1943274/2147482017/420-10-50-1
Reference 3: http://www.xbrl.org/2003/role/disclosureRef
-Topic 420
-SubTopic 10
-Name Accounting Standards Codification
-Section 50
-Paragraph 1
-Subparagraph (b)(1)
-Publisher FASB
-URI https://asc.fasb.org//1943274/2147482017/420-10-50-1
Reference 4: http://www.xbrl.org/2003/role/disclosureRef
-Topic 420
-SubTopic 10
-Name Accounting Standards Codification
-Section S99
-Paragraph 2
-Subparagraph (SAB Topic 5.P.4(b)(2))
-Publisher FASB
-URI https://asc.fasb.org//1943274/2147479823/420-10-S99-2
Reference 5: http://www.xbrl.org/2003/role/disclosureRef
-Topic 420
-SubTopic 10
-Name Accounting Standards Codification
-Section S99
-Paragraph 2
-Subparagraph (SAB Topic 5.P.4(b)(1))
-Publisher FASB
-URI https://asc.fasb.org//1943274/2147479823/420-10-S99-2
Reference 6: http://www.xbrl.org/2003/role/disclosureRef
-Topic 420
-SubTopic 10
-Name Accounting Standards Codification
-Section S99
-Paragraph 2
-Subparagraph (SAB Topic 5.P.4(d))
-Publisher FASB
-URI https://asc.fasb.org//1943274/2147479823/420-10-S99-2
Reference 7: http://www.xbrl.org/2003/role/disclosureRef
-Topic 420
-SubTopic 10
-Name Accounting Standards Codification
-Section 50
-Paragraph 1
-Subparagraph (d)
-Publisher FASB
-URI https://asc.fasb.org//1943274/2147482017/420-10-50-1
| Name: |
us-gaap_RestructuringCostAndReserveLineItems |
| Namespace Prefix: |
us-gaap_ |
| Data Type: |
xbrli:stringItemType |
| Balance Type: |
na |
| Period Type: |
duration |
|
| X |
- Details
| Name: |
us-gaap_BusinessAcquisitionAxis=MAMA_CifAcquisitionMember |
| Namespace Prefix: |
|
| Data Type: |
na |
| Balance Type: |
|
| Period Type: |
|
|
v3.23.2
Related Party Transactions (Details Narrative) - USD ($)
|
2 Months Ended |
3 Months Ended |
5 Months Ended |
6 Months Ended |
|
|
|
Jun. 28, 2023 |
Jul. 31, 2023 |
Jul. 31, 2022 |
Jun. 28, 2023 |
Jul. 31, 2023 |
Jul. 31, 2022 |
Jan. 31, 2023 |
Jun. 28, 2022 |
Dec. 29, 2021 |
| Chef Inspirational Foods, Inc. [Member] |
|
|
|
|
|
|
|
|
|
| Related Party Transaction [Line Items] |
|
|
|
|
|
|
|
|
|
| Minority interest rate |
|
|
|
|
|
|
|
24.00%
|
|
| Farmingdale [Member] |
|
|
|
|
|
|
|
|
|
| Related Party Transaction [Line Items] |
|
|
|
|
|
|
|
|
|
| Lease expiration date |
|
|
|
|
Nov. 30, 2031
|
|
|
|
|
| Option to extend lease term |
|
|
|
|
the
option to extend the lease for two additional ten-year terms
|
|
|
|
|
| Rent expenses |
|
$ 105,691
|
$ 65,608
|
|
$ 171,299
|
$ 131,216
|
|
|
|
| Farmingdale [Member] | December 31, 2026 [Member] |
|
|
|
|
|
|
|
|
|
| Related Party Transaction [Line Items] |
|
|
|
|
|
|
|
|
|
| Rent expenses |
|
|
|
|
20,200
|
|
|
|
|
| Farmingdale [Member] | End of Initial Lease Term [Member] |
|
|
|
|
|
|
|
|
|
| Related Party Transaction [Line Items] |
|
|
|
|
|
|
|
|
|
| Rent expenses |
|
|
|
|
23,567
|
|
|
|
|
| Related Party [Member] |
|
|
|
|
|
|
|
|
|
| Related Party Transaction [Line Items] |
|
|
|
|
|
|
|
|
|
| Outstanding balance including accrued interest |
|
1,950,000
|
|
|
1,950,000
|
|
$ 750,000
|
|
|
| Long term notes payable |
|
3,000,000
|
|
|
3,000,000
|
|
1,500,000
|
|
|
| Related Party [Member] | Chef Inspirational Foods, Inc. [Member] |
|
|
|
|
|
|
|
|
|
| Related Party Transaction [Line Items] |
|
|
|
|
|
|
|
|
|
| Sales revenue |
$ 4,349,203
|
|
|
$ 10,889,277
|
|
|
|
|
|
| Account receivable balance |
|
|
|
|
|
|
1,449,009
|
|
|
| Promissory Note [Member] |
|
|
|
|
|
|
|
|
|
| Related Party Transaction [Line Items] |
|
|
|
|
|
|
|
|
|
| Outstanding balance including accrued interest |
|
|
|
|
|
|
|
|
$ 3,000,000
|
| Annual principal payment |
|
|
|
|
|
|
|
|
$ 750,000
|
| Debt interest rate |
|
|
|
|
|
|
|
|
3.50%
|
| Interest expenses |
|
20,137
|
$ 27,237
|
|
39,451
|
$ 53,356
|
|
|
|
| Accrued interest |
|
46,140
|
|
|
46,140
|
|
6,688
|
|
|
| Related party transaction purchases from related party |
|
|
|
|
600,000
|
|
|
|
|
| Promissory Note [Member] | First Anniversary [Member] |
|
|
|
|
|
|
|
|
|
| Related Party Transaction [Line Items] |
|
|
|
|
|
|
|
|
|
| Related party transaction purchases from related party |
|
|
|
|
750,000
|
|
|
|
|
| Promissory Note [Member] | Related Party [Member] |
|
|
|
|
|
|
|
|
|
| Related Party Transaction [Line Items] |
|
|
|
|
|
|
|
|
|
| Outstanding balance including accrued interest |
|
2,250,000
|
|
|
2,250,000
|
|
2,250,000
|
|
|
| Outstanding balance including accrued interest |
|
750,000
|
|
|
750,000
|
|
750,000
|
|
|
| Long term notes payable |
|
1,500,000
|
|
|
1,500,000
|
|
$ 1,500,000
|
|
|
| Outstanding balance including accrued interest |
|
$ 1,200,000
|
|
|
$ 1,200,000
|
|
|
|
|
| X |
- DefinitionPercentage of voting equity interests acquired at the acquisition date in the business combination. Reference 1: http://fasb.org/us-gaap/role/ref/legacyRef
-Name Accounting Standards Codification
-Topic 805
-SubTopic 10
-Section 50
-Paragraph 2
-Subparagraph (c)
-Publisher FASB
-URI https://asc.fasb.org//1943274/2147479328/805-10-50-2
| Name: |
us-gaap_BusinessAcquisitionPercentageOfVotingInterestsAcquired |
| Namespace Prefix: |
us-gaap_ |
| Data Type: |
dtr-types:percentItemType |
| Balance Type: |
na |
| Period Type: |
instant |
|
| X |
- DefinitionAmount of the total principal payments made during the annual reporting period. Reference 1: http://fasb.org/us-gaap/role/ref/legacyRef
-Name Accounting Standards Codification
-Section S99
-Paragraph 1
-Subparagraph (SX 210.5-02(22))
-SubTopic 10
-Topic 210
-Publisher FASB
-URI https://asc.fasb.org//1943274/2147480566/210-10-S99-1
| Name: |
us-gaap_DebtInstrumentAnnualPrincipalPayment |
| Namespace Prefix: |
us-gaap_ |
| Data Type: |
xbrli:monetaryItemType |
| Balance Type: |
debit |
| Period Type: |
instant |
|
| X |
- DefinitionFace (par) amount of debt instrument at time of issuance. Reference 1: http://www.xbrl.org/2003/role/disclosureRef
-Topic 835
-SubTopic 30
-Name Accounting Standards Codification
-Section 50
-Paragraph 1
-Publisher FASB
-URI https://asc.fasb.org//1943274/2147482900/835-30-50-1
Reference 2: http://www.xbrl.org/2003/role/disclosureRef
-Topic 470
-SubTopic 20
-Name Accounting Standards Codification
-Section 50
-Paragraph 1B
-Subparagraph (a)
-Publisher FASB
-URI https://asc.fasb.org//1943274/2147481139/470-20-50-1B
Reference 3: http://www.xbrl.org/2003/role/exampleRef
-Topic 470
-SubTopic 20
-Name Accounting Standards Codification
-Section 55
-Paragraph 69B
-Publisher FASB
-URI https://asc.fasb.org//1943274/2147481568/470-20-55-69B
Reference 4: http://www.xbrl.org/2003/role/exampleRef
-Topic 470
-SubTopic 20
-Name Accounting Standards Codification
-Section 55
-Paragraph 69C
-Publisher FASB
-URI https://asc.fasb.org//1943274/2147481568/470-20-55-69C
Reference 5: http://fasb.org/us-gaap/role/ref/legacyRef
-Name Accounting Standards Codification
-Topic 835
-SubTopic 30
-Section 45
-Paragraph 2
-Publisher FASB
-URI https://asc.fasb.org//1943274/2147482925/835-30-45-2
Reference 6: http://fasb.org/us-gaap/role/ref/legacyRef
-Name Accounting Standards Codification
-Topic 835
-SubTopic 30
-Section 55
-Paragraph 8
-Publisher FASB
-URI https://asc.fasb.org//1943274/2147482949/835-30-55-8
| Name: |
us-gaap_DebtInstrumentFaceAmount |
| Namespace Prefix: |
us-gaap_ |
| Data Type: |
xbrli:monetaryItemType |
| Balance Type: |
credit |
| Period Type: |
instant |
|
| X |
- DefinitionContractual interest rate for funds borrowed, under the debt agreement. Reference 1: http://www.xbrl.org/2003/role/disclosureRef
-Topic 470
-SubTopic 20
-Name Accounting Standards Codification
-Section 50
-Paragraph 1B
-Subparagraph (b)
-Publisher FASB
-URI https://asc.fasb.org//1943274/2147481139/470-20-50-1B
Reference 2: http://fasb.org/us-gaap/role/ref/legacyRef
-Name Accounting Standards Codification
-Topic 210
-SubTopic 10
-Section S99
-Paragraph 1
-Subparagraph (SX 210.5-02.22(a)(1))
-Publisher FASB
-URI https://asc.fasb.org//1943274/2147480566/210-10-S99-1
| Name: |
us-gaap_DebtInstrumentInterestRateStatedPercentage |
| Namespace Prefix: |
us-gaap_ |
| Data Type: |
dtr-types:percentItemType |
| Balance Type: |
na |
| Period Type: |
instant |
|
| X |
- DefinitionAmount of the cost of borrowed funds accounted for as interest expense. Reference 1: http://www.xbrl.org/2003/role/exampleRef
-Topic 946
-SubTopic 830
-Name Accounting Standards Codification
-Section 55
-Paragraph 10
-Publisher FASB
-URI https://asc.fasb.org//1943274/2147480167/946-830-55-10
Reference 2: http://www.xbrl.org/2009/role/commonPracticeRef
-Topic 946
-SubTopic 220
-Name Accounting Standards Codification
-Section 45
-Paragraph 3
-Subparagraph (i)
-Publisher FASB
-URI https://asc.fasb.org//1943274/2147483581/946-220-45-3
Reference 3: http://www.xbrl.org/2003/role/disclosureRef
-Topic 946
-SubTopic 220
-Name Accounting Standards Codification
-Section S99
-Paragraph 1
-Subparagraph (SX 210.6-07(3))
-Publisher FASB
-URI https://asc.fasb.org//1943274/2147483575/946-220-S99-1
Reference 4: http://www.xbrl.org/2003/role/disclosureRef
-Topic 280
-SubTopic 10
-Name Accounting Standards Codification
-Section 50
-Paragraph 22
-Subparagraph (d)
-Publisher FASB
-URI https://asc.fasb.org//1943274/2147482810/280-10-50-22
Reference 5: http://fasb.org/us-gaap/role/ref/legacyRef
-Name Accounting Standards Codification
-Topic 835
-SubTopic 30
-Section 45
-Paragraph 3
-Publisher FASB
-URI https://asc.fasb.org//1943274/2147482925/835-30-45-3
Reference 6: http://fasb.org/us-gaap/role/ref/legacyRef
-Topic 942
-SubTopic 220
-Name Accounting Standards Codification
-Section S99
-Paragraph 1
-Subparagraph (SX 210.9-04.9)
-Publisher FASB
-URI https://asc.fasb.org//1943274/2147483589/942-220-S99-1
Reference 7: http://www.xbrl.org/2003/role/disclosureRef
-Topic 220
-SubTopic 10
-Name Accounting Standards Codification
-Section S99
-Paragraph 2
-Subparagraph (210.5-03(11))
-Publisher FASB
-URI https://asc.fasb.org//1943274/2147483621/220-10-S99-2
Reference 8: http://www.xbrl.org/2003/role/disclosureRef
-Topic 835
-SubTopic 20
-Name Accounting Standards Codification
-Section 50
-Paragraph 1
-Subparagraph (a)
-Publisher FASB
-URI https://asc.fasb.org//1943274/2147483013/835-20-50-1
| Name: |
us-gaap_InterestExpense |
| Namespace Prefix: |
us-gaap_ |
| Data Type: |
xbrli:monetaryItemType |
| Balance Type: |
debit |
| Period Type: |
duration |
|
| X |
- DefinitionCarrying value as of the balance sheet date of [accrued] interest payable on all forms of debt, including trade payables, that has been incurred and is unpaid. Used to reflect the current portion of the liabilities (due within one year or within the normal operating cycle if longer). Reference 1: http://fasb.org/us-gaap/role/ref/legacyRef
-Name Accounting Standards Codification
-Topic 210
-SubTopic 10
-Section S99
-Paragraph 1
-Subparagraph (SX 210.5-02.20)
-Publisher FASB
-URI https://asc.fasb.org//1943274/2147480566/210-10-S99-1
| Name: |
us-gaap_InterestPayableCurrent |
| Namespace Prefix: |
us-gaap_ |
| Data Type: |
xbrli:monetaryItemType |
| Balance Type: |
credit |
| Period Type: |
instant |
|
| X |
- DefinitionDate which lease or group of leases is set to expire, in YYYY-MM-DD format.
| Name: |
us-gaap_LeaseExpirationDate1 |
| Namespace Prefix: |
us-gaap_ |
| Data Type: |
xbrli:dateItemType |
| Balance Type: |
na |
| Period Type: |
duration |
|
| X |
- DefinitionDescription of terms and conditions of option to extend lessee's operating lease. Includes, but is not limited to, information about option recognized as part of right-of-use asset and lease liability. Reference 1: http://www.xbrl.org/2003/role/disclosureRef
-Topic 842
-SubTopic 20
-Name Accounting Standards Codification
-Section 50
-Paragraph 3
-Subparagraph (a)(3)
-Publisher FASB
-URI https://asc.fasb.org//1943274/2147478964/842-20-50-3
| Name: |
us-gaap_LesseeOperatingLeaseOptionToExtend |
| Namespace Prefix: |
us-gaap_ |
| Data Type: |
xbrli:stringItemType |
| Balance Type: |
na |
| Period Type: |
duration |
|
| X |
- DefinitionCarrying value as of the balance sheet date of notes payable (with maturities initially due after one year or beyond the operating cycle if longer), excluding current portion. Reference 1: http://fasb.org/us-gaap/role/ref/legacyRef
-Name Accounting Standards Codification
-Topic 210
-SubTopic 10
-Section S99
-Paragraph 1
-Subparagraph (SX 210.5-02.22)
-Publisher FASB
-URI https://asc.fasb.org//1943274/2147480566/210-10-S99-1
| Name: |
us-gaap_LongTermNotesPayable |
| Namespace Prefix: |
us-gaap_ |
| Data Type: |
xbrli:monetaryItemType |
| Balance Type: |
credit |
| Period Type: |
instant |
|
| X |
- DefinitionIncluding the current and noncurrent portions, aggregate carrying amount of all types of notes payable, as of the balance sheet date, with initial maturities beyond one year or beyond the normal operating cycle, if longer. Reference 1: http://fasb.org/us-gaap/role/ref/legacyRef
-Name Accounting Standards Codification
-Section S99
-Paragraph 1
-Subparagraph (SX 210.5-02(22))
-SubTopic 10
-Topic 210
-Publisher FASB
-URI https://asc.fasb.org//1943274/2147480566/210-10-S99-1
Reference 2: http://www.xbrl.org/2009/role/commonPracticeRef
-Topic 944
-SubTopic 210
-Name Accounting Standards Codification
-Section S99
-Paragraph 1
-Subparagraph (SX 210.7-03(a)(16)(a)(2))
-Publisher FASB
-URI https://asc.fasb.org//1943274/2147479440/944-210-S99-1
Reference 3: http://fasb.org/us-gaap/role/ref/legacyRef
-Topic 942
-SubTopic 210
-Name Accounting Standards Codification
-Section S99
-Paragraph 1
-Subparagraph (SX 210.9-03(16))
-Publisher FASB
-URI https://asc.fasb.org//1943274/2147479853/942-210-S99-1
| Name: |
us-gaap_NotesPayable |
| Namespace Prefix: |
us-gaap_ |
| Data Type: |
xbrli:monetaryItemType |
| Balance Type: |
credit |
| Period Type: |
instant |
|
| X |
- DefinitionSum of the carrying values as of the balance sheet date of the portions of long-term notes payable due within one year or the operating cycle if longer. Reference 1: http://fasb.org/us-gaap/role/ref/legacyRef
-Name Accounting Standards Codification
-Topic 210
-SubTopic 10
-Section S99
-Paragraph 1
-Subparagraph (SX 210.5-02.19,20)
-Publisher FASB
-URI https://asc.fasb.org//1943274/2147480566/210-10-S99-1
| Name: |
us-gaap_NotesPayableCurrent |
| Namespace Prefix: |
us-gaap_ |
| Data Type: |
xbrli:monetaryItemType |
| Balance Type: |
credit |
| Period Type: |
instant |
|
| X |
- DefinitionCash payments to lessor's for use of assets under operating leases. Reference 1: http://fasb.org/us-gaap/role/ref/legacyRef
-Name Accounting Standards Codification
-Section 45
-Paragraph 25
-Subparagraph (g)
-SubTopic 10
-Topic 230
-Publisher FASB
-URI https://asc.fasb.org//1943274/2147482740/230-10-45-25
| Name: |
us-gaap_PaymentsForRent |
| Namespace Prefix: |
us-gaap_ |
| Data Type: |
xbrli:monetaryItemType |
| Balance Type: |
credit |
| Period Type: |
duration |
|
| X |
- DefinitionAmount of revenue recognized from goods sold, services rendered, insurance premiums, or other activities that constitute an earning process. Includes, but is not limited to, investment and interest income before deduction of interest expense when recognized as a component of revenue, and sales and trading gain (loss). Reference 1: http://www.xbrl.org/2003/role/disclosureRef
-Topic 235
-SubTopic 10
-Name Accounting Standards Codification
-Section S99
-Paragraph 1
-Subparagraph (SX 210.4-08(g)(1)(ii))
-Publisher FASB
-URI https://asc.fasb.org//1943274/2147480678/235-10-S99-1
Reference 2: http://www.xbrl.org/2003/role/disclosureRef
-Topic 323
-SubTopic 10
-Name Accounting Standards Codification
-Section 50
-Paragraph 3
-Subparagraph (c)
-Publisher FASB
-URI https://asc.fasb.org//1943274/2147481687/323-10-50-3
Reference 3: http://www.xbrl.org/2003/role/disclosureRef
-Topic 825
-SubTopic 10
-Name Accounting Standards Codification
-Section 50
-Paragraph 28
-Subparagraph (f)
-Publisher FASB
-URI https://asc.fasb.org//1943274/2147482907/825-10-50-28
Reference 4: http://www.xbrl.org/2003/role/disclosureRef
-Topic 220
-SubTopic 10
-Name Accounting Standards Codification
-Section S99
-Paragraph 2
-Subparagraph (SX 210.5-03(1))
-Publisher FASB
-URI https://asc.fasb.org//1943274/2147483621/220-10-S99-2
Reference 5: http://www.xbrl.org/2003/role/disclosureRef
-Topic 470
-SubTopic 10
-Name Accounting Standards Codification
-Section S99
-Paragraph 1A
-Subparagraph (SX 210.13-01(a)(4)(i))
-Publisher FASB
-URI https://asc.fasb.org//1943274/2147480097/470-10-S99-1A
Reference 6: http://www.xbrl.org/2009/role/commonPracticeRef
-Topic 470
-SubTopic 10
-Name Accounting Standards Codification
-Section S99
-Paragraph 1A
-Subparagraph (SX 210.13-01(a)(4)(ii))
-Publisher FASB
-URI https://asc.fasb.org//1943274/2147480097/470-10-S99-1A
Reference 7: http://www.xbrl.org/2003/role/disclosureRef
-Topic 470
-SubTopic 10
-Name Accounting Standards Codification
-Section S99
-Paragraph 1A
-Subparagraph (SX 210.13-01(a)(4)(iii)(A))
-Publisher FASB
-URI https://asc.fasb.org//1943274/2147480097/470-10-S99-1A
Reference 8: http://www.xbrl.org/2003/role/disclosureRef
-Topic 470
-SubTopic 10
-Name Accounting Standards Codification
-Section S99
-Paragraph 1A
-Subparagraph (SX 210.13-01(a)(4)(iv))
-Publisher FASB
-URI https://asc.fasb.org//1943274/2147480097/470-10-S99-1A
Reference 9: http://www.xbrl.org/2003/role/disclosureRef
-Topic 470
-SubTopic 10
-Name Accounting Standards Codification
-Section S99
-Paragraph 1A
-Subparagraph (SX 210.13-01(a)(5))
-Publisher FASB
-URI https://asc.fasb.org//1943274/2147480097/470-10-S99-1A
Reference 10: http://www.xbrl.org/2003/role/disclosureRef
-Topic 470
-SubTopic 10
-Name Accounting Standards Codification
-Section S99
-Paragraph 1B
-Subparagraph (SX 210.13-02(a)(4)(i))
-Publisher FASB
-URI https://asc.fasb.org//1943274/2147480097/470-10-S99-1B
Reference 11: http://www.xbrl.org/2003/role/disclosureRef
-Topic 470
-SubTopic 10
-Name Accounting Standards Codification
-Section S99
-Paragraph 1B
-Subparagraph (SX 210.13-02(a)(4)(iii)(A))
-Publisher FASB
-URI https://asc.fasb.org//1943274/2147480097/470-10-S99-1B
Reference 12: http://www.xbrl.org/2003/role/disclosureRef
-Topic 470
-SubTopic 10
-Name Accounting Standards Codification
-Section S99
-Paragraph 1B
-Subparagraph (SX 210.13-02(a)(4)(iii)(B))
-Publisher FASB
-URI https://asc.fasb.org//1943274/2147480097/470-10-S99-1B
Reference 13: http://www.xbrl.org/2003/role/disclosureRef
-Topic 470
-SubTopic 10
-Name Accounting Standards Codification
-Section S99
-Paragraph 1B
-Subparagraph (SX 210.13-02(a)(4)(iv))
-Publisher FASB
-URI https://asc.fasb.org//1943274/2147480097/470-10-S99-1B
Reference 14: http://www.xbrl.org/2003/role/disclosureRef
-Topic 470
-SubTopic 10
-Name Accounting Standards Codification
-Section S99
-Paragraph 1B
-Subparagraph (SX 210.13-02(a)(5))
-Publisher FASB
-URI https://asc.fasb.org//1943274/2147480097/470-10-S99-1B
Reference 15: http://www.xbrl.org/2003/role/disclosureRef
-Topic 280
-SubTopic 10
-Name Accounting Standards Codification
-Section 50
-Paragraph 30
-Subparagraph (a)
-Publisher FASB
-URI https://asc.fasb.org//1943274/2147482810/280-10-50-30
Reference 16: http://www.xbrl.org/2003/role/disclosureRef
-Topic 280
-SubTopic 10
-Name Accounting Standards Codification
-Section 50
-Paragraph 42
-Publisher FASB
-URI https://asc.fasb.org//1943274/2147482810/280-10-50-42
Reference 17: http://www.xbrl.org/2003/role/disclosureRef
-Topic 280
-SubTopic 10
-Name Accounting Standards Codification
-Section 50
-Paragraph 22
-Subparagraph (b)
-Publisher FASB
-URI https://asc.fasb.org//1943274/2147482810/280-10-50-22
Reference 18: http://www.xbrl.org/2003/role/disclosureRef
-Topic 280
-SubTopic 10
-Name Accounting Standards Codification
-Section 50
-Paragraph 32
-Subparagraph (b)
-Publisher FASB
-URI https://asc.fasb.org//1943274/2147482810/280-10-50-32
Reference 19: http://www.xbrl.org/2003/role/disclosureRef
-Topic 280
-SubTopic 10
-Name Accounting Standards Codification
-Section 50
-Paragraph 40
-Publisher FASB
-URI https://asc.fasb.org//1943274/2147482810/280-10-50-40
Reference 20: http://www.xbrl.org/2003/role/disclosureRef
-Topic 280
-SubTopic 10
-Name Accounting Standards Codification
-Section 50
-Paragraph 22
-Subparagraph (a)
-Publisher FASB
-URI https://asc.fasb.org//1943274/2147482810/280-10-50-22
Reference 21: http://www.xbrl.org/2003/role/disclosureRef
-Topic 280
-SubTopic 10
-Name Accounting Standards Codification
-Section 50
-Paragraph 32
-Subparagraph (a)
-Publisher FASB
-URI https://asc.fasb.org//1943274/2147482810/280-10-50-32
Reference 22: http://www.xbrl.org/2003/role/disclosureRef
-Topic 280
-SubTopic 10
-Name Accounting Standards Codification
-Section 50
-Paragraph 41
-Subparagraph (a)
-Publisher FASB
-URI https://asc.fasb.org//1943274/2147482810/280-10-50-41
Reference 23: http://www.xbrl.org/2003/role/disclosureRef
-Topic 942
-SubTopic 235
-Name Accounting Standards Codification
-Section S99
-Paragraph 1
-Subparagraph (SX 210.9-05(b)(2))
-Publisher FASB
-URI https://asc.fasb.org//1943274/2147479557/942-235-S99-1
| Name: |
us-gaap_Revenues |
| Namespace Prefix: |
us-gaap_ |
| Data Type: |
xbrli:monetaryItemType |
| Balance Type: |
credit |
| Period Type: |
duration |
|
| X |
- Details
| Name: |
us-gaap_BusinessAcquisitionAxis=MAMA_ChefInspirationalFoodsIncMember |
| Namespace Prefix: |
|
| Data Type: |
na |
| Balance Type: |
|
| Period Type: |
|
|
| X |
- Details
| Name: |
srt_StatementGeographicalAxis=MAMA_FarmingdalMember |
| Namespace Prefix: |
|
| Data Type: |
na |
| Balance Type: |
|
| Period Type: |
|
|
| X |
- Details
| Name: |
us-gaap_LeaseContractualTermAxis=MAMA_DecemberThirtyOneTwoThousandTwentySixMember |
| Namespace Prefix: |
|
| Data Type: |
na |
| Balance Type: |
|
| Period Type: |
|
|
| X |
- Details
| Name: |
us-gaap_LeaseContractualTermAxis=MAMA_EndOfInitialLeaseTermMember |
| Namespace Prefix: |
|
| Data Type: |
na |
| Balance Type: |
|
| Period Type: |
|
|
| X |
- Details
| Name: |
dei_LegalEntityAxis=MAMA_ChefInspirationalFoodsIncMember |
| Namespace Prefix: |
|
| Data Type: |
na |
| Balance Type: |
|
| Period Type: |
|
|
| X |
- Details
| Name: |
us-gaap_DebtInstrumentAxis=MAMA_PromissoryNoteMember |
| Namespace Prefix: |
|
| Data Type: |
na |
| Balance Type: |
|
| Period Type: |
|
|
| X |
- Details
| Name: |
us-gaap_AwardTypeAxis=MAMA_FirstAnniversaryMember |
| Namespace Prefix: |
|
| Data Type: |
na |
| Balance Type: |
|
| Period Type: |
|
|
v3.23.2
Loan and Security Agreements (Details Narrative) - M and T Bank [Member] - USD ($)
|
|
|
3 Months Ended |
6 Months Ended |
|
Jul. 18, 2023 |
Dec. 29, 2021 |
Jul. 31, 2023 |
Jul. 31, 2022 |
Jul. 31, 2023 |
Jul. 31, 2022 |
Jan. 31, 2023 |
| Line of credit borrowing capacity |
|
|
$ 5,500,000
|
|
$ 5,500,000
|
|
|
| Line of credit expiration date |
Oct. 31, 2025
|
|
|
|
|
|
|
| Line of credit facility interest rate description |
|
|
|
|
Advances under
the line of credit are limited to eighty percent (80%) of eligible accounts receivable (which is subject to an agreed limitation and
is further subject to certain asset concentration provisions) and fifty percent (50%) of eligible inventory (which is subject to an agreed
dollar limitation). All advances under the line of credit are due upon maturity
|
|
|
| Line of credit |
|
|
500,000
|
|
$ 500,000
|
|
$ 890,000
|
| Line of credit, interest incurred |
|
|
26,244
|
$ 32,943
|
$ 46,776
|
$ 49,053
|
|
| Multiple Disbursement Term Loan [Member] |
|
|
|
|
|
|
|
| Debt instrument description |
|
(i) greater than 2.25, 4.12 percentage point(s) above the Variable Loan Rate (as defined in the agreement); (ii)
greater than 1.50 but less than or equal to 2.25, 3.62 percentage points above Variable Loan Rate; or (iii) less than or equal to 1.50,
3.12 percentage points above applicable Variable Loan Rate. In all events set forth at subsections (i) through (iii) in the preceding
sentence, if SOFR shall at any time be less than 0.25%, one-day SOFR shall be deemed to be 0.00% and the foregoing margins shall be applied
to the Variable Loan Rates
|
|
|
the Senior Funded Debt/EBITDA
ratio is: (i) greater than 2.25, 3.87 percentage point(s) above one-day (i.e., overnight) SOFR (as defined); (ii) greater than 1.50 but
less than or equal to 2.25, 3.37 percentage points above one-day SOFR; or (iii) 1.50 or less, 2.87 percentage points above one-day SOFR.
In all events set forth at subsections (i) through (iii) in the preceding sentence, if SOFR shall at any time be less than 0.25%, one-day
SOFR shall be deemed to be 0.25% and the foregoing margins shall be applied to the SOFR Index Floor
|
|
|
| Line of credit, interest incurred |
|
|
117,606
|
$ 73,484
|
$ 237,315
|
$ 148,606
|
|
| Debt face amount |
|
$ 7,500,000
|
5,431,042
|
|
5,431,042
|
|
6,206,905
|
| Debt instrument payment terms |
|
60
|
|
|
|
|
|
| Debt maturity date |
|
Jan. 17, 2027
|
|
|
|
|
|
| Debt instrument unamortized discount |
|
|
$ 49,022
|
|
$ 49,022
|
|
$ 60,082
|
| X |
- DefinitionIdentification of the lender and information about a contractual promise to repay a short-term or long-term obligation, which includes borrowings under lines of credit, notes payable, commercial paper, bonds payable, debentures, and other contractual obligations for payment. This may include rationale for entering into the arrangement, significant terms of the arrangement, which may include amount, repayment terms, priority, collateral required, debt covenants, borrowing capacity, call features, participation rights, conversion provisions, sinking-fund requirements, voting rights, basis for conversion if convertible and remarketing provisions. The description may be provided for individual debt instruments, rational groupings of debt instruments, or by debt in total. Reference 1: http://fasb.org/us-gaap/role/ref/legacyRef
-Name Accounting Standards Codification
-Section S99
-Paragraph 1
-Subparagraph (SX 210.5-02(22))
-SubTopic 10
-Topic 210
-Publisher FASB
-URI https://asc.fasb.org//1943274/2147480566/210-10-S99-1
Reference 2: http://fasb.org/us-gaap/role/ref/legacyRef
-Topic 210
-SubTopic 10
-Name Accounting Standards Codification
-Section S99
-Paragraph 1
-Subparagraph (SX 210.5-02(19))
-Publisher FASB
-URI https://asc.fasb.org//1943274/2147480566/210-10-S99-1
Reference 3: http://fasb.org/us-gaap/role/ref/legacyRef
-Topic 942
-SubTopic 210
-Name Accounting Standards Codification
-Section S99
-Paragraph 1
-Subparagraph (SX 210.9-03(13))
-Publisher FASB
-URI https://asc.fasb.org//1943274/2147479853/942-210-S99-1
Reference 4: http://fasb.org/us-gaap/role/ref/legacyRef
-Topic 942
-SubTopic 210
-Name Accounting Standards Codification
-Section S99
-Paragraph 1
-Subparagraph (SX 210.9-03(16))
-Publisher FASB
-URI https://asc.fasb.org//1943274/2147479853/942-210-S99-1
Reference 5: http://fasb.org/us-gaap/role/ref/legacyRef
-Name Accounting Standards Codification
-Topic 505
-SubTopic 10
-Section 50
-Paragraph 3
-Publisher FASB
-URI https://asc.fasb.org//1943274/2147481112/505-10-50-3
Reference 6: http://fasb.org/us-gaap/role/ref/legacyRef
-Name Accounting Standards Codification
-Topic 942
-SubTopic 470
-Section 50
-Paragraph 3
-Subparagraph (a)
-Publisher FASB
-URI https://asc.fasb.org//1943274/2147480848/942-470-50-3
| Name: |
us-gaap_DebtInstrumentDescription |
| Namespace Prefix: |
us-gaap_ |
| Data Type: |
xbrli:stringItemType |
| Balance Type: |
na |
| Period Type: |
duration |
|
| X |
- DefinitionFace (par) amount of debt instrument at time of issuance. Reference 1: http://www.xbrl.org/2003/role/disclosureRef
-Topic 835
-SubTopic 30
-Name Accounting Standards Codification
-Section 50
-Paragraph 1
-Publisher FASB
-URI https://asc.fasb.org//1943274/2147482900/835-30-50-1
Reference 2: http://www.xbrl.org/2003/role/disclosureRef
-Topic 470
-SubTopic 20
-Name Accounting Standards Codification
-Section 50
-Paragraph 1B
-Subparagraph (a)
-Publisher FASB
-URI https://asc.fasb.org//1943274/2147481139/470-20-50-1B
Reference 3: http://www.xbrl.org/2003/role/exampleRef
-Topic 470
-SubTopic 20
-Name Accounting Standards Codification
-Section 55
-Paragraph 69B
-Publisher FASB
-URI https://asc.fasb.org//1943274/2147481568/470-20-55-69B
Reference 4: http://www.xbrl.org/2003/role/exampleRef
-Topic 470
-SubTopic 20
-Name Accounting Standards Codification
-Section 55
-Paragraph 69C
-Publisher FASB
-URI https://asc.fasb.org//1943274/2147481568/470-20-55-69C
Reference 5: http://fasb.org/us-gaap/role/ref/legacyRef
-Name Accounting Standards Codification
-Topic 835
-SubTopic 30
-Section 45
-Paragraph 2
-Publisher FASB
-URI https://asc.fasb.org//1943274/2147482925/835-30-45-2
Reference 6: http://fasb.org/us-gaap/role/ref/legacyRef
-Name Accounting Standards Codification
-Topic 835
-SubTopic 30
-Section 55
-Paragraph 8
-Publisher FASB
-URI https://asc.fasb.org//1943274/2147482949/835-30-55-8
| Name: |
us-gaap_DebtInstrumentFaceAmount |
| Namespace Prefix: |
us-gaap_ |
| Data Type: |
xbrli:monetaryItemType |
| Balance Type: |
credit |
| Period Type: |
instant |
|
| X |
- DefinitionDate when the debt instrument is scheduled to be fully repaid, in YYYY-MM-DD format. Reference 1: http://www.xbrl.org/2003/role/exampleRef
-Topic 470
-SubTopic 20
-Name Accounting Standards Codification
-Section 50
-Paragraph 1B
-Subparagraph (d)
-Publisher FASB
-URI https://asc.fasb.org//1943274/2147481139/470-20-50-1B
Reference 2: http://www.xbrl.org/2009/role/commonPracticeRef
-Topic 820
-SubTopic 10
-Name Accounting Standards Codification
-Section 50
-Paragraph 2
-Subparagraph (bbb)(2)
-Publisher FASB
-URI https://asc.fasb.org//1943274/2147482106/820-10-50-2
Reference 3: http://www.xbrl.org/2003/role/disclosureRef
-Name Accounting Standards Codification
-Section S99
-Paragraph 1
-Subparagraph (SX 210.5-02.22(a)(2))
-SubTopic 10
-Topic 210
-Publisher FASB
-URI https://asc.fasb.org//1943274/2147480566/210-10-S99-1
| Name: |
us-gaap_DebtInstrumentMaturityDate |
| Namespace Prefix: |
us-gaap_ |
| Data Type: |
xbrli:dateItemType |
| Balance Type: |
na |
| Period Type: |
duration |
|
| X |
- DefinitionDescription of the payment terms of the debt instrument (for example, whether periodic payments include principal and frequency of payments) and discussion about any contingencies associated with the payment. Reference 1: http://fasb.org/us-gaap/role/ref/legacyRef
-Name Accounting Standards Codification
-Topic 942
-SubTopic 470
-Section 50
-Paragraph 3
-Subparagraph (c)
-Publisher FASB
-URI https://asc.fasb.org//1943274/2147480848/942-470-50-3
Reference 2: http://fasb.org/us-gaap/role/ref/legacyRef
-Name Accounting Standards Codification
-Topic 210
-SubTopic 10
-Section S99
-Paragraph 1
-Subparagraph (SX 210.5-02.22(a)(3))
-Publisher FASB
-URI https://asc.fasb.org//1943274/2147480566/210-10-S99-1
| Name: |
us-gaap_DebtInstrumentPaymentTerms |
| Namespace Prefix: |
us-gaap_ |
| Data Type: |
xbrli:stringItemType |
| Balance Type: |
na |
| Period Type: |
duration |
|
| X |
- DefinitionAmount, after accumulated amortization, of debt discount. Reference 1: http://fasb.org/us-gaap/role/ref/legacyRef
-Name Accounting Standards Codification
-Topic 835
-SubTopic 30
-Section 45
-Paragraph 1A
-Publisher FASB
-URI https://asc.fasb.org//1943274/2147482925/835-30-45-1A
Reference 2: http://fasb.org/us-gaap/role/ref/legacyRef
-Name Accounting Standards Codification
-Topic 835
-SubTopic 30
-Section 55
-Paragraph 8
-Publisher FASB
-URI https://asc.fasb.org//1943274/2147482949/835-30-55-8
Reference 3: http://www.xbrl.org/2009/role/commonPracticeRef
-Topic 470
-SubTopic 20
-Name Accounting Standards Codification
-Section 50
-Paragraph 1D
-Subparagraph (a)
-Publisher FASB
-URI https://asc.fasb.org//1943274/2147481139/470-20-50-1D
| Name: |
us-gaap_DebtInstrumentUnamortizedDiscount |
| Namespace Prefix: |
us-gaap_ |
| Data Type: |
xbrli:monetaryItemType |
| Balance Type: |
debit |
| Period Type: |
instant |
|
| X |
- DefinitionAmount of the cost of borrowed funds accounted for as interest expense for debt. Reference 1: http://www.xbrl.org/2003/role/exampleRef
-Topic 470
-SubTopic 20
-Name Accounting Standards Codification
-Section 55
-Paragraph 69E
-Publisher FASB
-URI https://asc.fasb.org//1943274/2147481568/470-20-55-69E
Reference 2: http://www.xbrl.org/2003/role/exampleRef
-Topic 470
-SubTopic 20
-Name Accounting Standards Codification
-Section 55
-Paragraph 69F
-Publisher FASB
-URI https://asc.fasb.org//1943274/2147481568/470-20-55-69F
Reference 3: http://www.xbrl.org/2003/role/disclosureRef
-Topic 470
-SubTopic 20
-Name Accounting Standards Codification
-Section 50
-Paragraph 1F
-Subparagraph (b)
-Publisher FASB
-URI https://asc.fasb.org//1943274/2147481139/470-20-50-1F
Reference 4: http://fasb.org/us-gaap/role/ref/legacyRef
-Topic 220
-SubTopic 10
-Name Accounting Standards Codification
-Section S99
-Paragraph 2
-Subparagraph (SX 210.5-03.8)
-Publisher FASB
-URI https://asc.fasb.org//1943274/2147483621/220-10-S99-2
Reference 5: http://www.xbrl.org/2003/role/disclosureRef
-Topic 470
-SubTopic 20
-Name Accounting Standards Codification
-Section 50
-Paragraph 6
-Subparagraph (b)
-Publisher FASB
-URI https://asc.fasb.org//1943274/2147481139/470-20-50-6
| Name: |
us-gaap_InterestExpenseDebt |
| Namespace Prefix: |
us-gaap_ |
| Data Type: |
xbrli:monetaryItemType |
| Balance Type: |
debit |
| Period Type: |
duration |
|
| X |
- DefinitionThe carrying value as of the balance sheet date of the current and noncurrent portions of long-term obligations drawn from a line of credit, which is a bank's commitment to make loans up to a specific amount. Examples of items that might be included in the application of this element may consist of letters of credit, standby letters of credit, and revolving credit arrangements, under which borrowings can be made up to a maximum amount as of any point in time conditional on satisfaction of specified terms before, as of and after the date of drawdowns on the line. Includes short-term obligations that would normally be classified as current liabilities but for which (a) postbalance sheet date issuance of a long term obligation to refinance the short term obligation on a long term basis, or (b) the enterprise has entered into a financing agreement that clearly permits the enterprise to refinance the short-term obligation on a long term basis and the following conditions are met (1) the agreement does not expire within 1 year and is not cancelable by the lender except for violation of an objectively determinable provision, (2) no violation exists at the BS date, and (3) the lender has entered into the financing agreement is expected to be financially capable of honoring the agreement. Reference 1: http://fasb.org/us-gaap/role/ref/legacyRef
-Name Accounting Standards Codification
-Section S99
-Paragraph 1
-Subparagraph (SX 210.5-02(22))
-SubTopic 10
-Topic 210
-Publisher FASB
-URI https://asc.fasb.org//1943274/2147480566/210-10-S99-1
Reference 2: http://www.xbrl.org/2009/role/commonPracticeRef
-Topic 944
-SubTopic 210
-Name Accounting Standards Codification
-Section S99
-Paragraph 1
-Subparagraph (SX 210.7-03(a)(16)(a)(2))
-Publisher FASB
-URI https://asc.fasb.org//1943274/2147479440/944-210-S99-1
Reference 3: http://fasb.org/us-gaap/role/ref/legacyRef
-Topic 942
-SubTopic 210
-Name Accounting Standards Codification
-Section S99
-Paragraph 1
-Subparagraph (SX 210.9-03(16))
-Publisher FASB
-URI https://asc.fasb.org//1943274/2147479853/942-210-S99-1
| Name: |
us-gaap_LineOfCredit |
| Namespace Prefix: |
us-gaap_ |
| Data Type: |
xbrli:monetaryItemType |
| Balance Type: |
credit |
| Period Type: |
instant |
|
| X |
- DefinitionDate the credit facility terminates, in YYYY-MM-DD format. Reference 1: http://fasb.org/us-gaap/role/ref/legacyRef
-Name Accounting Standards Codification
-Topic 210
-SubTopic 10
-Section S99
-Paragraph 1
-Subparagraph (SX 210.5-02.19(b),22(b))
-Publisher FASB
-URI https://asc.fasb.org//1943274/2147480566/210-10-S99-1
| Name: |
us-gaap_LineOfCreditFacilityExpirationDate1 |
| Namespace Prefix: |
us-gaap_ |
| Data Type: |
xbrli:dateItemType |
| Balance Type: |
na |
| Period Type: |
duration |
|
| X |
- DefinitionDescription of interest rate for borrowing under credit facility. Includes, but is not limited to, terms and method for determining interest rate. Reference 1: http://fasb.org/us-gaap/role/ref/legacyRef
-Name Accounting Standards Codification
-Topic 210
-SubTopic 10
-Section S99
-Paragraph 1
-Subparagraph (SX 210.5-02.19(b),22(b))
-Publisher FASB
-URI https://asc.fasb.org//1943274/2147480566/210-10-S99-1
| Name: |
us-gaap_LineOfCreditFacilityInterestRateDescription |
| Namespace Prefix: |
us-gaap_ |
| Data Type: |
xbrli:stringItemType |
| Balance Type: |
na |
| Period Type: |
duration |
|
| X |
- DefinitionMaximum borrowing capacity under the credit facility without consideration of any current restrictions on the amount that could be borrowed or the amounts currently outstanding under the facility. Reference 1: http://fasb.org/us-gaap/role/ref/legacyRef
-Name Accounting Standards Codification
-Topic 210
-SubTopic 10
-Section S99
-Paragraph 1
-Subparagraph (SX 210.5-02.19(b),22(b))
-Publisher FASB
-URI https://asc.fasb.org//1943274/2147480566/210-10-S99-1
| Name: |
us-gaap_LineOfCreditFacilityMaximumBorrowingCapacity |
| Namespace Prefix: |
us-gaap_ |
| Data Type: |
xbrli:monetaryItemType |
| Balance Type: |
credit |
| Period Type: |
instant |
|
| X |
- Details
| Name: |
dei_LegalEntityAxis=MAMA_MAndTBankMember |
| Namespace Prefix: |
|
| Data Type: |
na |
| Balance Type: |
|
| Period Type: |
|
|
| X |
- Details
| Name: |
us-gaap_DebtInstrumentAxis=MAMA_MultipleDisbursementTermLoanMember |
| Namespace Prefix: |
|
| Data Type: |
na |
| Balance Type: |
|
| Period Type: |
|
|
v3.23.2
| X |
- DefinitionLine items represent financial concepts included in a table. These concepts are used to disclose reportable information associated with domain members defined in one or many axes to the table. Reference 1: http://www.xbrl.org/2003/role/disclosureRef
-Topic 954
-SubTopic 310
-Name Accounting Standards Codification
-Section 50
-Paragraph 2
-Publisher FASB
-URI https://asc.fasb.org//1943274/2147481027/954-310-50-2
| Name: |
us-gaap_ConcentrationRiskLineItems |
| Namespace Prefix: |
us-gaap_ |
| Data Type: |
xbrli:stringItemType |
| Balance Type: |
na |
| Period Type: |
duration |
|
| X |
- DefinitionFor an entity that discloses a concentration risk in relation to quantitative amount, which serves as the "benchmark" (or denominator) in the equation, this concept represents the concentration percentage derived from the division. Reference 1: http://www.xbrl.org/2003/role/disclosureRef
-Topic 280
-SubTopic 10
-Name Accounting Standards Codification
-Section 50
-Paragraph 42
-Publisher FASB
-URI https://asc.fasb.org//1943274/2147482810/280-10-50-42
Reference 2: http://fasb.org/us-gaap/role/ref/legacyRef
-Name Accounting Standards Codification
-Topic 825
-SubTopic 10
-Section 50
-Paragraph 21
-Subparagraph (a)
-Publisher FASB
-URI https://asc.fasb.org//1943274/2147482907/825-10-50-21
Reference 3: http://fasb.org/us-gaap/role/ref/legacyRef
-Name Accounting Standards Codification
-Topic 825
-SubTopic 10
-Section 50
-Paragraph 20
-Publisher FASB
-URI https://asc.fasb.org//1943274/2147482907/825-10-50-20
Reference 4: http://fasb.org/us-gaap/role/ref/legacyRef
-Name Accounting Standards Codification
-Topic 275
-SubTopic 10
-Section 50
-Paragraph 18
-Publisher FASB
-URI https://asc.fasb.org//1943274/2147482861/275-10-50-18
Reference 5: http://fasb.org/us-gaap/role/ref/legacyRef
-Name Accounting Standards Codification
-Topic 275
-SubTopic 10
-Section 50
-Paragraph 20
-Publisher FASB
-URI https://asc.fasb.org//1943274/2147482861/275-10-50-20
| Name: |
us-gaap_ConcentrationRiskPercentage1 |
| Namespace Prefix: |
us-gaap_ |
| Data Type: |
dtr-types:percentItemType |
| Balance Type: |
na |
| Period Type: |
duration |
|
| X |
- Details
| Name: |
srt_MajorCustomersAxis=MAMA_CustomerOneMember |
| Namespace Prefix: |
|
| Data Type: |
na |
| Balance Type: |
|
| Period Type: |
|
|
| X |
- Details
| Name: |
us-gaap_ConcentrationRiskByBenchmarkAxis=us-gaap_SalesRevenueNetMember |
| Namespace Prefix: |
|
| Data Type: |
na |
| Balance Type: |
|
| Period Type: |
|
|
| X |
- Details
| Name: |
us-gaap_ConcentrationRiskByTypeAxis=us-gaap_CustomerConcentrationRiskMember |
| Namespace Prefix: |
|
| Data Type: |
na |
| Balance Type: |
|
| Period Type: |
|
|
| X |
- Details
| Name: |
us-gaap_ConcentrationRiskByBenchmarkAxis=us-gaap_AccountsReceivableMember |
| Namespace Prefix: |
|
| Data Type: |
na |
| Balance Type: |
|
| Period Type: |
|
|
| X |
- Details
| Name: |
srt_MajorCustomersAxis=MAMA_CustomerTwoMember |
| Namespace Prefix: |
|
| Data Type: |
na |
| Balance Type: |
|
| Period Type: |
|
|
| X |
- Details
| Name: |
srt_MajorCustomersAxis=MAMA_CustomerThreeMember |
| Namespace Prefix: |
|
| Data Type: |
na |
| Balance Type: |
|
| Period Type: |
|
|
| X |
- Details
| Name: |
srt_MajorCustomersAxis=MAMA_OneCustomerMember |
| Namespace Prefix: |
|
| Data Type: |
na |
| Balance Type: |
|
| Period Type: |
|
|
| X |
- Details
| Name: |
srt_MajorCustomersAxis=MAMA_ThreeCustomersMember |
| Namespace Prefix: |
|
| Data Type: |
na |
| Balance Type: |
|
| Period Type: |
|
|
v3.23.2
Schedule of Restricted Stock Option Activity (Details)
|
6 Months Ended |
|
Jul. 31, 2023
$ / shares
shares
|
|---|
| Equity [Abstract] |
|
| Restricted Stock Units Unvested, Balance | shares |
367,647
|
| Weighted Average Exercise Price Unvested, Balance | $ / shares |
$ 1.36
|
| Restricted Stock Units, Granted | shares |
39,773
|
| Weighted Average Exercise Price, Granted | $ / shares |
$ 1.76
|
| Restricted Stock Units, Vested | shares |
|
| Weighted Average Exercise Price, Vested | $ / shares |
|
| Restricted Stock Units, Forfeited | shares |
|
| Weighted Average Exercise Price, Forfeited | $ / shares |
|
| Restricted Stock Units Outstanding, Balance | shares |
407,420
|
| Weighted Average Exercise Price Outstanding, Balance | $ / shares |
$ 1.40
|
| X |
- References
+ Details
| Name: |
us-gaap_EquityAbstract |
| Namespace Prefix: |
us-gaap_ |
| Data Type: |
xbrli:stringItemType |
| Balance Type: |
na |
| Period Type: |
duration |
|
| X |
- DefinitionGross number of share options (or share units) granted during the period. Reference 1: http://www.xbrl.org/2003/role/disclosureRef
-Topic 718
-SubTopic 10
-Name Accounting Standards Codification
-Section 50
-Paragraph 2
-Subparagraph (c)(1)(iv)(01)
-Publisher FASB
-URI https://asc.fasb.org//1943274/2147480429/718-10-50-2
| Name: |
us-gaap_ShareBasedCompensationArrangementByShareBasedPaymentAwardOptionsGrantsInPeriodGross |
| Namespace Prefix: |
us-gaap_ |
| Data Type: |
xbrli:sharesItemType |
| Balance Type: |
na |
| Period Type: |
duration |
|
| X |
- DefinitionThe weighted average grant-date fair value of options granted during the reporting period as calculated by applying the disclosed option pricing methodology. Reference 1: http://www.xbrl.org/2003/role/disclosureRef
-Topic 718
-SubTopic 10
-Name Accounting Standards Codification
-Section 50
-Paragraph 2
-Subparagraph (d)(1)
-Publisher FASB
-URI https://asc.fasb.org//1943274/2147480429/718-10-50-2
| Name: |
us-gaap_ShareBasedCompensationArrangementByShareBasedPaymentAwardOptionsGrantsInPeriodWeightedAverageGrantDateFairValue |
| Namespace Prefix: |
us-gaap_ |
| Data Type: |
dtr-types:perShareItemType |
| Balance Type: |
na |
| Period Type: |
duration |
|
| X |
- DefinitionNumber of non-vested options outstanding.
| Name: |
us-gaap_SharebasedCompensationArrangementBySharebasedPaymentAwardOptionsNonvestedNumberOfShares |
| Namespace Prefix: |
us-gaap_ |
| Data Type: |
xbrli:sharesItemType |
| Balance Type: |
na |
| Period Type: |
instant |
|
| X |
- DefinitionNumber of non-vested options forfeited.
| Name: |
us-gaap_SharebasedCompensationArrangementBySharebasedPaymentAwardOptionsNonvestedOptionsForfeitedNumberOfShares |
| Namespace Prefix: |
us-gaap_ |
| Data Type: |
xbrli:sharesItemType |
| Balance Type: |
na |
| Period Type: |
duration |
|
| X |
- DefinitionWeighted average grant-date fair value of non-vested options forfeited.
| Name: |
us-gaap_SharebasedCompensationArrangementBySharebasedPaymentAwardOptionsNonvestedOptionsForfeitedWeightedAverageGrantDateFairValue |
| Namespace Prefix: |
us-gaap_ |
| Data Type: |
dtr-types:perShareItemType |
| Balance Type: |
na |
| Period Type: |
duration |
|
| X |
- DefinitionWeighted average grant-date fair value of non-vested options outstanding.
| Name: |
us-gaap_SharebasedCompensationArrangementBySharebasedPaymentAwardOptionsNonvestedWeightedAverageGrantDateFairValue |
| Namespace Prefix: |
us-gaap_ |
| Data Type: |
dtr-types:perShareItemType |
| Balance Type: |
na |
| Period Type: |
instant |
|
| X |
- DefinitionNumber of options vested.
| Name: |
us-gaap_SharebasedCompensationArrangementBySharebasedPaymentAwardOptionsVestedNumberOfShares |
| Namespace Prefix: |
us-gaap_ |
| Data Type: |
xbrli:sharesItemType |
| Balance Type: |
na |
| Period Type: |
duration |
|
| X |
- DefinitionWeighted average grant-date fair value of options vested.
| Name: |
us-gaap_SharebasedCompensationArrangementBySharebasedPaymentAwardOptionsVestedWeightedAverageGrantDateFairValue |
| Namespace Prefix: |
us-gaap_ |
| Data Type: |
dtr-types:perShareItemType |
| Balance Type: |
na |
| Period Type: |
duration |
|
v3.23.2
Summary of Option Activity (Details) - USD ($)
|
3 Months Ended |
6 Months Ended |
12 Months Ended |
Jul. 31, 2023 |
Jul. 31, 2023 |
Jan. 31, 2023 |
| Equity [Abstract] |
|
|
|
| Options Outstanding, Balance |
|
689,000
|
|
| Weighted average exercise price, Beginning balance |
|
$ 0.77
|
|
| Weighted Average Remaining Contractual Life (in years) |
|
2 years 8 months 4 days
|
2 years 11 months 12 days
|
| Share-Based Compensation Arrangement by Share-Based Payment Award, Options, Outstanding, Intrinsic Value |
|
$ 544,760
|
|
| Options, Granted |
|
|
|
| Weighted average exercise price, Granted |
|
|
|
| Options, Exercised |
6,000
|
206,000
|
|
| Weighted average exercise price, Exercised |
$ 1.38
|
$ 0.40
|
|
| Expired |
|
|
|
| Expired |
|
|
|
| Options Outstanding, Balance |
483,000
|
483,000
|
689,000
|
| Weighted average exercise price, Ending balance |
$ 0.92
|
$ 0.92
|
$ 0.77
|
| Share-Based Compensation Arrangement by Share-Based Payment Award, Options, Outstanding, Intrinsic Value |
$ 1,347,410
|
$ 1,347,410
|
$ 544,760
|
| Options, exercisable, Ending balance |
370,500
|
370,500
|
|
| Weighted average exercise price, Ending balance |
$ 0.75
|
$ 0.75
|
|
| Weighted Average Remaining Contractual Life (in years) |
|
1 year 6 months 18 days
|
|
| Share-Based Compensation Arrangement by Share-Based Payment Award, Options, Exercisable, Intrinsic Value |
$ 1,096,535
|
$ 1,096,535
|
|
| X |
- References
+ Details
| Name: |
us-gaap_EquityAbstract |
| Namespace Prefix: |
us-gaap_ |
| Data Type: |
xbrli:stringItemType |
| Balance Type: |
na |
| Period Type: |
duration |
|
| X |
- DefinitionThe number of shares into which fully or partially vested stock options outstanding as of the balance sheet date can be currently converted under the option plan. Reference 1: http://www.xbrl.org/2003/role/disclosureRef
-Topic 718
-SubTopic 10
-Name Accounting Standards Codification
-Section 50
-Paragraph 2
-Subparagraph (c)(1)(iii)
-Publisher FASB
-URI https://asc.fasb.org//1943274/2147480429/718-10-50-2
| Name: |
us-gaap_ShareBasedCompensationArrangementByShareBasedPaymentAwardOptionsExercisableNumber |
| Namespace Prefix: |
us-gaap_ |
| Data Type: |
xbrli:sharesItemType |
| Balance Type: |
na |
| Period Type: |
instant |
|
| X |
- DefinitionThe weighted-average price as of the balance sheet date at which grantees can acquire the shares reserved for issuance on vested portions of options outstanding and currently exercisable under the stock option plan. Reference 1: http://www.xbrl.org/2003/role/disclosureRef
-Topic 718
-SubTopic 10
-Name Accounting Standards Codification
-Section 50
-Paragraph 2
-Subparagraph (c)(1)(iii)
-Publisher FASB
-URI https://asc.fasb.org//1943274/2147480429/718-10-50-2
| Name: |
us-gaap_ShareBasedCompensationArrangementByShareBasedPaymentAwardOptionsExercisableWeightedAverageExercisePrice |
| Namespace Prefix: |
us-gaap_ |
| Data Type: |
dtr-types:perShareItemType |
| Balance Type: |
na |
| Period Type: |
instant |
|
| X |
- DefinitionWeighted average price of options that were either forfeited or expired. Reference 1: http://www.xbrl.org/2009/role/commonPracticeRef
-Topic 718
-SubTopic 10
-Name Accounting Standards Codification
-Section 50
-Paragraph 2
-Subparagraph (c)(1)(iv)
-Publisher FASB
-URI https://asc.fasb.org//1943274/2147480429/718-10-50-2
| Name: |
us-gaap_ShareBasedCompensationArrangementByShareBasedPaymentAwardOptionsForfeituresAndExpirationsInPeriodWeightedAverageExercisePrice |
| Namespace Prefix: |
us-gaap_ |
| Data Type: |
dtr-types:perShareItemType |
| Balance Type: |
na |
| Period Type: |
duration |
|
| X |
- DefinitionNet number of share options (or share units) granted during the period. Reference 1: http://www.xbrl.org/2009/role/commonPracticeRef
-Topic 718
-SubTopic 10
-Name Accounting Standards Codification
-Section 50
-Paragraph 2
-Subparagraph (c)(1)(iv)(01)
-Publisher FASB
-URI https://asc.fasb.org//1943274/2147480429/718-10-50-2
| Name: |
us-gaap_ShareBasedCompensationArrangementByShareBasedPaymentAwardOptionsGrantsInPeriod |
| Namespace Prefix: |
us-gaap_ |
| Data Type: |
xbrli:sharesItemType |
| Balance Type: |
na |
| Period Type: |
duration |
|
| X |
- DefinitionAmount by which the current fair value of the underlying stock exceeds the exercise price of options outstanding. Reference 1: http://fasb.org/us-gaap/role/ref/legacyRef
-Name Accounting Standards Codification
-Topic 718
-SubTopic 10
-Section 50
-Paragraph 2
-Publisher FASB
-URI https://asc.fasb.org//1943274/2147480429/718-10-50-2
| Name: |
us-gaap_ShareBasedCompensationArrangementByShareBasedPaymentAwardOptionsOutstandingIntrinsicValue |
| Namespace Prefix: |
us-gaap_ |
| Data Type: |
xbrli:monetaryItemType |
| Balance Type: |
debit |
| Period Type: |
instant |
|
| X |
- DefinitionNumber of options outstanding, including both vested and non-vested options. Reference 1: http://www.xbrl.org/2003/role/disclosureRef
-Topic 718
-SubTopic 10
-Name Accounting Standards Codification
-Section 50
-Paragraph 2
-Subparagraph (c)(1)(i)
-Publisher FASB
-URI https://asc.fasb.org//1943274/2147480429/718-10-50-2
Reference 2: http://www.xbrl.org/2003/role/disclosureRef
-Topic 718
-SubTopic 10
-Name Accounting Standards Codification
-Section 50
-Paragraph 2
-Subparagraph (c)(1)(ii)
-Publisher FASB
-URI https://asc.fasb.org//1943274/2147480429/718-10-50-2
| Name: |
us-gaap_ShareBasedCompensationArrangementByShareBasedPaymentAwardOptionsOutstandingNumber |
| Namespace Prefix: |
us-gaap_ |
| Data Type: |
xbrli:sharesItemType |
| Balance Type: |
na |
| Period Type: |
instant |
|
| X |
- DefinitionWeighted average price at which grantees can acquire the shares reserved for issuance under the stock option plan. Reference 1: http://www.xbrl.org/2003/role/disclosureRef
-Topic 718
-SubTopic 10
-Name Accounting Standards Codification
-Section 50
-Paragraph 2
-Subparagraph (c)(1)(i)
-Publisher FASB
-URI https://asc.fasb.org//1943274/2147480429/718-10-50-2
Reference 2: http://www.xbrl.org/2003/role/disclosureRef
-Topic 718
-SubTopic 10
-Name Accounting Standards Codification
-Section 50
-Paragraph 2
-Subparagraph (c)(1)(ii)
-Publisher FASB
-URI https://asc.fasb.org//1943274/2147480429/718-10-50-2
| Name: |
us-gaap_ShareBasedCompensationArrangementByShareBasedPaymentAwardOptionsOutstandingWeightedAverageExercisePrice |
| Namespace Prefix: |
us-gaap_ |
| Data Type: |
dtr-types:perShareItemType |
| Balance Type: |
na |
| Period Type: |
instant |
|
| X |
- DefinitionWeighted average price at which option holders acquired shares when converting their stock options into shares. Reference 1: http://www.xbrl.org/2003/role/disclosureRef
-Topic 718
-SubTopic 10
-Name Accounting Standards Codification
-Section 50
-Paragraph 2
-Subparagraph (c)(1)(iv)(02)
-Publisher FASB
-URI https://asc.fasb.org//1943274/2147480429/718-10-50-2
| Name: |
us-gaap_ShareBasedCompensationArrangementsByShareBasedPaymentAwardOptionsExercisesInPeriodWeightedAverageExercisePrice |
| Namespace Prefix: |
us-gaap_ |
| Data Type: |
dtr-types:perShareItemType |
| Balance Type: |
na |
| Period Type: |
duration |
|
| X |
- DefinitionWeighted average price at which grantees could have acquired the underlying shares with respect to stock options that were terminated. Reference 1: http://www.xbrl.org/2003/role/disclosureRef
-Topic 718
-SubTopic 10
-Name Accounting Standards Codification
-Section 50
-Paragraph 2
-Subparagraph (c)(1)(iv)(03)
-Publisher FASB
-URI https://asc.fasb.org//1943274/2147480429/718-10-50-2
| Name: |
us-gaap_ShareBasedCompensationArrangementsByShareBasedPaymentAwardOptionsForfeituresInPeriodWeightedAverageExercisePrice |
| Namespace Prefix: |
us-gaap_ |
| Data Type: |
dtr-types:perShareItemType |
| Balance Type: |
na |
| Period Type: |
duration |
|
| X |
- DefinitionWeighted average per share amount at which grantees can acquire shares of common stock by exercise of options. Reference 1: http://www.xbrl.org/2003/role/disclosureRef
-Topic 718
-SubTopic 10
-Name Accounting Standards Codification
-Section 50
-Paragraph 2
-Subparagraph (c)(1)(iv)(01)
-Publisher FASB
-URI https://asc.fasb.org//1943274/2147480429/718-10-50-2
| Name: |
us-gaap_ShareBasedCompensationArrangementsByShareBasedPaymentAwardOptionsGrantsInPeriodWeightedAverageExercisePrice |
| Namespace Prefix: |
us-gaap_ |
| Data Type: |
dtr-types:perShareItemType |
| Balance Type: |
na |
| Period Type: |
duration |
|
| X |
- DefinitionAmount of difference between fair value of the underlying shares reserved for issuance and exercise price of vested portions of options outstanding and currently exercisable. Reference 1: http://fasb.org/us-gaap/role/ref/legacyRef
-Name Accounting Standards Codification
-Topic 718
-SubTopic 10
-Section 50
-Paragraph 2
-Publisher FASB
-URI https://asc.fasb.org//1943274/2147480429/718-10-50-2
| Name: |
us-gaap_SharebasedCompensationArrangementBySharebasedPaymentAwardOptionsExercisableIntrinsicValue1 |
| Namespace Prefix: |
us-gaap_ |
| Data Type: |
xbrli:monetaryItemType |
| Balance Type: |
debit |
| Period Type: |
instant |
|
| X |
- DefinitionWeighted average remaining contractual term for vested portions of options outstanding and currently exercisable or convertible, in 'PnYnMnDTnHnMnS' format, for example, 'P1Y5M13D' represents the reported fact of one year, five months, and thirteen days. Reference 1: http://fasb.org/us-gaap/role/ref/legacyRef
-Name Accounting Standards Codification
-Topic 718
-SubTopic 10
-Section 50
-Paragraph 2
-Publisher FASB
-URI https://asc.fasb.org//1943274/2147480429/718-10-50-2
| Name: |
us-gaap_SharebasedCompensationArrangementBySharebasedPaymentAwardOptionsExercisableWeightedAverageRemainingContractualTerm1 |
| Namespace Prefix: |
us-gaap_ |
| Data Type: |
xbrli:durationItemType |
| Balance Type: |
na |
| Period Type: |
duration |
|
| X |
- DefinitionWeighted average remaining contractual term for option awards outstanding, in 'PnYnMnDTnHnMnS' format, for example, 'P1Y5M13D' represents the reported fact of one year, five months, and thirteen days. Reference 1: http://fasb.org/us-gaap/role/ref/legacyRef
-Topic 718
-SubTopic 10
-Subparagraph (e)(1)
-Name Accounting Standards Codification
-Paragraph 2
-Section 50
-Publisher FASB
-URI https://asc.fasb.org//1943274/2147480429/718-10-50-2
| Name: |
us-gaap_SharebasedCompensationArrangementBySharebasedPaymentAwardOptionsOutstandingWeightedAverageRemainingContractualTerm2 |
| Namespace Prefix: |
us-gaap_ |
| Data Type: |
xbrli:durationItemType |
| Balance Type: |
na |
| Period Type: |
duration |
|
| X |
- DefinitionNumber of share options (or share units) exercised during the current period. Reference 1: http://fasb.org/us-gaap/role/ref/legacyRef
-Name Accounting Standards Codification
-Section 50
-Paragraph 2
-SubTopic 10
-Topic 505
-Publisher FASB
-URI https://asc.fasb.org//1943274/2147481112/505-10-50-2
Reference 2: http://www.xbrl.org/2003/role/disclosureRef
-Topic 718
-SubTopic 10
-Name Accounting Standards Codification
-Section 50
-Paragraph 2
-Subparagraph (c)(1)(iv)(02)
-Publisher FASB
-URI https://asc.fasb.org//1943274/2147480429/718-10-50-2
Reference 3: http://fasb.org/us-gaap/role/ref/legacyRef
-Topic 210
-SubTopic 10
-Name Accounting Standards Codification
-Section S99
-Paragraph 1
-Subparagraph (SX 210.5-02(28))
-Publisher FASB
-URI https://asc.fasb.org//1943274/2147480566/210-10-S99-1
Reference 4: http://fasb.org/us-gaap/role/ref/legacyRef
-Topic 505
-SubTopic 10
-Name Accounting Standards Codification
-Section S99
-Paragraph 1
-Subparagraph (SX 210.3-04)
-Publisher FASB
-URI https://asc.fasb.org//1943274/2147480008/505-10-S99-1
Reference 5: http://fasb.org/us-gaap/role/ref/legacyRef
-Topic 210
-SubTopic 10
-Name Accounting Standards Codification
-Section S99
-Paragraph 1
-Subparagraph (SX 210.5-02(29))
-Publisher FASB
-URI https://asc.fasb.org//1943274/2147480566/210-10-S99-1
| Name: |
us-gaap_StockIssuedDuringPeriodSharesStockOptionsExercised |
| Namespace Prefix: |
us-gaap_ |
| Data Type: |
xbrli:sharesItemType |
| Balance Type: |
na |
| Period Type: |
duration |
|
v3.23.2
Schedule of Warrants Activity (Details) - Warrant [Member] - $ / shares
|
3 Months Ended |
6 Months Ended |
Jul. 31, 2023 |
Jul. 31, 2023 |
| Accumulated Other Comprehensive Income (Loss) [Line Items] |
|
|
| Warrants Outstanding, Balance |
|
13,650
|
| Weighted Average Exercise price, Outstanding Balance |
|
$ 2.25
|
| Warrants Exercisable, Balance |
|
13,650
|
| Weighted Average Exercise price, Exercisable Balance |
|
$ 2.25
|
| Warrants, Granted |
|
|
| Warrants, Exercised |
(13,650)
|
13,650
|
| Weighted Average Exercise Price, Exercised |
|
|
| Warrants Outstanding, Balance |
|
|
| Weighted Average Exercise price, Outstanding Balance |
|
|
| Warrants Exercisable, Balance |
|
|
| Weighted Average Exercise price, Exercisable Balance |
|
|
| X |
- DefinitionNon option equity instruments exercisable number.
| Name: |
MAMA_ShareBasedCompensationArrangementByShareBasedPaymentAwardNonOptionEquityInstrumentsExercisableNumber |
| Namespace Prefix: |
MAMA_ |
| Data Type: |
xbrli:sharesItemType |
| Balance Type: |
na |
| Period Type: |
instant |
|
| X |
- DefinitionLine items represent financial concepts included in a table. These concepts are used to disclose reportable information associated with domain members defined in one or many axes to the table. Reference 1: http://www.xbrl.org/2003/role/disclosureRef
-Topic 220
-SubTopic 10
-Name Accounting Standards Codification
-Section 50
-Paragraph 4
-Publisher FASB
-URI https://asc.fasb.org//1943274/2147482765/220-10-50-4
Reference 2: http://www.xbrl.org/2003/role/disclosureRef
-Topic 220
-SubTopic 10
-Name Accounting Standards Codification
-Section 50
-Paragraph 5
-Publisher FASB
-URI https://asc.fasb.org//1943274/2147482765/220-10-50-5
Reference 3: http://www.xbrl.org/2003/role/disclosureRef
-Topic 830
-SubTopic 30
-Name Accounting Standards Codification
-Section 50
-Paragraph 1
-Publisher FASB
-URI https://asc.fasb.org//1943274/2147481674/830-30-50-1
Reference 4: http://www.xbrl.org/2003/role/disclosureRef
-Topic 830
-SubTopic 30
-Name Accounting Standards Codification
-Section 45
-Paragraph 17
-Publisher FASB
-URI https://asc.fasb.org//1943274/2147481694/830-30-45-17
Reference 5: http://www.xbrl.org/2003/role/disclosureRef
-Topic 830
-SubTopic 30
-Name Accounting Standards Codification
-Section 45
-Paragraph 20
-Subparagraph (a)
-Publisher FASB
-URI https://asc.fasb.org//1943274/2147481694/830-30-45-20
Reference 6: http://www.xbrl.org/2003/role/disclosureRef
-Topic 830
-SubTopic 30
-Name Accounting Standards Codification
-Section 45
-Paragraph 20
-Subparagraph (b)
-Publisher FASB
-URI https://asc.fasb.org//1943274/2147481694/830-30-45-20
Reference 7: http://www.xbrl.org/2003/role/disclosureRef
-Topic 830
-SubTopic 30
-Name Accounting Standards Codification
-Section 45
-Paragraph 20
-Subparagraph (c)
-Publisher FASB
-URI https://asc.fasb.org//1943274/2147481694/830-30-45-20
Reference 8: http://www.xbrl.org/2003/role/disclosureRef
-Topic 830
-SubTopic 30
-Name Accounting Standards Codification
-Section 45
-Paragraph 20
-Subparagraph (d)
-Publisher FASB
-URI https://asc.fasb.org//1943274/2147481694/830-30-45-20
| Name: |
us-gaap_AccumulatedOtherComprehensiveIncomeLossLineItems |
| Namespace Prefix: |
us-gaap_ |
| Data Type: |
xbrli:stringItemType |
| Balance Type: |
na |
| Period Type: |
duration |
|
| X |
- DefinitionNumber of non-option equity instruments exercised by participants. Reference 1: http://fasb.org/us-gaap/role/ref/legacyRef
-Name Accounting Standards Codification
-Section 50
-Paragraph 2
-Subparagraph (c)(1)(iv)(2)
-SubTopic 10
-Topic 718
-Publisher FASB
-URI https://asc.fasb.org//1943274/2147480429/718-10-50-2
| Name: |
us-gaap_ShareBasedCompensationArrangementByShareBasedPaymentAwardNonOptionEquityInstrumentsExercised |
| Namespace Prefix: |
us-gaap_ |
| Data Type: |
xbrli:sharesItemType |
| Balance Type: |
na |
| Period Type: |
duration |
|
| X |
- DefinitionNet number of non-option equity instruments granted to participants. Reference 1: http://fasb.org/us-gaap/role/ref/legacyRef
-Name Accounting Standards Codification
-Section 50
-Paragraph 2
-Subparagraph (c)(1)(iv)(1)
-SubTopic 10
-Topic 718
-Publisher FASB
-URI https://asc.fasb.org//1943274/2147480429/718-10-50-2
| Name: |
us-gaap_ShareBasedCompensationArrangementByShareBasedPaymentAwardNonOptionEquityInstrumentsGranted |
| Namespace Prefix: |
us-gaap_ |
| Data Type: |
xbrli:sharesItemType |
| Balance Type: |
na |
| Period Type: |
duration |
|
| X |
- DefinitionNumber of equity instruments other than options outstanding, including both vested and non-vested instruments. Reference 1: http://fasb.org/us-gaap/role/ref/legacyRef
-Name Accounting Standards Codification
-Section 50
-Paragraph 2
-Subparagraph (c)(1)(i)
-SubTopic 10
-Topic 718
-Publisher FASB
-URI https://asc.fasb.org//1943274/2147480429/718-10-50-2
Reference 2: http://fasb.org/us-gaap/role/ref/legacyRef
-Name Accounting Standards Codification
-Section 50
-Paragraph 2
-Subparagraph (c)(1)(ii)
-SubTopic 10
-Topic 718
-Publisher FASB
-URI https://asc.fasb.org//1943274/2147480429/718-10-50-2
| Name: |
us-gaap_ShareBasedCompensationArrangementByShareBasedPaymentAwardNonOptionEquityInstrumentsOutstandingNumber |
| Namespace Prefix: |
us-gaap_ |
| Data Type: |
xbrli:sharesItemType |
| Balance Type: |
na |
| Period Type: |
instant |
|
| X |
- Details
| Name: |
us-gaap_StatementEquityComponentsAxis=us-gaap_WarrantMember |
| Namespace Prefix: |
|
| Data Type: |
na |
| Balance Type: |
|
| Period Type: |
|
|
v3.23.2
Stockholders’ Equity (Details Narrative) - USD ($)
|
|
|
|
3 Months Ended |
6 Months Ended |
|
Jun. 22, 2023 |
Nov. 17, 2022 |
Sep. 13, 2022 |
Jul. 31, 2023 |
Jul. 31, 2022 |
Jul. 31, 2023 |
Jul. 31, 2022 |
Jan. 31, 2023 |
| Class of Stock [Line Items] |
|
|
|
|
|
|
|
|
| Number of shares, value |
|
|
|
$ 8,280
|
|
$ 27,780
|
|
|
| Preferred stock, par value |
|
|
|
$ 0.00001
|
|
$ 0.00001
|
|
$ 0.00001
|
| Preferred stock authorized |
|
|
|
19,680,000
|
|
19,680,000
|
|
19,680,000
|
| Preferred stock, shares issued |
|
|
|
0
|
|
0
|
|
0
|
| Preferred shares, stock outstanding |
|
|
|
0
|
|
0
|
|
0
|
| Number of shares issued |
|
|
|
6,000
|
|
172,920
|
|
|
| Stock Issued During Period, Value, Conversion of Convertible Securities |
|
|
|
|
|
|
|
|
| Share based compensation |
|
|
|
|
|
$ 110,173
|
$ 12,333
|
|
| Stock option exercised |
|
|
|
6,000
|
|
206,000
|
|
|
| Weighted average exercise price |
|
|
|
$ 1.38
|
|
$ 0.40
|
|
|
| Share based compensation option |
|
|
|
|
|
$ 79,928
|
|
|
| Warrant [Member] |
|
|
|
|
|
|
|
|
| Class of Stock [Line Items] |
|
|
|
|
|
|
|
|
| Number of shares issued |
|
|
|
13,650
|
|
(13,650)
|
|
|
| Restricted Stock Units (RSUs) [Member] |
|
|
|
|
|
|
|
|
| Class of Stock [Line Items] |
|
|
|
|
|
|
|
|
| Share based compensation, awards granted |
|
|
|
39,733
|
|
39,733
|
|
|
| Share based compensation grant date fair value |
|
|
|
|
|
$ 70,000
|
|
|
| Share based compensation |
|
|
|
$ 37,083
|
|
69,612
|
|
|
| Unrecognized share based compensation |
|
|
|
449,960
|
|
449,960
|
|
|
| Share-Based Payment Arrangement, Option [Member] |
|
|
|
|
|
|
|
|
| Class of Stock [Line Items] |
|
|
|
|
|
|
|
|
| Share based compensation |
|
|
|
$ 18,000
|
$ 12,000
|
40,561
|
12,333
|
|
| Series A Preferred Stock [Member] |
|
|
|
|
|
|
|
|
| Class of Stock [Line Items] |
|
|
|
|
|
|
|
|
| Number of shares, value |
|
|
|
|
|
$ 20,000,000
|
|
|
| Preferred stock, par value |
|
|
|
$ 0.00001
|
|
$ 0.00001
|
|
$ 0.00001
|
| Preferred stock authorized |
|
|
|
120,000
|
|
120,000
|
|
120,000
|
| Preferred stock, shares issued |
|
|
|
23,400
|
|
23,400
|
|
23,400
|
| Preferred shares, stock outstanding |
|
|
|
0
|
|
0
|
|
0
|
| Series A Convertible Preferred Stock [Member] |
|
|
|
|
|
|
|
|
| Class of Stock [Line Items] |
|
|
|
|
|
|
|
|
| Preferred stock authorized |
|
|
|
120,000
|
|
120,000
|
|
|
| Preferred stock, shares issued |
|
|
|
0
|
|
0
|
|
0
|
| Preferred shares, stock outstanding |
|
|
|
0
|
|
0
|
|
0
|
| Series B Preferred Stock [Member] |
|
|
|
|
|
|
|
|
| Class of Stock [Line Items] |
|
|
|
|
|
|
|
|
| Preferred stock, par value |
|
|
|
$ 0.00001
|
|
$ 0.00001
|
|
$ 0.00001
|
| Preferred stock authorized |
|
|
|
200,000
|
|
200,000
|
|
200,000
|
| Preferred stock, shares issued |
|
|
|
0
|
|
0
|
|
54,600
|
| Preferred shares, stock outstanding |
|
|
|
0
|
|
0
|
|
54,600
|
| Dividend percentage |
|
|
|
|
|
8.00%
|
|
|
| Conversion of stock, description |
|
|
|
|
|
Each share of Series B Preferred Stock was convertible, at the option of the holder,
into shares of common stock at a rate of 1 share of Series B Preferred Stock into 15 shares of common stock. The Company was able to
force conversion at $2.00 per share of Common Stock at any time after six (6) months after issue if the Common Stock has a closing price
of $2.00 or higher in any 20 consecutive trading days. After 18 months, the Company could force holders to convert at a 20% discount
to the most recent 20-day average closing price per share
|
|
|
| Number of shares issued |
|
7,400
|
47,200
|
|
|
|
|
|
| Proceeds from Issuance Initial Public Offering |
|
$ 185,000
|
$ 1,180,000
|
|
|
|
|
|
| Stock Issued During Period, Value, Conversion of Convertible Securities |
$ 819,000
|
|
|
|
|
|
|
|
| Dividends paid |
|
|
|
$ 21,233
|
$ 0
|
$ 48,533
|
$ 0
|
|
| X |
- DefinitionShare based compensation option.
| Name: |
MAMA_ShareBasedCompensationOption |
| Namespace Prefix: |
MAMA_ |
| Data Type: |
xbrli:monetaryItemType |
| Balance Type: |
debit |
| Period Type: |
duration |
|
| X |
- DefinitionLine items represent financial concepts included in a table. These concepts are used to disclose reportable information associated with domain members defined in one or many axes to the table. Reference 1: http://www.xbrl.org/2003/role/exampleRef
-Topic 505
-SubTopic 10
-Name Accounting Standards Codification
-Section 50
-Paragraph 13
-Subparagraph (d)
-Publisher FASB
-URI https://asc.fasb.org//1943274/2147481112/505-10-50-13
Reference 2: http://www.xbrl.org/2003/role/recommendedDisclosureRef
-Topic 272
-SubTopic 10
-Name Accounting Standards Codification
-Section 45
-Paragraph 3
-Publisher FASB
-URI https://asc.fasb.org//1943274/2147483014/272-10-45-3
Reference 3: http://www.xbrl.org/2003/role/disclosureRef
-Topic 272
-SubTopic 10
-Name Accounting Standards Codification
-Section 50
-Paragraph 1
-Publisher FASB
-URI https://asc.fasb.org//1943274/2147482987/272-10-50-1
Reference 4: http://www.xbrl.org/2009/role/commonPracticeRef
-Topic 235
-SubTopic 10
-Name Accounting Standards Codification
-Section S99
-Paragraph 1
-Subparagraph (SX 210.4-08(d))
-Publisher FASB
-URI https://asc.fasb.org//1943274/2147480678/235-10-S99-1
Reference 5: http://www.xbrl.org/2003/role/disclosureRef
-Topic 505
-SubTopic 10
-Name Accounting Standards Codification
-Section 50
-Paragraph 13
-Subparagraph (a)
-Publisher FASB
-URI https://asc.fasb.org//1943274/2147481112/505-10-50-13
Reference 6: http://www.xbrl.org/2003/role/disclosureRef
-Topic 505
-SubTopic 10
-Name Accounting Standards Codification
-Section 50
-Paragraph 13
-Subparagraph (b)
-Publisher FASB
-URI https://asc.fasb.org//1943274/2147481112/505-10-50-13
Reference 7: http://www.xbrl.org/2003/role/disclosureRef
-Topic 505
-SubTopic 10
-Name Accounting Standards Codification
-Section 50
-Paragraph 13
-Subparagraph (e)
-Publisher FASB
-URI https://asc.fasb.org//1943274/2147481112/505-10-50-13
Reference 8: http://www.xbrl.org/2003/role/disclosureRef
-Topic 505
-SubTopic 10
-Name Accounting Standards Codification
-Section 50
-Paragraph 13
-Subparagraph (h)
-Publisher FASB
-URI https://asc.fasb.org//1943274/2147481112/505-10-50-13
Reference 9: http://www.xbrl.org/2003/role/disclosureRef
-Topic 505
-SubTopic 10
-Name Accounting Standards Codification
-Section 50
-Paragraph 14
-Subparagraph (b)
-Publisher FASB
-URI https://asc.fasb.org//1943274/2147481112/505-10-50-14
Reference 10: http://www.xbrl.org/2003/role/disclosureRef
-Topic 505
-SubTopic 10
-Name Accounting Standards Codification
-Section 50
-Paragraph 18
-Subparagraph (c)
-Publisher FASB
-URI https://asc.fasb.org//1943274/2147481112/505-10-50-18
Reference 11: http://www.xbrl.org/2003/role/disclosureRef
-Topic 210
-SubTopic 10
-Name Accounting Standards Codification
-Section S99
-Paragraph 1
-Subparagraph (SX 210.5-02(27)(b))
-Publisher FASB
-URI https://asc.fasb.org//1943274/2147480566/210-10-S99-1
Reference 12: http://www.xbrl.org/2003/role/disclosureRef
-Topic 210
-SubTopic 10
-Name Accounting Standards Codification
-Section S99
-Paragraph 1
-Subparagraph (SX 210.5-02(28))
-Publisher FASB
-URI https://asc.fasb.org//1943274/2147480566/210-10-S99-1
Reference 13: http://www.xbrl.org/2003/role/disclosureRef
-Topic 505
-SubTopic 10
-Name Accounting Standards Codification
-Section 50
-Paragraph 2
-Publisher FASB
-URI https://asc.fasb.org//1943274/2147481112/505-10-50-2
Reference 14: http://www.xbrl.org/2003/role/disclosureRef
-Topic 210
-SubTopic 10
-Name Accounting Standards Codification
-Section S99
-Paragraph 1
-Subparagraph (SX 210.5-02(29))
-Publisher FASB
-URI https://asc.fasb.org//1943274/2147480566/210-10-S99-1
Reference 15: http://www.xbrl.org/2003/role/disclosureRef
-Topic 946
-SubTopic 10
-Name Accounting Standards Codification
-Section S99
-Paragraph 3
-Subparagraph (SX 210.6-03(i)(2))
-Publisher FASB
-URI https://asc.fasb.org//1943274/2147479886/946-10-S99-3
Reference 16: http://www.xbrl.org/2003/role/disclosureRef
-Topic 946
-SubTopic 10
-Name Accounting Standards Codification
-Section S99
-Paragraph 3
-Subparagraph (SX 210.6-03(i)(1))
-Publisher FASB
-URI https://asc.fasb.org//1943274/2147479886/946-10-S99-3
Reference 17: http://www.xbrl.org/2003/role/disclosureRef
-Topic 946
-SubTopic 10
-Name Accounting Standards Codification
-Section S99
-Paragraph 3
-Subparagraph (SX 210.6-03(i)(2)(i))
-Publisher FASB
-URI https://asc.fasb.org//1943274/2147479886/946-10-S99-3
Reference 18: http://www.xbrl.org/2003/role/disclosureRef
-Topic 946
-SubTopic 10
-Name Accounting Standards Codification
-Section S99
-Paragraph 3
-Subparagraph (SX 210.6-03(i)(2)(ii))
-Publisher FASB
-URI https://asc.fasb.org//1943274/2147479886/946-10-S99-3
| Name: |
us-gaap_ClassOfStockLineItems |
| Namespace Prefix: |
us-gaap_ |
| Data Type: |
xbrli:stringItemType |
| Balance Type: |
na |
| Period Type: |
duration |
|
| X |
- DefinitionA unique description of a noncash or part noncash stock conversion. The description would be expected to include sufficient information to provide an understanding of the nature and purpose of the conversion. Noncash is defined as transactions during a period that do not result in cash receipts or cash payments in the period. "Part noncash" refers to that portion of the transaction not resulting in cash receipts or cash payments in the period. Reference 1: http://fasb.org/us-gaap/role/ref/legacyRef
-Name Accounting Standards Codification
-Topic 230
-SubTopic 10
-Section 50
-Paragraph 4
-Publisher FASB
-URI https://asc.fasb.org//1943274/2147482913/230-10-50-4
Reference 2: http://fasb.org/us-gaap/role/ref/legacyRef
-Name Accounting Standards Codification
-Topic 230
-SubTopic 10
-Section 50
-Paragraph 3
-Publisher FASB
-URI https://asc.fasb.org//1943274/2147482913/230-10-50-3
Reference 3: http://fasb.org/us-gaap/role/ref/legacyRef
-Name Accounting Standards Codification
-Topic 230
-SubTopic 10
-Section 50
-Paragraph 5
-Publisher FASB
-URI https://asc.fasb.org//1943274/2147482913/230-10-50-5
| Name: |
us-gaap_ConversionOfStockDescription |
| Namespace Prefix: |
us-gaap_ |
| Data Type: |
xbrli:stringItemType |
| Balance Type: |
na |
| Period Type: |
duration |
|
| X |
- DefinitionAmount of paid and unpaid cash, stock, and paid-in-kind (PIK) dividends declared, for example, but not limited to, common and preferred stock. Reference 1: http://fasb.org/us-gaap/role/ref/legacyRef
-Topic 505
-SubTopic 10
-Name Accounting Standards Codification
-Section S99
-Paragraph 1
-Subparagraph (SX 210.3-04)
-Publisher FASB
-URI https://asc.fasb.org//1943274/2147480008/505-10-S99-1
Reference 2: http://fasb.org/us-gaap/role/ref/legacyRef
-Name Accounting Standards Codification
-Section 45
-Paragraph 2
-SubTopic 405
-Topic 942
-Publisher FASB
-URI https://asc.fasb.org//1943274/2147481071/942-405-45-2
| Name: |
us-gaap_Dividends |
| Namespace Prefix: |
us-gaap_ |
| Data Type: |
xbrli:monetaryItemType |
| Balance Type: |
debit |
| Period Type: |
duration |
|
| X |
- DefinitionAmount of cost not yet recognized for nonvested award under share-based payment arrangement. Reference 1: http://www.xbrl.org/2003/role/disclosureRef
-Topic 718
-SubTopic 10
-Name Accounting Standards Codification
-Section 50
-Paragraph 2
-Subparagraph (i)
-Publisher FASB
-URI https://asc.fasb.org//1943274/2147480429/718-10-50-2
| Name: |
us-gaap_EmployeeServiceShareBasedCompensationNonvestedAwardsTotalCompensationCostNotYetRecognized |
| Namespace Prefix: |
us-gaap_ |
| Data Type: |
xbrli:monetaryItemType |
| Balance Type: |
debit |
| Period Type: |
instant |
|
| X |
- DefinitionThe percentage rate used to calculate dividend payments on preferred stock. Reference 1: http://www.xbrl.org/2003/role/disclosureRef
-Topic 505
-SubTopic 10
-Name Accounting Standards Codification
-Section 50
-Paragraph 13
-Subparagraph (b)
-Publisher FASB
-URI https://asc.fasb.org//1943274/2147481112/505-10-50-13
Reference 2: http://www.xbrl.org/2003/role/disclosureRef
-Topic 946
-SubTopic 320
-Name Accounting Standards Codification
-Section S99
-Paragraph 2
-Subparagraph (SX 210.12-12A(Column A)(Footnote 3))
-Publisher FASB
-URI https://asc.fasb.org//1943274/2147480032/946-320-S99-2
Reference 3: http://www.xbrl.org/2003/role/disclosureRef
-Topic 946
-SubTopic 320
-Name Accounting Standards Codification
-Section S99
-Paragraph 1
-Subparagraph (SX 210.12-12(Column A)(Footnote 4))
-Publisher FASB
-URI https://asc.fasb.org//1943274/2147480032/946-320-S99-1
Reference 4: http://www.xbrl.org/2003/role/disclosureRef
-Topic 946
-SubTopic 320
-Name Accounting Standards Codification
-Section S99
-Paragraph 3
-Subparagraph (SX 210.12-12B(Column A)(Footnote 3))
-Publisher FASB
-URI https://asc.fasb.org//1943274/2147480032/946-320-S99-3
Reference 5: http://www.xbrl.org/2003/role/disclosureRef
-Topic 946
-SubTopic 320
-Name Accounting Standards Codification
-Section S99
-Paragraph 6
-Subparagraph (SX 210.12-14(Column A)(Footnote 3))
-Publisher FASB
-URI https://asc.fasb.org//1943274/2147480032/946-320-S99-6
| Name: |
us-gaap_PreferredStockDividendRatePercentage |
| Namespace Prefix: |
us-gaap_ |
| Data Type: |
dtr-types:percentItemType |
| Balance Type: |
na |
| Period Type: |
duration |
|
| X |
- DefinitionFace amount or stated value per share of preferred stock nonredeemable or redeemable solely at the option of the issuer. Reference 1: http://www.xbrl.org/2003/role/disclosureRef
-Topic 505
-SubTopic 10
-Name Accounting Standards Codification
-Section 50
-Paragraph 13
-Subparagraph (a)
-Publisher FASB
-URI https://asc.fasb.org//1943274/2147481112/505-10-50-13
Reference 2: http://fasb.org/us-gaap/role/ref/legacyRef
-Topic 210
-SubTopic 10
-Name Accounting Standards Codification
-Section S99
-Paragraph 1
-Subparagraph (SX 210.5-02(28))
-Publisher FASB
-URI https://asc.fasb.org//1943274/2147480566/210-10-S99-1
| Name: |
us-gaap_PreferredStockParOrStatedValuePerShare |
| Namespace Prefix: |
us-gaap_ |
| Data Type: |
dtr-types:perShareItemType |
| Balance Type: |
na |
| Period Type: |
instant |
|
| X |
- DefinitionThe maximum number of nonredeemable preferred shares (or preferred stock redeemable solely at the option of the issuer) permitted to be issued by an entity's charter and bylaws. Reference 1: http://www.xbrl.org/2003/role/disclosureRef
-Topic 946
-SubTopic 210
-Name Accounting Standards Codification
-Section S99
-Paragraph 1
-Subparagraph (SX 210.6-04(16)(a))
-Publisher FASB
-URI https://asc.fasb.org//1943274/2147479617/946-210-S99-1
Reference 2: http://fasb.org/us-gaap/role/ref/legacyRef
-Topic 210
-SubTopic 10
-Name Accounting Standards Codification
-Section S99
-Paragraph 1
-Subparagraph (SX 210.5-02(28))
-Publisher FASB
-URI https://asc.fasb.org//1943274/2147480566/210-10-S99-1
| Name: |
us-gaap_PreferredStockSharesAuthorized |
| Namespace Prefix: |
us-gaap_ |
| Data Type: |
xbrli:sharesItemType |
| Balance Type: |
na |
| Period Type: |
instant |
|
| X |
- DefinitionTotal number of nonredeemable preferred shares (or preferred stock redeemable solely at the option of the issuer) issued to shareholders (includes related preferred shares that were issued, repurchased, and remain in the treasury). May be all or portion of the number of preferred shares authorized. Excludes preferred shares that are classified as debt. Reference 1: http://www.xbrl.org/2003/role/disclosureRef
-Topic 505
-SubTopic 10
-Name Accounting Standards Codification
-Section 50
-Paragraph 13
-Subparagraph (a)
-Publisher FASB
-URI https://asc.fasb.org//1943274/2147481112/505-10-50-13
Reference 2: http://fasb.org/us-gaap/role/ref/legacyRef
-Topic 210
-SubTopic 10
-Name Accounting Standards Codification
-Section S99
-Paragraph 1
-Subparagraph (SX 210.5-02(28))
-Publisher FASB
-URI https://asc.fasb.org//1943274/2147480566/210-10-S99-1
| Name: |
us-gaap_PreferredStockSharesIssued |
| Namespace Prefix: |
us-gaap_ |
| Data Type: |
xbrli:sharesItemType |
| Balance Type: |
na |
| Period Type: |
instant |
|
| X |
- DefinitionAggregate share number for all nonredeemable preferred stock (or preferred stock redeemable solely at the option of the issuer) held by stockholders. Does not include preferred shares that have been repurchased. Reference 1: http://www.xbrl.org/2003/role/disclosureRef
-Topic 946
-SubTopic 210
-Name Accounting Standards Codification
-Section S99
-Paragraph 2
-Subparagraph (SX 210.6-05(4))
-Publisher FASB
-URI https://asc.fasb.org//1943274/2147479617/946-210-S99-2
Reference 2: http://www.xbrl.org/2009/role/commonPracticeRef
-Topic 946
-SubTopic 220
-Name Accounting Standards Codification
-Section S99
-Paragraph 3
-Subparagraph (SX 210.6-09(4)(b))
-Publisher FASB
-URI https://asc.fasb.org//1943274/2147483575/946-220-S99-3
Reference 3: http://www.xbrl.org/2003/role/disclosureRef
-Topic 946
-SubTopic 210
-Name Accounting Standards Codification
-Section S99
-Paragraph 1
-Subparagraph (SX 210.6-04(16)(a))
-Publisher FASB
-URI https://asc.fasb.org//1943274/2147479617/946-210-S99-1
Reference 4: http://www.xbrl.org/2009/role/commonPracticeRef
-Topic 946
-SubTopic 220
-Name Accounting Standards Codification
-Section S99
-Paragraph 3
-Subparagraph (SX 210.6-09(7))
-Publisher FASB
-URI https://asc.fasb.org//1943274/2147483575/946-220-S99-3
Reference 5: http://fasb.org/us-gaap/role/ref/legacyRef
-Topic 210
-SubTopic 10
-Name Accounting Standards Codification
-Section S99
-Paragraph 1
-Subparagraph (SX 210.5-02(28))
-Publisher FASB
-URI https://asc.fasb.org//1943274/2147480566/210-10-S99-1
| Name: |
us-gaap_PreferredStockSharesOutstanding |
| Namespace Prefix: |
us-gaap_ |
| Data Type: |
xbrli:sharesItemType |
| Balance Type: |
na |
| Period Type: |
instant |
|
| X |
- DefinitionThe cash inflow associated with the amount received from entity's first offering of stock to the public. Reference 1: http://fasb.org/us-gaap/role/ref/legacyRef
-Name Accounting Standards Codification
-Section 45
-Paragraph 14
-Subparagraph (a)
-SubTopic 10
-Topic 230
-Publisher FASB
-URI https://asc.fasb.org//1943274/2147482740/230-10-45-14
| Name: |
us-gaap_ProceedsFromIssuanceInitialPublicOffering |
| Namespace Prefix: |
us-gaap_ |
| Data Type: |
xbrli:monetaryItemType |
| Balance Type: |
debit |
| Period Type: |
duration |
|
| X |
- DefinitionAmount of noncash expense for share-based payment arrangement. Reference 1: http://fasb.org/us-gaap/role/ref/legacyRef
-Name Accounting Standards Codification
-Section 45
-Paragraph 28
-Subparagraph (a)
-SubTopic 10
-Topic 230
-Publisher FASB
-URI https://asc.fasb.org//1943274/2147482740/230-10-45-28
| Name: |
us-gaap_ShareBasedCompensation |
| Namespace Prefix: |
us-gaap_ |
| Data Type: |
xbrli:monetaryItemType |
| Balance Type: |
debit |
| Period Type: |
duration |
|
| X |
- DefinitionNumber of non-option equity instruments exercised by participants. Reference 1: http://fasb.org/us-gaap/role/ref/legacyRef
-Name Accounting Standards Codification
-Section 50
-Paragraph 2
-Subparagraph (c)(1)(iv)(2)
-SubTopic 10
-Topic 718
-Publisher FASB
-URI https://asc.fasb.org//1943274/2147480429/718-10-50-2
| Name: |
us-gaap_ShareBasedCompensationArrangementByShareBasedPaymentAwardNonOptionEquityInstrumentsExercised |
| Namespace Prefix: |
us-gaap_ |
| Data Type: |
xbrli:sharesItemType |
| Balance Type: |
na |
| Period Type: |
duration |
|
| X |
- DefinitionThe difference between the maximum number of shares (or other type of equity) authorized for issuance under the plan (including the effects of amendments and adjustments), and the sum of: 1) the number of shares (or other type of equity) already issued upon exercise of options or other equity-based awards under the plan; and 2) shares (or other type of equity) reserved for issuance on granting of outstanding awards, net of cancellations and forfeitures, if applicable. Reference 1: http://fasb.org/us-gaap/role/ref/legacyRef
-Name Accounting Standards Codification
-Topic 718
-SubTopic 10
-Section 50
-Paragraph 2
-Publisher FASB
-URI https://asc.fasb.org//1943274/2147480429/718-10-50-2
| Name: |
us-gaap_ShareBasedCompensationArrangementByShareBasedPaymentAwardNumberOfSharesAvailableForGrant |
| Namespace Prefix: |
us-gaap_ |
| Data Type: |
xbrli:sharesItemType |
| Balance Type: |
na |
| Period Type: |
instant |
|
| X |
- DefinitionWeighted average price at which option holders acquired shares when converting their stock options into shares. Reference 1: http://www.xbrl.org/2003/role/disclosureRef
-Topic 718
-SubTopic 10
-Name Accounting Standards Codification
-Section 50
-Paragraph 2
-Subparagraph (c)(1)(iv)(02)
-Publisher FASB
-URI https://asc.fasb.org//1943274/2147480429/718-10-50-2
| Name: |
us-gaap_ShareBasedCompensationArrangementsByShareBasedPaymentAwardOptionsExercisesInPeriodWeightedAverageExercisePrice |
| Namespace Prefix: |
us-gaap_ |
| Data Type: |
dtr-types:perShareItemType |
| Balance Type: |
na |
| Period Type: |
duration |
|
| X |
- DefinitionValue, after forfeiture, of shares granted under share-based payment arrangement. Excludes employee stock ownership plan (ESOP). Reference 1: http://fasb.org/us-gaap/role/ref/legacyRef
-Name Accounting Standards Codification
-Topic 718
-SubTopic 10
-Section 30
-Paragraph 3
-Publisher FASB
-URI https://asc.fasb.org//1943274/2147480513/718-10-30-3
Reference 2: http://fasb.org/us-gaap/role/ref/legacyRef
-Name Accounting Standards Codification
-Topic 718
-SubTopic 30
-Section 35
-Paragraph 1
-Publisher FASB
-URI https://asc.fasb.org//1943274/2147480843/718-30-35-1
| Name: |
us-gaap_StockGrantedDuringPeriodValueSharebasedCompensation |
| Namespace Prefix: |
us-gaap_ |
| Data Type: |
xbrli:monetaryItemType |
| Balance Type: |
credit |
| Period Type: |
duration |
|
| X |
- DefinitionNumber of new stock issued during the period. Reference 1: http://fasb.org/us-gaap/role/ref/legacyRef
-Name Accounting Standards Codification
-Section 50
-Paragraph 2
-SubTopic 10
-Topic 505
-Publisher FASB
-URI https://asc.fasb.org//1943274/2147481112/505-10-50-2
Reference 2: http://www.xbrl.org/2003/role/disclosureRef
-Topic 946
-SubTopic 505
-Name Accounting Standards Codification
-Section 50
-Paragraph 2
-Subparagraph (a)
-Publisher FASB
-URI https://asc.fasb.org//1943274/2147481004/946-505-50-2
Reference 3: http://www.xbrl.org/2003/role/disclosureRef
-Topic 946
-SubTopic 220
-Name Accounting Standards Codification
-Section S99
-Paragraph 3
-Subparagraph (SX 210.6-09(4)(b))
-Publisher FASB
-URI https://asc.fasb.org//1943274/2147483575/946-220-S99-3
Reference 4: http://www.xbrl.org/2003/role/disclosureRef
-Topic 946
-SubTopic 10
-Name Accounting Standards Codification
-Section S99
-Paragraph 3
-Subparagraph (SX 210.6-03(i)(1))
-Publisher FASB
-URI https://asc.fasb.org//1943274/2147479886/946-10-S99-3
Reference 5: http://fasb.org/us-gaap/role/ref/legacyRef
-Topic 210
-SubTopic 10
-Name Accounting Standards Codification
-Section S99
-Paragraph 1
-Subparagraph (SX 210.5-02(28))
-Publisher FASB
-URI https://asc.fasb.org//1943274/2147480566/210-10-S99-1
Reference 6: http://fasb.org/us-gaap/role/ref/legacyRef
-Topic 505
-SubTopic 10
-Name Accounting Standards Codification
-Section S99
-Paragraph 1
-Subparagraph (SX 210.3-04)
-Publisher FASB
-URI https://asc.fasb.org//1943274/2147480008/505-10-S99-1
Reference 7: http://fasb.org/us-gaap/role/ref/legacyRef
-Topic 210
-SubTopic 10
-Name Accounting Standards Codification
-Section S99
-Paragraph 1
-Subparagraph (SX 210.5-02(29))
-Publisher FASB
-URI https://asc.fasb.org//1943274/2147480566/210-10-S99-1
| Name: |
us-gaap_StockIssuedDuringPeriodSharesNewIssues |
| Namespace Prefix: |
us-gaap_ |
| Data Type: |
xbrli:sharesItemType |
| Balance Type: |
na |
| Period Type: |
duration |
|
| X |
- DefinitionNumber of share options (or share units) exercised during the current period. Reference 1: http://fasb.org/us-gaap/role/ref/legacyRef
-Name Accounting Standards Codification
-Section 50
-Paragraph 2
-SubTopic 10
-Topic 505
-Publisher FASB
-URI https://asc.fasb.org//1943274/2147481112/505-10-50-2
Reference 2: http://www.xbrl.org/2003/role/disclosureRef
-Topic 718
-SubTopic 10
-Name Accounting Standards Codification
-Section 50
-Paragraph 2
-Subparagraph (c)(1)(iv)(02)
-Publisher FASB
-URI https://asc.fasb.org//1943274/2147480429/718-10-50-2
Reference 3: http://fasb.org/us-gaap/role/ref/legacyRef
-Topic 210
-SubTopic 10
-Name Accounting Standards Codification
-Section S99
-Paragraph 1
-Subparagraph (SX 210.5-02(28))
-Publisher FASB
-URI https://asc.fasb.org//1943274/2147480566/210-10-S99-1
Reference 4: http://fasb.org/us-gaap/role/ref/legacyRef
-Topic 505
-SubTopic 10
-Name Accounting Standards Codification
-Section S99
-Paragraph 1
-Subparagraph (SX 210.3-04)
-Publisher FASB
-URI https://asc.fasb.org//1943274/2147480008/505-10-S99-1
Reference 5: http://fasb.org/us-gaap/role/ref/legacyRef
-Topic 210
-SubTopic 10
-Name Accounting Standards Codification
-Section S99
-Paragraph 1
-Subparagraph (SX 210.5-02(29))
-Publisher FASB
-URI https://asc.fasb.org//1943274/2147480566/210-10-S99-1
| Name: |
us-gaap_StockIssuedDuringPeriodSharesStockOptionsExercised |
| Namespace Prefix: |
us-gaap_ |
| Data Type: |
xbrli:sharesItemType |
| Balance Type: |
na |
| Period Type: |
duration |
|
| X |
- DefinitionThe gross value of stock issued during the period upon the conversion of convertible securities. Reference 1: http://fasb.org/us-gaap/role/ref/legacyRef
-Name Accounting Standards Codification
-Section 50
-Paragraph 2
-SubTopic 10
-Topic 505
-Publisher FASB
-URI https://asc.fasb.org//1943274/2147481112/505-10-50-2
Reference 2: http://fasb.org/us-gaap/role/ref/legacyRef
-Topic 505
-SubTopic 10
-Name Accounting Standards Codification
-Section S99
-Paragraph 1
-Subparagraph (SX 210.3-04)
-Publisher FASB
-URI https://asc.fasb.org//1943274/2147480008/505-10-S99-1
Reference 3: http://fasb.org/us-gaap/role/ref/legacyRef
-Name Accounting Standards Codification
-Topic 210
-SubTopic 10
-Section S99
-Paragraph 1
-Subparagraph (SX 210.5-02.29-31)
-Publisher FASB
-URI https://asc.fasb.org//1943274/2147480566/210-10-S99-1
| Name: |
us-gaap_StockIssuedDuringPeriodValueConversionOfConvertibleSecurities |
| Namespace Prefix: |
us-gaap_ |
| Data Type: |
xbrli:monetaryItemType |
| Balance Type: |
credit |
| Period Type: |
duration |
|
| X |
- DefinitionEquity impact of the value of new stock issued during the period. Includes shares issued in an initial public offering or a secondary public offering. Reference 1: http://fasb.org/us-gaap/role/ref/legacyRef
-Name Accounting Standards Codification
-Section 50
-Paragraph 2
-SubTopic 10
-Topic 505
-Publisher FASB
-URI https://asc.fasb.org//1943274/2147481112/505-10-50-2
Reference 2: http://www.xbrl.org/2003/role/exampleRef
-Topic 946
-SubTopic 830
-Name Accounting Standards Codification
-Section 55
-Paragraph 11
-Publisher FASB
-URI https://asc.fasb.org//1943274/2147480167/946-830-55-11
Reference 3: http://www.xbrl.org/2003/role/disclosureRef
-Topic 946
-SubTopic 205
-Name Accounting Standards Codification
-Section 45
-Paragraph 4
-Subparagraph (a)
-Publisher FASB
-URI https://asc.fasb.org//1943274/2147480767/946-205-45-4
Reference 4: http://www.xbrl.org/2003/role/disclosureRef
-Topic 946
-SubTopic 505
-Name Accounting Standards Codification
-Section 50
-Paragraph 2
-Subparagraph (a)
-Publisher FASB
-URI https://asc.fasb.org//1943274/2147481004/946-505-50-2
Reference 5: http://www.xbrl.org/2003/role/disclosureRef
-Topic 946
-SubTopic 220
-Name Accounting Standards Codification
-Section S99
-Paragraph 3
-Subparagraph (SX 210.6-09(4)(b))
-Publisher FASB
-URI https://asc.fasb.org//1943274/2147483575/946-220-S99-3
Reference 6: http://fasb.org/us-gaap/role/ref/legacyRef
-Topic 210
-SubTopic 10
-Name Accounting Standards Codification
-Section S99
-Paragraph 1
-Subparagraph (SX 210.5-02(28))
-Publisher FASB
-URI https://asc.fasb.org//1943274/2147480566/210-10-S99-1
Reference 7: http://fasb.org/us-gaap/role/ref/legacyRef
-Topic 505
-SubTopic 10
-Name Accounting Standards Codification
-Section S99
-Paragraph 1
-Subparagraph (SX 210.3-04)
-Publisher FASB
-URI https://asc.fasb.org//1943274/2147480008/505-10-S99-1
Reference 8: http://fasb.org/us-gaap/role/ref/legacyRef
-Topic 210
-SubTopic 10
-Name Accounting Standards Codification
-Section S99
-Paragraph 1
-Subparagraph (SX 210.5-02(29))
-Publisher FASB
-URI https://asc.fasb.org//1943274/2147480566/210-10-S99-1
| Name: |
us-gaap_StockIssuedDuringPeriodValueNewIssues |
| Namespace Prefix: |
us-gaap_ |
| Data Type: |
xbrli:monetaryItemType |
| Balance Type: |
credit |
| Period Type: |
duration |
|
| X |
- Details
| Name: |
us-gaap_StatementEquityComponentsAxis=us-gaap_WarrantMember |
| Namespace Prefix: |
|
| Data Type: |
na |
| Balance Type: |
|
| Period Type: |
|
|
| X |
- Details
| Name: |
us-gaap_AwardTypeAxis=us-gaap_RestrictedStockUnitsRSUMember |
| Namespace Prefix: |
|
| Data Type: |
na |
| Balance Type: |
|
| Period Type: |
|
|
| X |
- Details
| Name: |
us-gaap_AwardTypeAxis=us-gaap_EmployeeStockOptionMember |
| Namespace Prefix: |
|
| Data Type: |
na |
| Balance Type: |
|
| Period Type: |
|
|
| X |
- Details
| Name: |
us-gaap_StatementClassOfStockAxis=us-gaap_SeriesAPreferredStockMember |
| Namespace Prefix: |
|
| Data Type: |
na |
| Balance Type: |
|
| Period Type: |
|
|
| X |
- Details
| Name: |
us-gaap_StatementClassOfStockAxis=MAMA_SeriesAConvertiblePreferredStockMember |
| Namespace Prefix: |
|
| Data Type: |
na |
| Balance Type: |
|
| Period Type: |
|
|
| X |
- Details
| Name: |
us-gaap_StatementClassOfStockAxis=us-gaap_SeriesBPreferredStockMember |
| Namespace Prefix: |
|
| Data Type: |
na |
| Balance Type: |
|
| Period Type: |
|
|
v3.23.2
Commitments and Contingencies (Details Narrative) - USD ($)
|
3 Months Ended |
6 Months Ended |
Jul. 31, 2023 |
Jul. 31, 2022 |
Jul. 31, 2023 |
Jul. 31, 2022 |
| Loss Contingencies [Line Items] |
|
|
|
|
| Royalty expenses |
$ 129,000
|
$ 125,000
|
$ 318,000
|
$ 275,000
|
| Minimum [Member] |
|
|
|
|
| Loss Contingencies [Line Items] |
|
|
|
|
| Royalty expenses |
|
|
$ 125,000
|
|
| Year One [Member] |
|
|
|
|
| Loss Contingencies [Line Items] |
|
|
|
|
| Percentage of royalty rate on net sales |
|
|
6.00%
|
|
| Royalty income nonoperating |
|
|
$ 500,000
|
|
| Year Two [Member] |
|
|
|
|
| Loss Contingencies [Line Items] |
|
|
|
|
| Percentage of royalty rate on net sales |
|
|
4.00%
|
|
| Year Two [Member] | Minimum [Member] |
|
|
|
|
| Loss Contingencies [Line Items] |
|
|
|
|
| Royalty income nonoperating |
|
|
$ 500,000
|
|
| Year Two [Member] | Maximum [Member] |
|
|
|
|
| Loss Contingencies [Line Items] |
|
|
|
|
| Royalty income nonoperating |
|
|
$ 2,500,000
|
|
| Year Three [Member] |
|
|
|
|
| Loss Contingencies [Line Items] |
|
|
|
|
| Percentage of royalty rate on net sales |
|
|
2.00%
|
|
| Year Three [Member] | Minimum [Member] |
|
|
|
|
| Loss Contingencies [Line Items] |
|
|
|
|
| Royalty income nonoperating |
|
|
$ 2,500,000
|
|
| Year Three [Member] | Maximum [Member] |
|
|
|
|
| Loss Contingencies [Line Items] |
|
|
|
|
| Royalty income nonoperating |
|
|
$ 20,000,000
|
|
| Year Four [Member] |
|
|
|
|
| Loss Contingencies [Line Items] |
|
|
|
|
| Percentage of royalty rate on net sales |
|
|
1.00%
|
|
| Royalty income nonoperating |
|
|
$ 20,000,000
|
|
| X |
- DefinitionPercentage of royalty on net sales.
| Name: |
MAMA_PercentageOfRoyaltyRateOnNetSales |
| Namespace Prefix: |
MAMA_ |
| Data Type: |
dtr-types:percentItemType |
| Balance Type: |
na |
| Period Type: |
duration |
|
| X |
- DefinitionLine items represent financial concepts included in a table. These concepts are used to disclose reportable information associated with domain members defined in one or many axes to the table. Reference 1: http://www.xbrl.org/2003/role/disclosureRef
-Topic 460
-SubTopic 10
-Name Accounting Standards Codification
-Section 50
-Paragraph 3
-Publisher FASB
-URI https://asc.fasb.org//1943274/2147482425/460-10-50-3
Reference 2: http://www.xbrl.org/2003/role/disclosureRef
-Topic 450
-SubTopic 20
-Name Accounting Standards Codification
-Section 50
-Paragraph 1
-Publisher FASB
-URI https://asc.fasb.org//1943274/2147483076/450-20-50-1
Reference 3: http://www.xbrl.org/2009/role/commonPracticeRef
-Topic 450
-SubTopic 20
-Name Accounting Standards Codification
-Section 50
-Paragraph 4
-Subparagraph (a)
-Publisher FASB
-URI https://asc.fasb.org//1943274/2147483076/450-20-50-4
Reference 4: http://www.xbrl.org/2003/role/disclosureRef
-Topic 450
-SubTopic 20
-Name Accounting Standards Codification
-Section 50
-Paragraph 4
-Subparagraph (b)
-Publisher FASB
-URI https://asc.fasb.org//1943274/2147483076/450-20-50-4
Reference 5: http://www.xbrl.org/2009/role/commonPracticeRef
-Topic 450
-SubTopic 20
-Name Accounting Standards Codification
-Section 50
-Paragraph 9
-Subparagraph (a)
-Publisher FASB
-URI https://asc.fasb.org//1943274/2147483076/450-20-50-9
Reference 6: http://www.xbrl.org/2003/role/disclosureRef
-Topic 450
-SubTopic 20
-Name Accounting Standards Codification
-Section 50
-Paragraph 9
-Subparagraph (b)
-Publisher FASB
-URI https://asc.fasb.org//1943274/2147483076/450-20-50-9
| Name: |
us-gaap_LossContingenciesLineItems |
| Namespace Prefix: |
us-gaap_ |
| Data Type: |
xbrli:stringItemType |
| Balance Type: |
na |
| Period Type: |
duration |
|
| X |
- DefinitionAmount of expense related to royalty payments under a contractual arrangement such as payment for mineral and drilling rights and use of technology or intellectual property. Reference 1: http://fasb.org/us-gaap/role/ref/legacyRef
-Topic 220
-SubTopic 10
-Name Accounting Standards Codification
-Section S99
-Paragraph 2
-Subparagraph (SX 210.5-03.3)
-Publisher FASB
-URI https://asc.fasb.org//1943274/2147483621/220-10-S99-2
| Name: |
us-gaap_RoyaltyExpense |
| Namespace Prefix: |
us-gaap_ |
| Data Type: |
xbrli:monetaryItemType |
| Balance Type: |
debit |
| Period Type: |
duration |
|
| X |
- DefinitionAncillary revenue earned during the period from the consideration paid to the entity for the use of its rights and property by another party. Examples include licensing the use of copyrighted materials and leasing the extraction of natural resources. Reference 1: http://fasb.org/us-gaap/role/ref/legacyRef
-Topic 220
-SubTopic 10
-Name Accounting Standards Codification
-Section S99
-Paragraph 2
-Subparagraph (SX 210.5-03.7)
-Publisher FASB
-URI https://asc.fasb.org//1943274/2147483621/220-10-S99-2
| Name: |
us-gaap_RoyaltyIncomeNonoperating |
| Namespace Prefix: |
us-gaap_ |
| Data Type: |
xbrli:monetaryItemType |
| Balance Type: |
credit |
| Period Type: |
duration |
|
| X |
- Details
| Name: |
srt_RangeAxis=srt_MinimumMember |
| Namespace Prefix: |
|
| Data Type: |
na |
| Balance Type: |
|
| Period Type: |
|
|
| X |
- Details
| Name: |
us-gaap_LeaseContractualTermAxis=MAMA_YearOneMember |
| Namespace Prefix: |
|
| Data Type: |
na |
| Balance Type: |
|
| Period Type: |
|
|
| X |
- Details
| Name: |
us-gaap_LeaseContractualTermAxis=MAMA_YearTwoMember |
| Namespace Prefix: |
|
| Data Type: |
na |
| Balance Type: |
|
| Period Type: |
|
|
| X |
- Details
| Name: |
srt_RangeAxis=srt_MaximumMember |
| Namespace Prefix: |
|
| Data Type: |
na |
| Balance Type: |
|
| Period Type: |
|
|
| X |
- Details
| Name: |
us-gaap_LeaseContractualTermAxis=MAMA_YearThreeMember |
| Namespace Prefix: |
|
| Data Type: |
na |
| Balance Type: |
|
| Period Type: |
|
|
| X |
- Details
| Name: |
us-gaap_LeaseContractualTermAxis=MAMA_YearFourMember |
| Namespace Prefix: |
|
| Data Type: |
na |
| Balance Type: |
|
| Period Type: |
|
|
v3.23.2
| X |
- References
+ Details
| Name: |
MAMA_DisclosureLeasesAbstract |
| Namespace Prefix: |
MAMA_ |
| Data Type: |
xbrli:stringItemType |
| Balance Type: |
na |
| Period Type: |
duration |
|
| X |
- DefinitionAmount of cash outflow for principal payment on finance lease. Reference 1: http://www.xbrl.org/2003/role/disclosureRef
-Topic 842
-SubTopic 20
-Name Accounting Standards Codification
-Section 50
-Paragraph 4
-Subparagraph (g)(1)
-Publisher FASB
-URI https://asc.fasb.org//1943274/2147478964/842-20-50-4
Reference 2: http://www.xbrl.org/2003/role/disclosureRef
-Topic 842
-SubTopic 20
-Name Accounting Standards Codification
-Section 45
-Paragraph 5
-Subparagraph (a)
-Publisher FASB
-URI https://asc.fasb.org//1943274/2147479041/842-20-45-5
| Name: |
us-gaap_FinanceLeasePrincipalPayments |
| Namespace Prefix: |
us-gaap_ |
| Data Type: |
xbrli:monetaryItemType |
| Balance Type: |
credit |
| Period Type: |
duration |
|
| X |
- DefinitionWeighted average discount rate for finance lease calculated at point in time. Reference 1: http://www.xbrl.org/2003/role/exampleRef
-Topic 842
-SubTopic 20
-Name Accounting Standards Codification
-Section 55
-Paragraph 53
-Publisher FASB
-URI https://asc.fasb.org//1943274/2147479589/842-20-55-53
Reference 2: http://www.xbrl.org/2003/role/disclosureRef
-Topic 842
-SubTopic 20
-Name Accounting Standards Codification
-Section 50
-Paragraph 4
-Subparagraph (g)(4)
-Publisher FASB
-URI https://asc.fasb.org//1943274/2147478964/842-20-50-4
| Name: |
us-gaap_FinanceLeaseWeightedAverageDiscountRatePercent |
| Namespace Prefix: |
us-gaap_ |
| Data Type: |
dtr-types:percentItemType |
| Balance Type: |
na |
| Period Type: |
instant |
|
| X |
- DefinitionWeighted average remaining lease term for finance lease, in 'PnYnMnDTnHnMnS' format, for example, 'P1Y5M13D' represents reported fact of one year, five months, and thirteen days. Reference 1: http://www.xbrl.org/2003/role/exampleRef
-Topic 842
-SubTopic 20
-Name Accounting Standards Codification
-Section 55
-Paragraph 53
-Publisher FASB
-URI https://asc.fasb.org//1943274/2147479589/842-20-55-53
Reference 2: http://www.xbrl.org/2003/role/disclosureRef
-Topic 842
-SubTopic 20
-Name Accounting Standards Codification
-Section 50
-Paragraph 4
-Subparagraph (g)(3)
-Publisher FASB
-URI https://asc.fasb.org//1943274/2147478964/842-20-50-4
| Name: |
us-gaap_FinanceLeaseWeightedAverageRemainingLeaseTerm1 |
| Namespace Prefix: |
us-gaap_ |
| Data Type: |
xbrli:durationItemType |
| Balance Type: |
na |
| Period Type: |
instant |
|
| X |
- DefinitionAmount of cash outflow from operating lease, excluding payments to bring another asset to condition and location necessary for its intended use. Reference 1: http://www.xbrl.org/2003/role/disclosureRef
-Topic 842
-SubTopic 20
-Name Accounting Standards Codification
-Section 45
-Paragraph 5
-Subparagraph (c)
-Publisher FASB
-URI https://asc.fasb.org//1943274/2147479041/842-20-45-5
Reference 2: http://www.xbrl.org/2003/role/disclosureRef
-Topic 842
-SubTopic 20
-Name Accounting Standards Codification
-Section 50
-Paragraph 4
-Subparagraph (g)(1)
-Publisher FASB
-URI https://asc.fasb.org//1943274/2147478964/842-20-50-4
| Name: |
us-gaap_OperatingLeasePayments |
| Namespace Prefix: |
us-gaap_ |
| Data Type: |
xbrli:monetaryItemType |
| Balance Type: |
credit |
| Period Type: |
duration |
|
| X |
- DefinitionWeighted average discount rate for operating lease calculated at point in time. Reference 1: http://www.xbrl.org/2003/role/exampleRef
-Topic 842
-SubTopic 20
-Name Accounting Standards Codification
-Section 55
-Paragraph 53
-Publisher FASB
-URI https://asc.fasb.org//1943274/2147479589/842-20-55-53
Reference 2: http://www.xbrl.org/2003/role/disclosureRef
-Topic 842
-SubTopic 20
-Name Accounting Standards Codification
-Section 50
-Paragraph 4
-Subparagraph (g)(4)
-Publisher FASB
-URI https://asc.fasb.org//1943274/2147478964/842-20-50-4
| Name: |
us-gaap_OperatingLeaseWeightedAverageDiscountRatePercent |
| Namespace Prefix: |
us-gaap_ |
| Data Type: |
dtr-types:percentItemType |
| Balance Type: |
na |
| Period Type: |
instant |
|
| X |
- DefinitionWeighted average remaining lease term for operating lease, in 'PnYnMnDTnHnMnS' format, for example, 'P1Y5M13D' represents reported fact of one year, five months, and thirteen days. Reference 1: http://www.xbrl.org/2003/role/exampleRef
-Topic 842
-SubTopic 20
-Name Accounting Standards Codification
-Section 55
-Paragraph 53
-Publisher FASB
-URI https://asc.fasb.org//1943274/2147479589/842-20-55-53
Reference 2: http://www.xbrl.org/2003/role/disclosureRef
-Topic 842
-SubTopic 20
-Name Accounting Standards Codification
-Section 50
-Paragraph 4
-Subparagraph (g)(3)
-Publisher FASB
-URI https://asc.fasb.org//1943274/2147478964/842-20-50-4
| Name: |
us-gaap_OperatingLeaseWeightedAverageRemainingLeaseTerm1 |
| Namespace Prefix: |
us-gaap_ |
| Data Type: |
xbrli:durationItemType |
| Balance Type: |
na |
| Period Type: |
instant |
|
v3.23.2
Schedule of Future Minimum Payments Required Under Maturities of Lease Liabilities (Details)
|
Jul. 31, 2023
USD ($)
|
| Leases |
|
| 2024 |
$ 486,910
|
| 2025 |
951,205
|
| 2026 |
847,464
|
| 2027 |
691,145
|
| 2028 |
713,501
|
| Thereafter |
1,454,059
|
| Total lease payments |
5,144,284
|
| Less: amounts representing interest |
748,544
|
| Total lease obligations |
$ 4,395,740
|
| X |
- References
+ Details
| Name: |
MAMA_DisclosureLeasesAbstract |
| Namespace Prefix: |
MAMA_ |
| Data Type: |
xbrli:stringItemType |
| Balance Type: |
na |
| Period Type: |
duration |
|
| X |
- DefinitionLessee operating and finance lease liability payments due.
| Name: |
MAMA_LesseeOperatingAndFinanceLeaseLiabilityPaymentsDue |
| Namespace Prefix: |
MAMA_ |
| Data Type: |
xbrli:monetaryItemType |
| Balance Type: |
credit |
| Period Type: |
instant |
|
| X |
- DefinitionLessee operating and finance lease liability payments due after year five.
| Name: |
MAMA_LesseeOperatingAndFinanceLeaseLiabilityPaymentsDueAfterYearFive |
| Namespace Prefix: |
MAMA_ |
| Data Type: |
xbrli:monetaryItemType |
| Balance Type: |
credit |
| Period Type: |
instant |
|
| X |
- DefinitionLessee operating and finance lease liability payments due next twelve months.
| Name: |
MAMA_LesseeOperatingAndFinanceLeaseLiabilityPaymentsDueNextTwelveMonths |
| Namespace Prefix: |
MAMA_ |
| Data Type: |
xbrli:monetaryItemType |
| Balance Type: |
credit |
| Period Type: |
instant |
|
| X |
- DefinitionLessee operating and finance lease liability payments due year five.
| Name: |
MAMA_LesseeOperatingAndFinanceLeaseLiabilityPaymentsDueYearFive |
| Namespace Prefix: |
MAMA_ |
| Data Type: |
xbrli:monetaryItemType |
| Balance Type: |
credit |
| Period Type: |
instant |
|
| X |
- DefinitionLessee operating and finance lease liability payments due year four.
| Name: |
MAMA_LesseeOperatingAndFinanceLeaseLiabilityPaymentsDueYearFour |
| Namespace Prefix: |
MAMA_ |
| Data Type: |
xbrli:monetaryItemType |
| Balance Type: |
credit |
| Period Type: |
instant |
|
| X |
- DefinitionLessee operating and finance lease liability payments due year three.
| Name: |
MAMA_LesseeOperatingAndFinanceLeaseLiabilityPaymentsDueYearThree |
| Namespace Prefix: |
MAMA_ |
| Data Type: |
xbrli:monetaryItemType |
| Balance Type: |
credit |
| Period Type: |
instant |
|
| X |
- DefinitionLessee operating and finance lease liability payments due year two.
| Name: |
MAMA_LesseeOperatingAndFinanceLeaseLiabilityPaymentsDueYearTwo |
| Namespace Prefix: |
MAMA_ |
| Data Type: |
xbrli:monetaryItemType |
| Balance Type: |
credit |
| Period Type: |
instant |
|
| X |
- DefinitionLessee operating and finance lease liability undiscounted excess amount.
| Name: |
MAMA_LesseeOperatingAndFinanceLeaseLiabilityUndiscountedExcessAmount |
| Namespace Prefix: |
MAMA_ |
| Data Type: |
xbrli:monetaryItemType |
| Balance Type: |
credit |
| Period Type: |
instant |
|
| X |
- DefinitionOperating and finance lease liability.
| Name: |
MAMA_OperatingAndFinanceLeaseLiability |
| Namespace Prefix: |
MAMA_ |
| Data Type: |
xbrli:monetaryItemType |
| Balance Type: |
credit |
| Period Type: |
instant |
|
v3.23.2
| X |
- DefinitionRemaining lease term of operating lease, in 'PnYnMnDTnHnMnS' format, for example, 'P1Y5M13D' represents reported fact of one year, five months, and thirteen days. Reference 1: http://www.xbrl.org/2009/role/commonPracticeRef
-Topic 842
-SubTopic 20
-Name Accounting Standards Codification
-Section 50
-Paragraph 3
-Subparagraph (a)(1)
-Publisher FASB
-URI https://asc.fasb.org//1943274/2147478964/842-20-50-3
| Name: |
us-gaap_LesseeOperatingLeaseRemainingLeaseTerm |
| Namespace Prefix: |
us-gaap_ |
| Data Type: |
xbrli:durationItemType |
| Balance Type: |
na |
| Period Type: |
instant |
|
| X |
- Details
| Name: |
srt_RangeAxis=srt_MinimumMember |
| Namespace Prefix: |
|
| Data Type: |
na |
| Balance Type: |
|
| Period Type: |
|
|
| X |
- Details
| Name: |
srt_RangeAxis=srt_MaximumMember |
| Namespace Prefix: |
|
| Data Type: |
na |
| Balance Type: |
|
| Period Type: |
|
|
v3.23.2
MamaMancinis (NASDAQ:MMMB)
Historical Stock Chart
From Mar 2024 to Apr 2024

MamaMancinis (NASDAQ:MMMB)
Historical Stock Chart
From Apr 2023 to Apr 2024
