Did Someone Forget The BONK? Trading Volume Plunges Over 70%
April 12 2024 - 2:47AM
NEWSBTC
Bucking the trend within the highly volatile memecoin sector, Bonk
(BONK), a Solana-native meme token, has exhibited a bearish bias
despite prevailing bullish sentiment across the broader memecoin
market. Related Reading: Shiba Inu Surpasses 4 Million Addresses,
Ignites Frenzy Recent data from CoinMarketCap reveals a staggering
25% price decline for Bonk over the past month, a stark contrast to
the general upward trajectory witnessed across the meme coin
landscape during the same period. At the time of writing, BONK was
trading at $0.00002166, down 1.93% and 1.40% in the daily and
weekly timeframes, data from CMC shows. Traders Grapple With
Uncertainty In Bonk’s Derivatives Market In the derivatives market,
where traders speculate on the future price movements of assets,
Bonk’s futures open interest has witnessed a dramatic decline,
plummeting by a staggering 60% since early March, as reported by
data from Coinglass. This sharp downturn in open interest reflects
a significant reduction in the number of contracts or positions
held by traders, indicative of diminishing interest and confidence
in Bonk’s prospects among derivative traders. Despite the
pronounced downturn in futures open interest, the funding rate
across various cryptocurrency exchanges has managed to maintain a
positive stance. This funding rate, which reflects the cost of
holding long positions relative to short positions, suggests that
some traders are still maintaining optimism and are unwilling to
entirely abandon the possibility of an impending uptrend in Bonk’s
price. BONKUSD trading at $0.000021on the daily chart:
TradingView.com However, the conflicting signals between technical
indicators and market sentiment leave traders grappling with
uncertainty, unsure whether to hold onto their positions or cut
their losses. The 30-day period under review has seen a significant
fall in Bonk’s daily trading volume, with Santiment’s data
indicating a 75% decrease. This decline in trading activity adds
further weight to the bearish sentiment surrounding the coin,
signaling waning investor interest and confidence in its potential.
Source: Santiment Technical Indicators Signal Trouble For Bonk
Further exacerbating Bonk’s woes are its momentum indicators, which
reveal a troubling discrepancy between distribution and
accumulation. The Money Flow Index (MFI) points to increased
selling activity, outweighing any attempts at buying and adding
further downward pressure on the coin’s value. Related Reading: CEO
Throws Cold Water On May Ethereum ETF Approval – Impact On Price As
the market grapples with these conflicting signals, the spotlight
remains firmly fixed on Bonk and its ability to weather the storm.
With its MACD line sinking below the signal and zero lines,
signaling a weakening short-term trend compared to its longer-term
outlook, traders are faced with a critical decision point. A
Glimmer Of Hope Amidst The Storm As traders continue to monitor the
situation closely, there is potential for a shift in sentiment that
could breathe new life into Bonk’s ailing price. For now, the road
ahead for Bonk remains uncertain, with technical indicators
pointing towards further declines while traders cling to hopes of a
reversal. Featured image from Pixabay, chart from TradingView
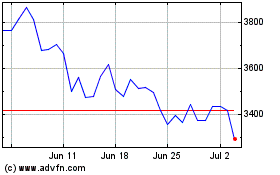
Ethereum (COIN:ETHUSD)
Historical Stock Chart
From Mar 2024 to Apr 2024

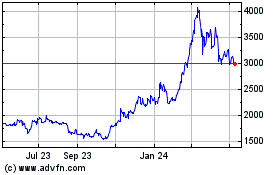
Ethereum (COIN:ETHUSD)
Historical Stock Chart
From Apr 2023 to Apr 2024
