| Non-GAAP to GAAP Reconciliations (continued)
29
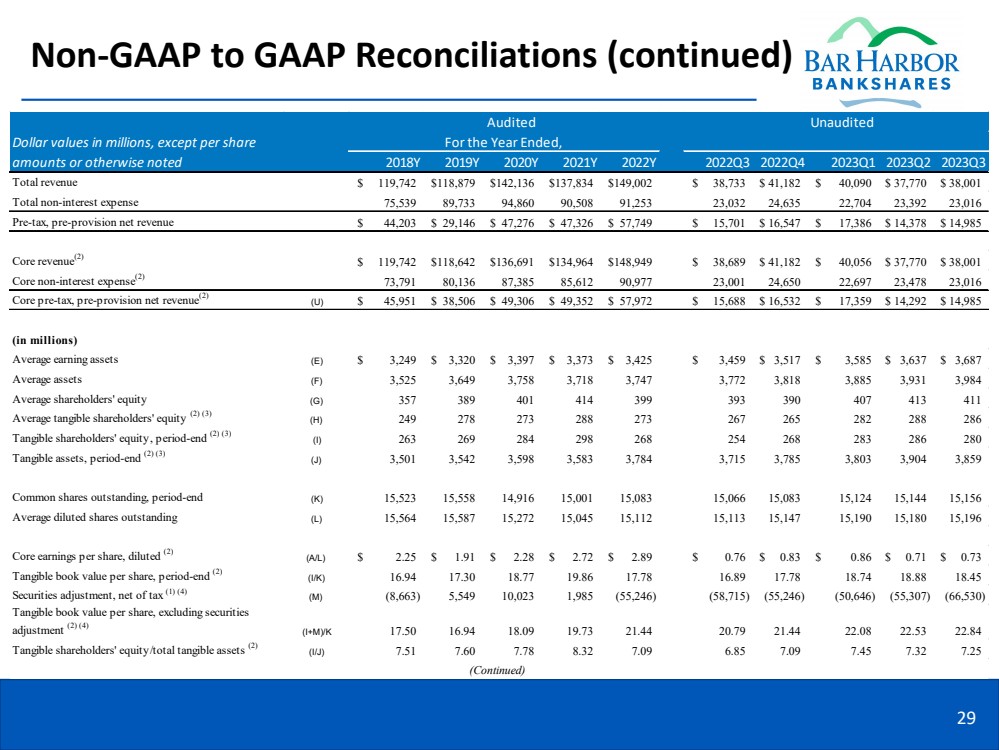
Audited Unaudited
2018Y 2019Y 2020Y 2021Y 2022Y 2022Q3 2022Q4 2023Q1 2023Q2 2023Q3
Total revenue $ 119,742 $118,879 $142,136 $137,834 $149,002 $ 38,733 $ 41,182 $ 40,090 $ 37,770 $ 38,001
Total non-interest expense 75,539 89,733 94,860 90,508 91,253 23,032 24,635 22,704 23,392 23,016
Pre-tax, pre-provision net revenue $ 44,203 $ 29,146 $ 47,276 $ 47,326 $ 57,749 $ 15,701 $ 16,547 $ 17,386 $ 14,378 $ 14,985
Core revenue(2) $ 119,742 $118,642 $136,691 $134,964 $148,949 $ 38,689 $ 41,182 $ 40,056 $ 37,770 $ 38,001
Core non-interest expense(2) 73,791 80,136 87,385 85,612 90,977 23,001 24,650 22,697 23,478 23,016
Core pre-tax, pre-provision net revenue(2) (U) $ 45,951 $ 38,506 $ 49,306 $ 49,352 $ 57,972 $ 15,688 $ 16,532 $ 17,359 $ 14,292 $ 14,985
(in millions)
Average earning assets (E) $ 3,249 $ 3,320 $ 3,397 $ 3,373 $ 3,425 $ 3,459 $ 3,517 $ 3,585 $ 3,637 $ 3,687
Average assets (F) 3,525 3,649 3,758 3,718 3,747 3,772 3,818 3,885 3,931 3,984
Average shareholders' equity (G) 357 389 401 414 399 393 390 407 413 411
Average tangible shareholders' equity (2) (3) (H) 249 278 273 288 273 267 265 282 288 286
Tangible shareholders' equity, period-end (2) (3) (I) 263 269 284 298 268 254 268 283 286 280
Tangible assets, period-end (2) (3) (J) 3,501 3,542 3,598 3,583 3,784 3,715 3,785 3,803 3,904 3,859
Common shares outstanding, period-end (K) 15,523 15,558 14,916 15,001 15,083 15,066 15,083 15,124 15,144 15,156
Average diluted shares outstanding (L) 15,564 15,587 15,272 15,045 15,112 15,113 15,147 15,190 15,180 15,196
Core earnings per share, diluted (2) (A/L) $ 2.25 $ 1.91 $ 2.28 $ 2.72 $ 2.89 $ 0.76 $ 0.83 $ 0.86 $ 0.71 $ 0.73
Tangible book value per share, period-end (2) (I/K) 16.94 17.30 18.77 19.86 17.78 16.89 17.78 18.74 18.88 18.45
Securities adjustment, net of tax (1) (4) (M) (8,663) 5,549 10,023 1,985 (55,246) (58,715) (55,246) (50,646) (55,307) (66,530)
Tangible book value per share, excluding securities
adjustment (2) (4) (I+M)/K 17.50 16.94 18.09 19.73 21.44 20.79 21.44 22.08 22.53 22.84
Tangible shareholders' equity/total tangible assets (2) (I/J) 7.51 7.60 7.78 8.32 7.09 6.85 7.09 7.45 7.32 7.25
Dollar values in millions, except per share
amounts or otherwise noted
For the Year Ended,
(Continued) |