Canadian Natural Misses Earnings - Analyst Blog
May 06 2013 - 10:26AM
Zacks
Independent oil and gas explorer, Canadian Natural
Resources Ltd. (CNQ), reported mixed first-quarter 2013
results.
Earnings per share, excluding one-time and non-cash items, were 37
Canadian cents (37 US cents) in the quarter, way behind the Zacks
Consensus Estimate of 43 US cents. The miss is primarily due to
significant fall in price realization for crude oil.
The Calgary, Alberta-based operator’s per share profits were
however up from the first quarter of 2012 level of 27 Canadian
cents (27 US cents), favored by higher price realizations for
natural gas.
Quarterly revenues of C$3,755.0 million (US$3,726.1 million) were
up 6.5% from the year-ago period, owing to higher crude oil and
liquid production. The top line also surpassed our projection of
US$3,427.0 million.
Canadian Natural’s first-quarter cash flow – a key metric to gauge
its capability to fund new projects and drilling – amounted to
C$1,571.0 million, which was 22.7% higher than that achieved in the
first quarter of 2012.
Production
The total production of Canadian Natural during the quarter was up
11.2% year over year to a record 680,844 oil-equivalent barrels per
day (BOE/d). Oil and natural gas liquids (NGLs) production
increased approximately 23.7% to 489,157 barrels per day (Bbl/d),
primarily due to successful drilling of crude oil.
Natural gas production, however, declined 11.7% from the prior-year
period to 1,150 million cubic feet per day (MMcf/d) due to the
decision of Canadian Natural to reduce drilling operations of
natural gas and allocate capital for oil projects that will provide
higher return.
Realized Prices
On a reported basis, the average realized crude oil price (before
hedging) during the first quarter was C$60.87 per barrel,
representing a drop of 26.1% from the corresponding quarter last
year. The average realized natural gas price (excluding hedging)
during the three months ended Mar 31, 2013 was C$3.51 per thousand
cubic feet (Mcf), up from the year-ago level of C$2.73 per Mcf.
Capital Expenditure & Balance Sheet
Canadian Natural's total capital spending during the quarter was
C$1,736.0 million, as against C$1,596.0 million in the year-ago
quarter.
As of Mar 31, 2013, Canada’s second-largest oil producer had C$18.0
million cash in hand and long-term debt of approximately C$9,322.0
million, representing a debt-to-capitalization ratio of 27.7%.
Guidance
Management is guiding towards production of 435,000–461,000 Bbl/d
of liquids and 1,090–1,110 MMcf/d of natural gas during the second
quarter of 2013. Canadian Natural is planning to drill 27 net
thermal in-situ wells and 127 net crude oil wells in North America
during the Apr-Jun period of 2013.
For 2013, Canadian Natural estimates production of 482,000–513,000
Bbl/d of liquids and 1,085–1,145 MMcf/d of natural gas.
Dividend
Canadian Natural announced quarterly cash dividend payment of 12.5
Canadian cents per share, which has increased by 19.0% from the
year-ago level. The increased dividend will be paid on Jul 1, 2013,
to shareholders of record as on Jun 14, 2013.
Stocks to Consider
Canadian Natural currently carries a Zacks Rank #3 (Hold), implying
that it is expected to perform in line with the broader U.S. equity
market over the next one to three months.
Meanwhile, one can look at energy firms like EPL Oil &
Gas Inc. (EPL), SemGroup Corporation
(SEMG) and InterOil Corporation (IOC) as
attractive investments. All these firms sport a Zacks Rank #1
(Strong Buy) and are expected to significantly outperform the
broader U.S. equity market over the next one to three months.
CDN NTRL RSRCS (CNQ): Free Stock Analysis Report
EPL OIL&GAS INC (EPL): Free Stock Analysis Report
INTEROIL CORP (IOC): Free Stock Analysis Report
SEMGROUP CORP-A (SEMG): Free Stock Analysis Report
To read this article on Zacks.com click here.
Zacks Investment Research
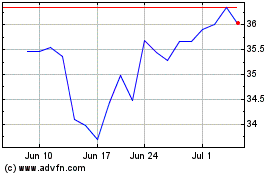
Canadian Natural Resources (NYSE:CNQ)
Historical Stock Chart
From Jun 2024 to Jul 2024

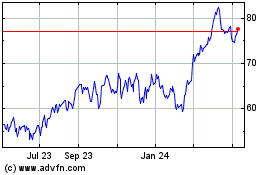
Canadian Natural Resources (NYSE:CNQ)
Historical Stock Chart
From Jul 2023 to Jul 2024
