FTSE Poland Key Figures
|
FTSE Poland Balance Sheet| %1$s Balance Sheet | | Sorry No Data Available |
|
 Share Price Performance| Share Price Performance | | Sample Period † | High | Low | | 1 week | 15,023.67 | 13,653.76 |
| 4 weeks | 15,023.67 | 13,201.92 |
| 12 weeks | 15,023.67 | 11,389.91 |
| 1 year | 15,023.67 | 10,837.69 |
Share Price Chart (5 years)| Share Price Chart (5 years) | 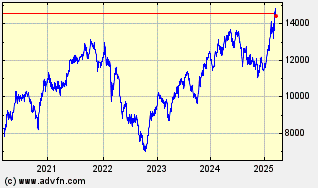 |
|
FTSE Poland Historic Returns| %1$s Historic Returns | | Giorni da oggi † | Open | Change | % | Open Avg. | Avg. Daily Vol [m] | Total Vol [m] | VWAP | | 1 week | 13,653.76 | 1,169.10 | 8.56 | 13,653.76 | - | | - |
| 4 weeks | 14,112.52 | 710.34 | 5.03 | 13,201.92 | - | | - |
| 12 weeks | 11,500.24 | 3,322.62 | 28.89 | 11,389.91 | - | | - |
| 26 weeks | 12,040.56 | 2,782.30 | 23.11 | 10,837.69 | - | | - |
| 1 year | 12,361.13 | 2,461.73 | 19.92 | 10,837.69 | - | | - |
| 3 years | 11,146.00 | 3,676.86 | 32.99 | 6,872.53 | - | | - |
| 5 years | 7,767.49 | 7,055.37 | 90.83 | 6,872.53 | - | | - |
| † periods calculated are whole weeks rather than calendar months | |
|