Range Production Reaches New High - Analyst Blog
January 18 2012 - 5:30AM
Zacks
In an interim update, independent
oil and gas operator, Range Resources Corporation
(RRC) announced that it achieved record production in the fourth
quarter of 2011. The production increased 16% on both a
year-over-year as well as sequential basis to reach an average
production volume of 625 million cubic feet of gas equivalent
(Mmcfe) per day.
Production for full-year 2011
climbed 12% compared to 14% in 2010 and averaged 554 Mmcfe per day.
Despite the sale of Barnett assets in April 2011, Range saw the
eighth consecutive year of double-digit production growth. The 12%
production growth in 2011 would have been 36%, adjusting for the
sale of the Barnett properties.
Range also declared its preliminary
natural gas, natural gas liquids (NGL’s) and oil price realizations
(including the impact of cash-settled hedges and derivative
settlements) for fourth quarter 2011. The average price realization
of $5.44 per thousand cubic feet of gas equivalent (Mcfe) grew 2%
from prior-year period.
Production of natural gas, natural
gas liquids and crude oil averaged 491 Mmcfe, 16,931 barrels per
day and 5,409 barrels per day, respectively. The price realized by
natural gas, natural gas liquids and crude oil were $4.14, $54.31
and $83.71, respectively.
The company increased its commodity
hedge position during the fourth quarter, with approximately 75% of
its estimated natural gas production for 2012 hedged at a weighted
average floor of $4.45 per million British thermal units (Mmbtu).
Range has also hedged the majority of its 2013 projected natural
gas production at a floor price of $4.73 per Mmbtu.
However, considering the company’s
exposure to volatile natural gas fundamentals, interest rate risks
and an uncertain macro backdrop, we maintain our long-term
Underperform recommendation. Headquartered in Fort Worth, Texas,
Range Resources competes with EQT Corporation
(EQT), SM Energy Company (SM) and Ultra
Petroleum Corp. (UPL).
Range holds a Zacks #4 Rank, which
translates into a Sell rating for a period of one to three
months.
EQT CORP (EQT): Free Stock Analysis Report
RANGE RESOURCES (RRC): Free Stock Analysis Report
SM ENERGY CO (SM): Free Stock Analysis Report
ULTRA PETRO CP (UPL): Free Stock Analysis Report
To read this article on Zacks.com click here.
Zacks Investment Research
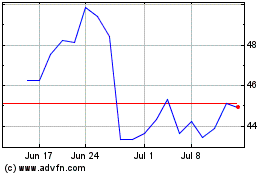
SM Energy (NYSE:SM)
Historical Stock Chart
From May 2024 to Jun 2024

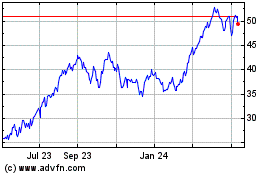
SM Energy (NYSE:SM)
Historical Stock Chart
From Jun 2023 to Jun 2024
