Drilling Tools International Corp false 0001884516 0001884516 2023-11-13 2023-11-13
UNITED STATES
SECURITIES AND EXCHANGE COMMISSION
WASHINGTON, DC 20549
FORM 8-K
CURRENT REPORT
PURSUANT TO SECTION 13 or 15(d)
OF THE SECURITIES EXCHANGE ACT OF 1934
Date of report (Date of earliest event reported): November 13, 2023
DRILLING TOOLS INTERNATIONAL CORPORATION
(Exact name of registrant as specified in its charter)
|
|
|
|
|
| Delaware |
|
001-41103 |
|
87-2488708 |
| (State or other jurisdiction of Incorporation) |
|
(Commission file number) |
|
(I.R.S. Employer Identification No.) |
3701 Briarpark Drive
Suite 150
Houston, Texas 77042
(Address of principal executive offices, zip code)
Registrant’s telephone number, including area code: (832) 742-8500
Check the appropriate box below if the Form 8-K filing is intended to simultaneously satisfy the filing obligation of the registrant under any of the following provisions:
| |
☐ |
Written communication pursuant to Rule 425 under the Securities Act (17 CFR 230.425) |
| |
☐ |
Soliciting material pursuant to Rule 14a-12 under the Exchange Act (17 CFR 240.14a-12) |
| |
☐ |
Pre-commencement communication pursuant to Rule 14d-2(b) under the Exchange Act (17 CFR 240.14d-2(b)) |
| |
☐ |
Pre-commencement communication pursuant to Rule 13e-4(c) under the Exchange Act (17 CFR 240.13e-4(c)) |
Securities registered pursuant to Section 12(b) of the Act:
|
|
|
|
|
| Title of each class |
|
Trading Symbol(s) |
|
Name of each exchange on which registered |
| Common Stock, par value $0.0001 per share |
|
DTI |
|
The Nasdaq Stock Market LLC |
Indicate by check mark whether the registrant is an emerging growth company as defined in Rule 405 of the Securities Act of 1933 (§230.405 of this chapter) or Rule 12b-2 of the Securities Exchange Act of 1934 (§240.12b-2 of this chapter).
Emerging growth company ☒
If an emerging growth company, indicate by check mark if the registrant has elected not to use the extended transition period for complying with any new or revised financial accounting standards provided pursuant to Section 13(a) of the Exchange Act. ☐
| Item 2.02. |
Results of Operations and Financial Condition. |
On November 13, 2023, Drilling Tools International Corporation (the “Company”) issued a press release announcing the Company’s financial and operating results for the quarter ended September 30, 2023. A copy of the press release is furnished as Exhibit 99.1 hereto and incorporated herein by reference. Additional information regarding the Company’s results of operations and financial conditions for the quarter is furnished as Exhibit 99.2 hereto and incorporated herein by reference.
The information in this report and the exhibits attached hereto shall not be deemed to be “filed” for purposes of the Securities Exchange Act of 1934 (the “Exchange Act”) or otherwise subject to the liabilities of that section, not shall it be deemed incorporated by reference in any filing under the Securities Act of 1933, as amended, or the Exchange Act, regardless of any general incorporation language in such filing.
| Item 9.01. |
Financial Statements and Exhibits. |
(d) Exhibits:
SIGNATURES
Pursuant to the requirements of the Securities Exchange Act of 1934, the registrant has duly caused this report to be signed on its behalf by the undersigned thereunto duly authorized.
|
|
|
|
|
|
|
|
|
|
|
DRILLING TOOLS INTERNATIONAL CORPORATION |
|
|
|
|
|
|
|
|
By: |
|
/s/ R. Wayne Prejean |
|
|
|
|
|
|
R. Wayne Prejean |
|
|
|
|
|
|
Chief Executive Officer |
|
|
|
|
| Date: November 13, 2023 |
|
|
|
|
|
|
Exhibit 99.1

Drilling Tools International Reports Third Quarter 2023 Financial Results
HOUSTON, TEXAS (November 13, 2023) — Drilling Tools International Corp., (“DTI” or the “Company”) (Nasdaq: DTI), a
leading oilfield services company that manufactures and provides a differentiated, rental-focused offering of tools for use in horizontal and directional drilling, operating from 22 locations across North America, Europe and the Middle East, today
reported its financial and operational results for the third quarter ended September 30, 2023.
Third Quarter Financial Highlights
| |
• |
|
Net Revenue of $38.1 million increased 4.4% from $36.5 million in Q3 2022 |
| |
• |
|
Operating expenses of $(31.0) million were higher compared to $(28.5) million in Q3 2022 |
| |
• |
|
Net Income was $4.3 million, compared to $6.7 million in Q3 2022 |
| |
• |
|
Diluted Earnings Per Share were $0.21, compared to $0.36 in Q3 2022 |
| |
• |
|
Adjusted EBITDA was $12.7 million, compared to $13.0 million in Q2 2022 |
“While US rig activity has declined approximately 20% since the beginning of the year, DTI continues to execute on plan, with a decrease of only 5% in
monthly revenue from December 2022 to September 2023, outperforming the market,” said Wayne Prejean, CEO of DTI. “We remain focused on cost control, operational efficiencies and maintaining a strong financial position, in order to increase
shareholder value and position the Company to thoughtfully execute on accretive growth opportunities going forward.”
Third Quarter 2023 Financial
and Operating Results
In the third quarter the Company generated Net Tool Rental Revenue of $29.4 million, which was an increase of 9.4% compared
to the third quarter of 2022. This increase was primarily driven by increased market activity and customer pricing across all divisions, led by the Directional Tool Rentals (“DTR”) division.
Product Sales Net Revenue in the third quarter totaled $8.8 million, a decrease of 9.6% compared to the third quarter of 2022. The decrease was primarily
driven by lower than average rental tool recovery rate in the quarter.
Third quarter 2023 Operating Expenses were $(31.0) million, compared to $(28.5)
million in the third quarter of 2022. The increase was primarily driven by higher personnel expenses, depreciation from an increased property, plant and equipment balance, and an increase in insurance expenses.
Third quarter 2023 Net Income was $4.3 million, or $0.21 per diluted share, compared to Net Income of $6.7 million, or $0.36 per diluted share, in
the prior year quarter. The primary factors contributing to the decline included higher taxes and a lower than average Rental Tool recovery revenue, as well as higher personnel, depreciation and insurance expenses. These negative impacts were
partially offset by increased market activity and customer pricing across the Tool Rental segment.
Third quarter 2023 Adjusted EBITDA was
$12.7 million, compared to Adjusted EBITDA of $13.0 million in the prior year quarter. The decrease was primarily driven by higher personnel expenses and other public company costs in the third quarter of 2023, and higher than average Tool
Recovery revenue in the third quarter of 2022.
At September 30, 2023 the Company had $4.0 million of cash and cash equivalents. DTI retains
strong financial flexibility with access to an undrawn $60 million revolving line of credit.
Outlook
US onshore rig activity has declined by approximately 20% on a monthly basis compared with the start of 2023. Despite the challenging environment, DTI
continues to execute well, with a revenue decreased of only 5% from December 2022 to September 2023. Management anticipates the rig count will remain relatively flat in 4Q and is maintaining its previous projections for the full year 2023:
Full Year 2023
| |
• |
|
Revenue: $150 – 158 million |
| |
• |
|
Adjusted EBITDA: $50 – 54 million |
| |
• |
|
Gross Capital Expenditures: $44 – 46 million |
| |
• |
|
Net Income: $12 – 19 million |
| |
• |
|
Adjusted Free Cash Flow(1): $6 – 8 million
|
| (1) |
Adjusted Free Cash Flow defined as Adjusted EBITDA less Gross Capital Expenditures |
Webcast Information
The DTI management team will host a conference call to discuss its third quarter 2023 financial results today, Monday, November 13, 2023, at 12:00 pm
Eastern Time. Interested investors and other parties may access the live webcast via the following link: Drilling Tools International 3Q Earnings Call, or through the webcast link located on the News & Events page, within the
Investor Relations section of DTI’s website at https://investors.drillingtools.com/news-events/events.
Please log in to the webcast at least 10
minutes prior to the start of the event. An archive of the webcast will be available for a period of time shortly after the call on the News and Events page on the Investor Relations section of DTI’s website, along with the earnings press
release.
About DTI
DTI, with roots dating back to
1984, is a Houston, Texas based leading oilfield services company that manufactures and rents downhole drilling tools used in horizontal and directional drilling of oil and natural gas wells. DTI operates from 20 locations across North America,
Europe and the Middle East. To learn more about DTI visit: www.drillingtools.com.
Forward-Looking Statements
This press release may include, and oral statements made from time to time by representatives of the Company may include, “forward-looking
statements” within the meaning of Section 27A of the Securities Act of 1933, as amended, and Section 21E of the Securities Exchange Act of 1934, as amended. Statements regarding the business combination and the financing thereof, and
related matters, as well as all other statements other than statements of historical fact included in this press release are forward-looking statements. The words “anticipate,” “believe,” “continue,” “could,”
“estimate,” “expect,” “intends,” “may,” “might,” “plan,” “possible,” “potential,” “predict,” “project,” “should,” “will,”
“would” and similar expressions may identify forward-looking statements, but the absence of these words does not mean that a statement is not forward looking. These forward-looking statements include, but are not limited to, statements
regarding DTI and its management team’s expectations, hopes, beliefs, intentions or strategies regarding the future. In addition, any statements that refer to projections, forecasts or other characterizations of future events or circumstances,
including any underlying assumptions, are forward-looking statements. Forward looking statements in this press release may include, for example, statements about: (1) the demand for DTI’s products and services, which is influenced by the
general level activity in the oil and gas industry; (2) DTI’s ability to retain its customers, particularly those that contribute to a large portion of its revenue; (3) DTI’s ability to remain the sole North American distributor
of the Drill-N-Ream; (4) DTI’s ability to employ and retain a sufficient number of skilled and qualified workers, including its key personnel;
(5) DTI’s ability to market its services in a competitive industry; (9) DTI’s ability to execute, integrate and realize the benefits of acquisitions, and manage the resulting growth of its business; (6) potential liability
for claims arising from damage or harm caused by the operation of DTI’s tools, or otherwise arising from the dangerous activities that are inherent in the oil and gas industry; (7) DTI’s ability to obtain additional capital;
(8) potential political, regulatory, economic and social disruptions in the countries in which DTI conducts business, including changes in tax laws or tax rates; (9) DTI’s dependence on its information technology systems, in
particular Customer Order Management Portal and Support System, for the efficient operation of DTI’s business; (10) DTI’s ability to comply with applicable laws, regulations and rules, including those related to the environment,
greenhouse gases and climate change; (11) DTI’s ability to maintain an effective system of disclosure controls and internal control over financial reporting; (12) the potential for volatility in the market price of DTI’s common
stock; (13) the impact of increased legal, accounting, administrative and other costs incurred as a public company, including the impact of possible shareholder litigation; (14) the potential for issuance of additional shares of DTI’s
common stock or other equity securities; (15) DTI’s ability to maintain the listing of its common stock on Nasdaq; and (16) other risks and uncertainties separately provided to you and indicated from time to time described in filings
and potential filings by DTI with the Securities and Exchange Commission (the “SEC”). You should carefully consider the risks and uncertainties described in the definitive proxy statement/prospectus/consent solicitation statement with the
SEC by the Company on May 12, 2023 (the “Proxy Statement”), and the information presented in DTI’s current report on Form 8-K filed June 27, 2023 (the
“8-K”) and the quarterly report on Form 10-Q filed August 14, 2023 (the “10-Q”). Such forward-looking
statements are based on the beliefs of management of DTI, as well as assumptions made by, and information currently available to DTI’s management. Actual results could differ materially from those contemplated by the forward-looking statements
as a result of certain factors detailed in the Proxy Statement, the 8-K or the 10-Q. All subsequent written or oral
forward-looking statements attributable to the Company or persons acting on its behalf are qualified in their entirety by this paragraph. Forward-looking statements are subject to numerous conditions, many of
which are beyond the control of each of DTI, including those set forth in the Risk Factors section of the Proxy Statement, and described in the 8-K and the 10-Q. The
Company undertakes no obligation to update these statements for revisions or changes after the date of this release, except as required by law.
Investor Relations
Sioban Hickie
InvestorRelations@drillingtools.com
Drilling Tools International Corporation
Unaudited Condensed Consolidated Balance Sheets
(in thousands, except share data)
|
|
|
|
|
|
|
|
|
| |
|
September 30,
2023 |
|
|
December 31,
2022 |
|
| |
|
(Unaudited) |
|
|
(Audited) |
|
| Assets |
|
|
|
|
|
|
|
|
| Current Assets |
|
|
|
|
|
|
|
|
| Cash |
|
$ |
3,989 |
|
|
$ |
2,352 |
|
| Accounts Receivable, Net |
|
|
29,073 |
|
|
|
28,998 |
|
| Inventories, Net |
|
|
6,586 |
|
|
|
3,281 |
|
| Prepaid Expenses and Other Current Assets |
|
|
4,976 |
|
|
|
4,381 |
|
| Investments - Equity Securities, at Fair Value |
|
|
995 |
|
|
|
1,143 |
|
|
|
|
|
|
|
|
|
|
| Total Current Assets |
|
|
45,619 |
|
|
|
40,155 |
|
| Property & Equipment, Net |
|
|
64,569 |
|
|
|
44,154 |
|
| Operating Lease
Right-of-Use Asset |
|
|
19,621 |
|
|
|
20,037 |
|
| Intangible Assets, Net |
|
|
228 |
|
|
|
263 |
|
| Deferred Financing Costs, Net |
|
|
460 |
|
|
|
226 |
|
| Deposits and Other Long-Term Assets |
|
|
939 |
|
|
|
383 |
|
|
|
|
|
|
|
|
|
|
| Total Assets |
|
$ |
131,436 |
|
|
$ |
105,218 |
|
|
|
|
|
|
|
|
|
|
| Liabilities, Redeemable Convertible Preferred Stock & Shareholders’
Equity |
|
|
|
|
|
|
|
|
| Current Liabilities |
|
|
|
|
|
|
|
|
| Accounts Payable |
|
$ |
8,089 |
|
|
$ |
7,281 |
|
| Accrued Expenses and Other Current Liabilities |
|
|
11,864 |
|
|
|
7,299 |
|
| Current Portion of Operating Lease Liabilities |
|
|
3,940 |
|
|
|
3,311 |
|
| Revolving Line of Credit |
|
|
— |
|
|
|
18,349 |
|
|
|
|
|
|
|
|
|
|
| Total Current Liabilities |
|
|
23,893 |
|
|
|
36,240 |
|
| Operating Lease Liabilities, Less Current Portion |
|
|
15,753 |
|
|
|
16,691 |
|
| Deferred Tax Liabilities, Net |
|
|
6,926 |
|
|
|
3,185 |
|
|
|
|
|
|
|
|
|
|
| Total Liabilities |
|
|
46,572 |
|
|
|
56,116 |
|
|
|
|
|
|
|
|
|
|
| Commitments and Contingencies (See Note 14) |
|
|
|
|
|
|
|
|
| Redeemable Convertible Preferred Stock |
|
|
|
|
|
|
|
|
| Series A redeemable convertible preferred stock*, par value $0.01; nil shares and 30,000,000
shares authorized at September 30, 2023 and December 31, 2022, respectively; nil shares and 6,719,641 shares issued and outstanding at September 30, 2023 and December 31, 2022, respectively |
|
|
— |
|
|
|
17,878 |
|
| Shareholder’s Equity |
|
|
|
|
|
|
|
|
| Common stock*, par value $0.0001; 500,000,000 and 65,000,000 shares authorized at
September 30, 2023 and December 31, 2022, respectively; 29,768,535 shares and 11,951,137 shares issued and outstanding at September 30, 2023 and December 31, 2022, respectively |
|
|
3 |
|
|
|
1 |
|
| Preferred stock, par value $0.0001; 10,000,000 shares and nil shares authorized at Septmeber 30,
2023 and December 31, 2022, respectively; nil shares issued and outstanding at September 30, 2023 and December 31, 2022, respectively |
|
|
— |
|
|
|
— |
|
| Additional
paid-in-capital |
|
|
95,218 |
|
|
|
52,388 |
|
| Accumulated deficit |
|
|
(10,129 |
) |
|
|
(21,054 |
) |
| Less treasury stock, at cost; nil shares at September 30, 2023 and December 31,
2022 |
|
|
— |
|
|
|
— |
|
| Accumulated other comprehensive loss |
|
|
(228 |
) |
|
|
(111 |
) |
|
|
|
|
|
|
|
|
|
| Total Shareholder’s Equity |
|
|
84,864 |
|
|
|
31,224 |
|
|
|
|
|
|
|
|
|
|
| Total Liabilities, Redeemable Convertible Preferred Stock & Shareholders’ Equity |
|
$ |
131,436 |
|
|
$ |
105,218 |
|
|
|
|
|
|
|
|
|
|
| * |
Shares of legacy redeemable convertible preferred stock and legacy common stock have been retroactively
restated to give effect to the Merger |
Drilling Tools International Corporation
Unaudited Condensed Consolidated Statement of Operations and Comprehensive Income
(in thousands, except share data)
|
|
|
|
|
|
|
|
|
| |
|
Three Months Ended September 30, |
|
| |
|
2023 |
|
|
2022 |
|
| Revenue, Net |
|
|
|
|
|
|
|
|
| Tool Rental |
|
$ |
29,361 |
|
|
$ |
26,837 |
|
| Product Sale |
|
|
8,777 |
|
|
|
9,710 |
|
|
|
|
|
|
|
|
|
|
| Total Revenue, Net |
|
|
38,138 |
|
|
|
36,547 |
|
| Operating Costs and Expenses |
|
|
|
|
|
|
|
|
| Costs of Tool Rental Revenue |
|
|
7,956 |
|
|
|
7,586 |
|
| Costs of Product Sale Revenue |
|
|
1,195 |
|
|
|
1,372 |
|
| Selling, General and Administrative Expense |
|
|
16,552 |
|
|
|
14,692 |
|
| Depreciation and Amortization Expense |
|
|
5,303 |
|
|
|
4,820 |
|
|
|
|
|
|
|
|
|
|
| Total Operating Costs and Expenses |
|
|
31,006 |
|
|
|
28,470 |
|
|
|
|
|
|
|
|
|
|
| Income from Operations |
|
|
7,132 |
|
|
|
8,077 |
|
| Other (Expense) Income |
|
|
|
|
|
|
|
|
| Interest Expense, Net |
|
|
(73 |
) |
|
|
(45 |
) |
| Gain on Sale of Property |
|
|
— |
|
|
|
102 |
|
| Unrealized Loss on Equity Securities |
|
|
(535 |
) |
|
|
(398 |
) |
| Other Expense, Net |
|
|
(135 |
) |
|
|
(114 |
) |
|
|
|
|
|
|
|
|
|
| Total Other Expense, Net |
|
|
(743 |
) |
|
|
(455 |
) |
|
|
|
|
|
|
|
|
|
| Income Before Income Tax Expense |
|
|
6,389 |
|
|
|
7,622 |
|
| Income Tax Expense |
|
|
(2,102 |
) |
|
|
(626 |
) |
|
|
|
|
|
|
|
|
|
| Net Income |
|
$ |
4,287 |
|
|
$ |
6,996 |
|
| Accumulated Dividends on Redeemable Convertible Preferred Stock |
|
|
— |
|
|
|
294 |
|
|
|
|
|
|
|
|
|
|
| Net Income Available to Common Shareholders |
|
$ |
4,287 |
|
|
$ |
6,702 |
|
|
|
|
|
|
|
|
|
|
| Basic earnings per share |
|
$ |
0.14 |
|
|
$ |
0.56 |
|
|
|
|
|
|
|
|
|
|
| Diluted earnings per share |
|
$ |
0.14 |
|
|
$ |
0.36 |
|
|
|
|
|
|
|
|
|
|
| Basic weighted-average common shares outstanding |
|
|
29,768,568 |
|
|
|
11,951,137 |
|
| Diluted weighted-average common shares outstanding |
|
|
30,043,546 |
|
|
|
19,677,507 |
|
| Comprehensive income |
|
|
|
|
|
|
|
|
| Net Income |
|
$ |
4,287 |
|
|
$ |
6,996 |
|
| Foreign Currency Translation Adjustment, Net of Tax |
|
|
90 |
|
|
|
(24 |
) |
|
|
|
|
|
|
|
|
|
| Net Comprehensive Income |
|
$ |
4,377 |
|
|
$ |
6,972 |
|
|
|
|
|
|
|
|
|
|
Drilling Tools International Corporation
Unaudited Condensed Consolidated Statement of Operations and Comprehensive Income
(in thousands, except share data)
|
|
|
|
|
|
|
|
|
| |
|
Nine Months Ended September 30, |
|
| |
|
2023 |
|
|
2022 |
|
| Revenue, Net |
|
|
|
|
|
|
|
|
| Tool Rental |
|
$ |
90,639 |
|
|
$ |
70,277 |
|
| Product Sale |
|
|
26,206 |
|
|
|
22,619 |
|
|
|
|
|
|
|
|
|
|
| Total Revenue, Net |
|
|
116,845 |
|
|
|
92,896 |
|
| Operating Costs and Expenses |
|
|
|
|
|
|
|
|
| Costs of Tool Rental Revenue |
|
|
23,785 |
|
|
|
20,578 |
|
| Costs of Product Sale Revenue |
|
|
3,655 |
|
|
|
3,785 |
|
| Selling, General and Administrative Expense |
|
|
50,999 |
|
|
|
36,424 |
|
| Depreciation and Amortization Expense |
|
|
15,035 |
|
|
|
14,782 |
|
|
|
|
|
|
|
|
|
|
| Total Operating Costs and Expenses |
|
|
93,474 |
|
|
|
75,569 |
|
|
|
|
|
|
|
|
|
|
| Income from Operations |
|
|
23,371 |
|
|
|
17,327 |
|
| Other (Expense) Income |
|
|
|
|
|
|
|
|
| Interest Expense, Net |
|
|
(995 |
) |
|
|
(41 |
) |
| Gain on Sale of Property |
|
|
68 |
|
|
|
107 |
|
| Unrealized Loss on Equity Securities |
|
|
(148 |
) |
|
|
(75 |
) |
| Other Expense, Net |
|
|
(6,170 |
) |
|
|
(209 |
) |
|
|
|
|
|
|
|
|
|
| Total Other Expense, Net |
|
|
(7,245 |
) |
|
|
(218 |
) |
|
|
|
|
|
|
|
|
|
| Income Before Income Tax Expense |
|
|
16,126 |
|
|
|
17,109 |
|
| Income Tax Expense |
|
|
(5,201 |
) |
|
|
(2,846 |
) |
|
|
|
|
|
|
|
|
|
| Net Income |
|
$ |
10,925 |
|
|
$ |
14,263 |
|
| Accumulated Dividends on Redeemable Convertible Preferred Stock |
|
|
314 |
|
|
|
883 |
|
|
|
|
|
|
|
|
|
|
| Net Income Available to Common Shareholders |
|
$ |
10,611 |
|
|
$ |
13,380 |
|
|
|
|
|
|
|
|
|
|
| Basic earnings per share |
|
$ |
0.57 |
|
|
$ |
1.12 |
|
|
|
|
|
|
|
|
|
|
| Diluted earnings per share |
|
$ |
0.46 |
|
|
$ |
0.72 |
|
|
|
|
|
|
|
|
|
|
| Basic weighted-average common shares outstanding |
|
|
18,608,708 |
|
|
|
11,951,137 |
|
| Diluted weighted-average common shares outstanding |
|
|
23,554,593 |
|
|
|
19,677,507 |
|
| Comprehensive income |
|
|
|
|
|
|
|
|
| Net Income |
|
$ |
10,925 |
|
|
$ |
14,263 |
|
| Foreign Currency Translation Adjustment, Net of Tax |
|
|
(117 |
) |
|
|
(86 |
) |
|
|
|
|
|
|
|
|
|
| Net Comprehensive Income |
|
$ |
10,808 |
|
|
$ |
14,177 |
|
|
|
|
|
|
|
|
|
|
Drilling Tools International Corporation
Unaudited Condensed Consolidated Statement of Cash Flows
(In thousands)
|
|
|
|
|
|
|
|
|
| |
|
Nine Months Ended September 30, |
|
| |
|
2023 |
|
|
2022 |
|
| Cash Flows from Operating Activities |
|
|
|
|
|
|
|
|
| Net Income |
|
$ |
10,925 |
|
|
$ |
14,263 |
|
| Adjustments to Reconcile Net Income to Net Cash from Operating Activities: |
|
|
|
|
|
|
|
|
| Depreciation and Amortization |
|
|
15,035 |
|
|
|
14,782 |
|
| Amortization of Deferred Financing Costs |
|
|
88 |
|
|
|
74 |
|
| Amortization of Debt Discount |
|
|
— |
|
|
|
52 |
|
| Non-Cash Lease Expense |
|
|
3,418 |
|
|
|
3,087 |
|
| Provision for Excess and Obsolete Inventory |
|
|
22 |
|
|
|
29 |
|
| Provision for Excess and Obsolete Property and Equipment |
|
|
381 |
|
|
|
400 |
|
| Bad Debt Expense |
|
|
502 |
|
|
|
223 |
|
| Deferred Tax Expense |
|
|
3,741 |
|
|
|
697 |
|
| Gain on Property Sale |
|
|
(68 |
) |
|
|
(107 |
) |
| Unrealized Loss on Equity Securities |
|
|
148 |
|
|
|
75 |
|
| Unrealized Gain on Interest Rate Swap |
|
|
— |
|
|
|
(1,373 |
) |
| Realized Loss on Interest Rate Swap |
|
|
4 |
|
|
|
— |
|
| Gross Profit from Sale of
Lost-in-Hole Equipment |
|
|
(13,968 |
) |
|
|
(12,595 |
) |
| Stock-Based Compensation Expense |
|
|
3,986 |
|
|
|
— |
|
| Changes in Assets and Liabilities |
|
|
|
|
|
|
|
|
| Accounts Receivable, Net |
|
|
(577 |
) |
|
|
(8,531 |
) |
| Prepaid Expenses and Other Current Assets |
|
|
(92 |
) |
|
|
(5,456 |
) |
| Inventories, Net |
|
|
(2,876 |
) |
|
|
(261 |
) |
| Operating Lease Liabilities |
|
|
(3,311 |
) |
|
|
(3,100 |
) |
| Accounts Payable |
|
|
(888 |
) |
|
|
(2,046 |
) |
| Accrued Expenses and Other Currently Liabilities |
|
|
1,014 |
|
|
|
5,428 |
|
|
|
|
|
|
|
|
|
|
| Net Cash Flows from Operating Activities |
|
|
17,484 |
|
|
|
5,641 |
|
|
|
|
|
|
|
|
|
|
| Cash Flows From Investing Activities |
|
|
|
|
|
|
|
|
| Proceeds From Sale of Property and Equipment |
|
|
126 |
|
|
|
1,021 |
|
| Purchase of Property, Plant & Equipment |
|
|
(36,776 |
) |
|
|
(16,235 |
) |
| Proceeds from Sale of
Lost-in-Hole Equipment |
|
|
16,623 |
|
|
|
16,287 |
|
|
|
|
|
|
|
|
|
|
| Net Cash Flows From Investing Activities |
|
|
(20,027 |
) |
|
|
1,073 |
|
|
|
|
|
|
|
|
|
|
| Cash Flows From Financing Activities |
|
|
|
|
|
|
|
|
| Proceeds from Merger and PIPE Financing, Net of Transaction Costs |
|
|
23,162 |
|
|
|
— |
|
| Payment of Deferred Financing Costs |
|
|
(322 |
) |
|
|
(149 |
) |
| Proceeds from Revolving Line of Credit |
|
|
71,646 |
|
|
|
76,471 |
|
| Payments on Revolving Line of Credit |
|
|
(89,995 |
) |
|
|
(82,239 |
) |
| Payments on Finance Leases |
|
|
— |
|
|
|
(10 |
) |
| Payments to holders of DTIH redeemable convertible preferred stock in connection with retiring
their DTIH stock upon the Merger |
|
|
(194 |
) |
|
|
— |
|
|
|
|
|
|
|
|
|
|
| Net Cash Flows From Financing Activities |
|
|
4,297 |
|
|
|
(5,927 |
) |
|
|
|
|
|
|
|
|
|
| Effect of Changes in Foreign Exchange Rates |
|
|
(117 |
) |
|
|
(86 |
) |
| Net Change in Cash |
|
|
1,637 |
|
|
|
701 |
|
| Cash at Beginning of Period |
|
|
2,352 |
|
|
|
52 |
|
|
|
|
|
|
|
|
|
|
| Cash at End of Period |
|
$ |
3,989 |
|
|
$ |
753 |
|
|
|
|
|
|
|
|
|
|
Drilling Tools International Corporation
Unaudited Condensed Consolidated Statement of Cash Flows
(In thousands)
|
|
|
|
|
|
|
|
|
| |
|
Nine Months Ended September 30, |
|
| |
|
2023 |
|
|
2022 |
|
| Supplemental cash flow information: |
|
|
|
|
|
|
|
|
| Cash paid for interest |
|
$ |
901 |
|
|
$ |
884 |
|
|
|
|
|
|
|
|
|
|
| Cash paid for income taxes |
|
$ |
2,546 |
|
|
$ |
1,925 |
|
|
|
|
|
|
|
|
|
|
| Non-cash investing and financing
activities: |
|
|
|
|
|
|
|
|
| ROU assets obtained in exchange for lease liabilities |
|
$ |
3,002 |
|
|
$ |
5,246 |
|
|
|
|
|
|
|
|
|
|
| Purchases of inventory included in accounts payable and accrued expenses and other current
liabilities |
|
$ |
451 |
|
|
$ |
1,776 |
|
|
|
|
|
|
|
|
|
|
| Purchases of property and equipment included in accounts payable and accrued expenses and other
current liabilities |
|
$ |
1,733 |
|
|
$ |
1,459 |
|
|
|
|
|
|
|
|
|
|
| Non-cash Directors and Officers insurance |
|
$ |
1,063 |
|
|
$ |
— |
|
|
|
|
|
|
|
|
|
|
| Non-cash Merger financing |
|
$ |
2,000 |
|
|
$ |
— |
|
|
|
|
|
|
|
|
|
|
| Exchange of DTIH redeemable convertible preferred stock for DTIC common stock in connection with
Merger |
|
$ |
7,193 |
|
|
$ |
— |
|
|
|
|
|
|
|
|
|
|
| Issuance of DTIC common stock to former holders of DTIH redeemable convertible preferred stock in
connection with Exchange Agreements |
|
$ |
10,805 |
|
|
$ |
— |
|
|
|
|
|
|
|
|
|
|
| Deferred financing fees included in accounts payable |
|
$ |
— |
|
|
$ |
69 |
|
|
|
|
|
|
|
|
|
|
| Accretion of redeemable convertible preferred stock to redemption value |
|
$ |
314 |
|
|
$ |
883 |
|
|
|
|
|
|
|
|
|
|
Use of Non-GAAP Financial Measures
To supplement its unaudited interim consolidated financial statements, which are prepared and presented in accordance with GAAP, the Company uses certain non-GAAP financial measures to understand and evaluate its core operating performance. These non-GAAP financial measures, which may be different than similarly titled measures
used by other companies, are presented to enhance investors’ overall understanding of the Company’s financial performance and should not be considered a substitute for, or superior to, the financial information prepared and presented in
accordance with GAAP.
The Company uses the non-GAAP financial measure Adjusted EBITDA, which is defined as net
income (loss), excluding interest income; interest expense; other income (expense), net; income tax benefit (expense); depreciation and amortization; and certain other non-cash or non-recurring items impacting net income (loss) from time to time. The Company believes that Adjusted EBITDA helps identify underlying trends in its business that could otherwise be masked by the effect of the
expenses that the Company excludes in Adjusted EBITDA.
The Company uses the non-GAAP financial measure Adjusted
Free Cash Flow, which is defined as Adjusted EBITDA, reduced by gross capital expenditures. The Company believes Adjusted Free Cash Flow is an important liquidity measure of the cash that is available, after capital expenditures, for operational
expenses and investment in its business and is a key financial indicator used by management. Adjusted Free Cash Flow is useful to investors as a liquidity measure because it measures the Company’s ability to generate or use cash. Once the
Company’s business needs and obligations are met, cash can be used to maintain a strong balance sheet and invest in future growth.
These non-GAAP financial measures should not be considered in isolation from, or as substitutes for, financial information prepared in accordance with GAAP. There are a number of limitations related to the use of these non-GAAP financial measures compared to the closest comparable GAAP measure. Some of these limitations are that:
| |
• |
|
Adjusted EBITDA excludes certain recurring, non-cash charges such as
depreciation of fixed assets and amortization of acquired intangible assets and, although these are non-cash charges, the assets being depreciated and amortized may have to be replaced in the future;
|
| |
• |
|
Adjusted EBITDA excludes income tax benefit (expense); and |
Adjusted Free Cash Flow does not reflect the Company’s future contractual commitments.
Reconciliations of Non-GAAP Financial Measures
The following tables present a reconciliation of Net Income (Loss) to Adjusted EBITDA for the three and nine months ended September 30, 2023 and 2022 (non-recurring transaction expenses recorded to other (income) expense are presented separately within Adjusted EBITDA):
Drilling Tools International Corporation
Reconciliation of GAAP to Non-GAAP Measures (Unaudited)
(In thousands)
|
|
|
|
|
|
|
|
|
| |
|
Three Months Ended September 30, |
|
| |
|
2023 |
|
|
2022 |
|
| Net Income |
|
$ |
4,287 |
|
|
$ |
6,996 |
|
| Add (deduct) |
|
|
|
|
|
|
|
|
| Income tax expense |
|
|
2,102 |
|
|
|
626 |
|
| Depreciation and Amortization |
|
|
5,303 |
|
|
|
4,820 |
|
| Interest expense, net |
|
|
73 |
|
|
|
45 |
|
| Stock option expense |
|
|
— |
|
|
|
— |
|
| Monitoring fees |
|
|
295 |
|
|
|
123 |
|
| Gain on sale of property |
|
|
— |
|
|
|
(102 |
) |
| Unrealized (gain) loss on equity securities |
|
|
535 |
|
|
|
398 |
|
| Transaction expense |
|
|
124 |
|
|
|
— |
|
| ERC credit received |
|
|
— |
|
|
|
— |
|
| Other expense, net |
|
|
10 |
|
|
|
114 |
|
|
|
|
|
|
|
|
|
|
| Adjusted EBITDA |
|
$ |
12,729 |
|
|
$ |
13,020 |
|
|
|
|
|
|
|
|
|
|
Drilling Tools International Corporation
Reconciliation of GAAP to Non-GAAP Measures (Unaudited)
(In thousands)
|
|
|
|
|
|
|
|
|
| |
|
Nine Months Ended September 30, |
|
| |
|
2023 |
|
|
2022 |
|
| Net Income |
|
$ |
10,925 |
|
|
$ |
14,263 |
|
| Add (deduct) |
|
|
|
|
|
|
|
|
| Income tax expense |
|
|
5,201 |
|
|
|
2,846 |
|
| Depreciation and Amortization |
|
|
15,035 |
|
|
|
14,782 |
|
| Interest expense, net |
|
|
995 |
|
|
|
41 |
|
| Stock option expense |
|
|
1,661 |
|
|
|
— |
|
| Monitoring fees |
|
|
773 |
|
|
|
294 |
|
| Gain on sale of property |
|
|
(68 |
) |
|
|
(107 |
) |
| Unrealized (gain) loss on equity securities |
|
|
148 |
|
|
|
75 |
|
| Transaction expense |
|
|
5,963 |
|
|
|
— |
|
| ERC credit received |
|
|
— |
|
|
|
(4,272 |
) |
| Other expense, net |
|
|
207 |
|
|
|
209 |
|
|
|
|
|
|
|
|
|
|
| Adjusted EBITDA |
|
$ |
40,840 |
|
|
$ |
28,131 |
|
|
|
|
|
|
|
|
|
|
The following table presents a reconciliation of full year 2023 Estimated Net Income (Loss) to Estimated
Adjusted EBITDA:
Drilling Tools International Corporation
Reconciliation of GAAP to Non-GAAP Measures (Unaudited)
(In thousands)
|
|
|
|
|
| |
|
2023E |
|
| Net Income |
|
$ |
11,576 - 18,976 |
|
| Add (deduct) |
|
|
|
|
| Interest expense, net |
|
|
500 - 1,300 |
|
| Income tax expense |
|
|
6,500 - 7,000 |
|
| Depreciation and amortization |
|
|
19,900 - 21,000 |
|
| Monitoring fees |
|
|
500 - 1,000 |
|
| Other expense |
|
|
0 - 500 |
|
| Stock option expense |
|
|
1,661 |
|
| Transaction expense |
|
|
5,963 |
|
|
|
|
|
|
| Adjusted EBITDA |
|
$ |
50,000 - 54,000 |
|
|
|
|
|
|
The following table presents a reconciliation of full year 2023 Estimated Net Income (Loss) to Estimated Adjusted Free Cash
Flow:
Drilling Tools International Corporation
Reconciliation of GAAP to Non-GAAP Measures (Unaudited)
(In thousands)
|
|
|
|
|
| |
|
2023E |
|
| Net Income |
|
$ |
11,576 - 18,976 |
|
| Add (deduct) |
|
|
|
|
| Interest expense, net |
|
|
500 - 1,300 |
|
| Income tax expense |
|
|
6,500 - 7,000 |
|
| Depreciation and amortization |
|
|
19,900 - 21,000 |
|
| Monitoring fees |
|
|
500 - 1,000 |
|
| Other expense |
|
|
0 - 500 |
|
| Stock option expense |
|
|
1,661 |
|
| Transaction expense |
|
|
5,963 |
|
| Gross capital expenditures |
|
|
(44,000) - (46,000) |
|
|
|
|
|
|
| Adjusted Free Cash Flow |
|
$ |
6,000 - 8,000 |
|
|
|
|
|
|
Source: Drilling Tools International Corp.
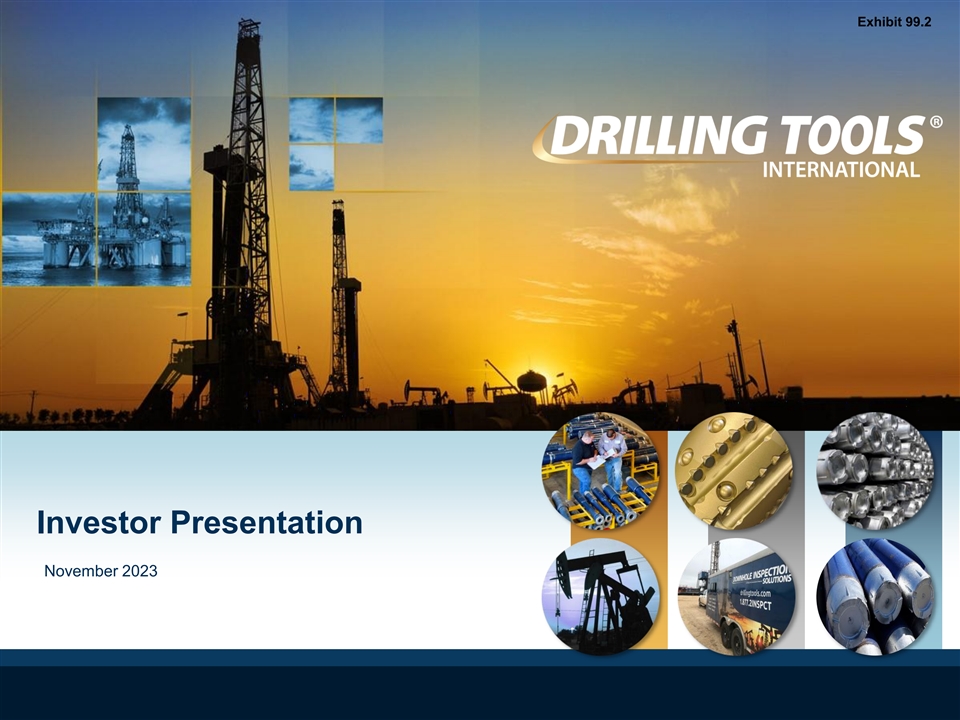
Exhibit 99.2 Investor Presentation November 2023

Disclaimers General: Drilling Tools International Corporation
(“DTI”) is making this presentation available in connection with the release of its financial results for the three and nine months ended September 30, 2023. The information contained in this presentation does not purport to be
all-inclusive or to contain all information that prospective investors may require. Prospective investors are encouraged to conduct their own analysis and review of information contained in this presentation as well as important additional
information through the Securities and Exchange Commission’s (“SEC”) EDGAR system at www.sec.gov and on our website at www.drillingtools.com. Forward-Looking Statements: This presentation and the oral statements made in connection
herewith include “forward-looking statements” within the meaning of the “safe harbor” provisions of the Private Securities Litigation Reform Act of 1995. DTI’s actual results may differ from its expectations, estimates
and projections, and, consequently, you should not rely on these forward-looking statements as predictions of future events. The words “anticipate,” “believe,” “continue,” “could,”
“estimate,” “expect,” “intends,” “may,” “might,” “plan,” “possible,” “potential,” “predict,” “project,” “should,”
“will,” “would” and similar expressions may identify forward-looking statements, but the absence of these words does not mean that a statement is not forward looking. These forward- looking statements include, but are not
limited to, statements regarding DTI and its management team’s expectations, hopes, beliefs, intentions or strategies regarding the future. In addition, any statements that refer to projections, forecasts or other characterizations of future
events or circumstances, including any underlying assumptions, are forward-looking statements. Forward-looking statements in this presentation may include, for example, statements about: (1) the demand for DTI’s products and services, which is
influenced by the general level activity in the oil and gas industry; (2) DTI’s ability to retain its customers, particularly those that contribute to a large portion of its revenue; (3) DTI’s ability to remain the sole North American
distributor of the Drill-N-Ream; (4) DTI’s ability to employ and retain a sufficient number of skilled and qualified workers, including its key personnel; (5) DTI’s ability to market its services in a competitive industry; (9)
DTI’s ability to execute, integrate and realize the benefits of acquisitions, and manage the resulting growth of its business; (6) potential liability for claims arising from damage or harm caused by the operation of DTI’s tools, or
otherwise arising from the dangerous activities that are inherent in the oil and gas industry; (7) DTI’s ability to obtain additional capital; (8) potential political, regulatory, economic and social disruptions in the countries in which DTI
conducts business, including changes in tax laws or tax rates; (9) DTI’s dependence on its information technology systems, in particular Customer Order Management Portal and Support System, for the efficient operation of DTI’s business;
(10) DTI’s ability to comply with applicable laws, regulations and rules, including those related to the environment, greenhouse gases and climate change; (11) DTI’s ability to maintain an effective system of disclosure controls and
internal control over financial reporting; (12) the potential for volatility in the market price of DTI’s common stock; (13) the impact of increased legal, accounting, administrative and other costs incurred as a public company, including the
impact of possible shareholder litigation; (14) the potential for issuance of additional shares of DTI’s common stock or other equity securities; (15) DTI’s ability to maintain the listing of its common stock on Nasdaq; and (16) other
risks and uncertainties separately provided to you and indicated from time to time described in filings and potential filings by DTI with the SEC. These forward looking statements are based on DTI’s management's current expectations and
assumptions about future events and are based on currently available information as to the outcome and timing of future events. DTI cautions that the foregoing list of factors is not exclusive and not to place undue reliance upon any forward-looking
statements, including projections, which speak only as of the date made. You should also carefully consider the risks and uncertainties described in “Risk Factors” in the Appendix to this presentation, as well as the “Risk
Factors” section of DTI’s proxy statement/prospectus/consent solicitation statement filed on May 12, 2023, and the information presented in DTI’s current report on Form 8-K filed June 27, 2023, the quarterly report on Form 10-Q
filed August 14, 2023 and in subsequent quarterly reports on Form 10-Q filed with the SEC. These filings or potential filings may identify and address other important risks and uncertainties that could cause actual events and results to differ
materially from those contained in the forward-looking statements referred hereto. DTI undertakes no obligation to and accepts no obligation to release publicly any updates or revisions to any forward-looking statements or to reflect any change in
its expectations or any change in events, conditions or circumstances on which any such statement is based, except as required by law. Industry, Market Data and Partnerships: In this presentation, DTI relies on and refers to certain information and
statistics regarding the markets and industries in which DTI competes. Such information and statistics are based on management’s estimates and/or obtained from third-party sources, including reports by market research firms and company
filings. While DTI believes such third-party information is reliable, there can be no assurance as to the accuracy or completeness of the indicated information. DTI has not independently verified the accuracy or completeness of the information
provided by the third-party sources. This presentation contains descriptions of certain key business partnerships of DTI. These descriptions are based on DTI’s management team’s discussion with such counterparties, certain non-binding
written agreements and the latest available information and estimates as of the date of this presentation. Use of Projections: This presentation contains projected financial information with respect to DTI. Such projected financial information
constitutes forward-looking information, is for illustrative purposes only and should not be relied upon as necessarily being indicative of future results. Further, illustrative presentations are not necessarily based on management’s
projections, estimates, expectations or targets but are presented for illustrative purposes only. DTI’s independent auditors have not audited, reviewed, compiled or performed any procedures with respect to the projections for the purpose of
their inclusion in this presentation, and, accordingly, they did not express an opinion or provide any other form of assurance with respect thereto for the purpose of this presentation. The assumptions and estimates underlying such financial
forecast information are inherently uncertain and are subject to a wide variety of significant business, economic, competitive and other risks and uncertainties. See “Forward-Looking Statements” above. Actual results may differ
materially from the results contemplated by the financial forecast information contained in this presentation, and the inclusion of such information in this presentation is not intended, and should not be regarded, as a representation by any person
that the results reflected in such forecasts will be achieved. Further, the metrics referenced in this presentation regarding select aspects of DTI’s operations were selected by DTI on a subjective basis. Such metrics are provided solely for
illustrative purposes to demonstrate elements of DTI’s business, are incomplete and are not necessarily indicative of DTI’s performance or future performance or overall operations. There can be no assurance that historical trends will
continue. Any investment in DTI’s common stock entails a high degree of risk. No assurance can be given that investors will receive a return on their capital, and investors could lose part or all of their investment. Non-GAAP Financial
Measures: This presentation includes certain financial measures not presented in accordance with generally accepted accounting principles (“GAAP”), including, but not limited to: Adjusted EBITDA, Adjusted Free Cash Flow, and certain
ratios and other metrics derived therefrom. Note that other companies may calculate these non-GAAP financial measures differently, and, therefore, such financial measures may not be directly comparable to similarly titled measures of other
companies. Further, these non-GAAP financial measures are not measures of financial performance in accordance with GAAP and may exclude items that are significant in understanding and assessing DTI’s financial results. Therefore, these
measures should not be considered in isolation or as an alternative to net income (loss), net cash (used in) provided by operating activities or other measures of profitability, liquidity or performance under GAAP. You should be aware that
DTI’s presentation of these measures may not be comparable to similarly titled measures used by other companies. DTI believes these non-GAAP measures provide useful information to management and investors regarding certain financial and
business trends relating to DTI’s results of operations. DTI believes that the use of these non-GAAP financial measures provides an additional tool for investors to use in evaluating ongoing operating results and trends in DTI, and in
comparing DTI’s financial measures with those of other similar companies, many of which present similar non-GAAP financial measures to investors. These non-GAAP financial measures are subject to inherent limitations as they reflect the
exercise of judgment by management about which items of expense and income are excluded or included in determining these non-GAAP financial measures. Please refer to footnotes where presented on each page of this presentation or to the tables herein
for a reconciliation of these measures to what DTI believes are the most directly comparable measure evaluated in accordance with GAAP. Reconciliation of historical non-GAAP measures to comparable GAAP measures are provided in the Appendix. This
presentation also includes certain projections of non-GAAP financial measures. Reconciliation of these items to net income include gains or losses on sale or consolidation transactions, accelerated depreciation, impairment charges, gains or losses
on retirement of debt, variations in effective tax rate and fluctuations in net working capital, which are difficult to predict and estimate and are primarily dependent on future events. 1

Disclaimers (Cont’d) Rounding: Certain monetary amounts,
percentages and other figures included in this presentation have been subject to rounding adjustments. Certain other amounts that appear in this presentation may not sum due to rounding. Trademarks: This presentation contains trademarks, service
marks, trade names and copyrights of DTI and other companies, which are the property of their respective owners. Solely for convenience, some of the trademarks, service marks, trade names and copyrights referred to in this presentation may be listed
without the TM, SM, © or ® symbols, but DTI will assert, to the fullest extent under applicable law, the rights of the applicable owners, if any, to these trademarks, service marks, trade names and copyrights. Further, third-party logos
included in this presentation may represent past or present vendors or suppliers of materials and/or products to DTI for use in connection with its business or may be provided simply for illustrative purposes only. Inclusion of such logos does not
necessarily imply affiliation with or endorsement by such firms or businesses. There is no guarantee that DTI will work, or continue to work, with any of the firms or businesses whose logos are included herein in the future. 2

Table of Contents Business Overview 4 Financial Overview and Growth
Opportunities 26 Appendix 30 Recent Milestones 35 3

Business & Market Overview 4

Significant Industry Tailwinds & Supportive Macro Backdrop A
combination of elevated commodity prices, increased rig count and capital spending creates a highly constructive market backdrop (1) (2) Historical Rig Count Historical Commodity Pricing (3) (4) Historical Feet Drilled E&P Capital Spending
Global United States $600 $300 $500 $250 $400 $200 $300 $150 $200 $100 $100 $50 $- $- 2020 2021 2022 2023E 1) Baker Hughes; 2) Energy Information Association; 3) Spears Directional Drilling Market Report – Q3 2023. Only includes number of feet
drilled through reservoir rock, excludes vertical part of well; 5 4) Evercore ISI Global E&P Mid-Year Spending Outlook Global Capital Spending ($ Bn) United States Capital Spending ($ Bn)
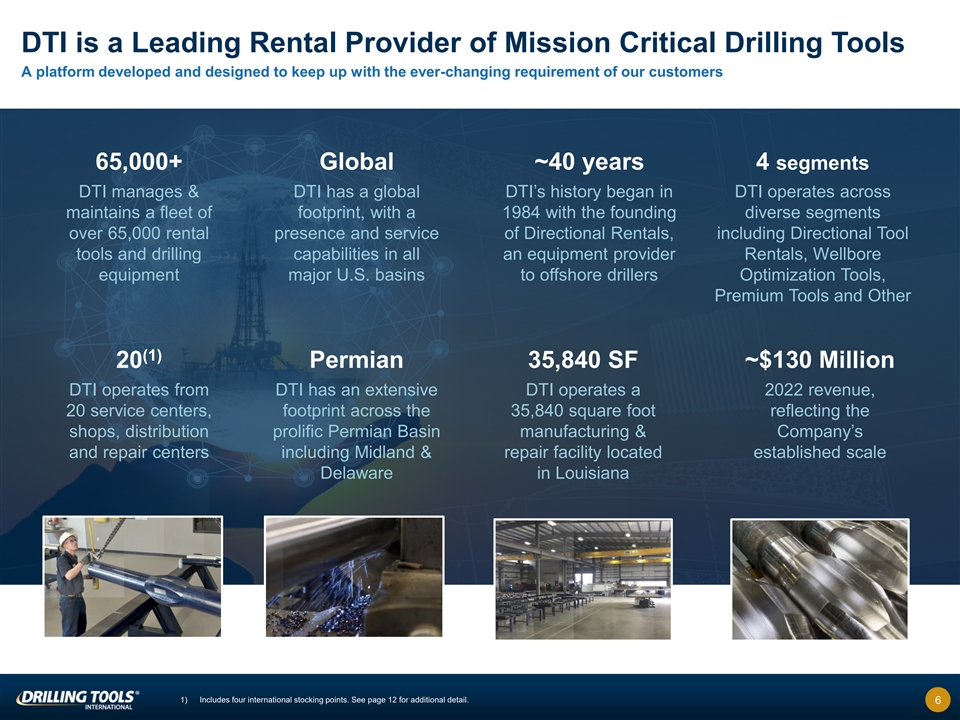
DTI is a Leading Rental Provider of Mission Critical Drilling Tools A
platform developed and designed to keep up with the ever-changing requirement of our customers 65,000+ Global ~40 years 4 segments DTI manages & DTI has a global DTI’s history began in DTI operates across maintains a fleet of footprint,
with a 1984 with the founding diverse segments over 65,000 rental presence and service of Directional Rentals, including Directional Tool tools and drilling capabilities in all an equipment provider Rentals, Wellbore equipment major U.S. basins to
offshore drillers Optimization Tools, Premium Tools and Other (1) 20 Permian 35,840 SF ~$130 Million DTI operates from DTI has an extensive DTI operates a 2022 revenue, 20 service centers, footprint across the 35,840 square foot reflecting the
shops, distribution prolific Permian Basin manufacturing & Company’s and repair centers including Midland & repair facility located established scale Delaware in Louisiana 1) Includes four international stocking points. See page 12 for
additional detail. 6

The Rental Tool Business & DTI’s Value Proposition Why do
E&P operators and some service providers prefer to rent rather than buy? Given the complexity of modern drilling, completions and workover programs, most drillers and service providers prefer to focus on core competencies and rely on
third-parties for the rental, repair, inspection and inventory management of downhole drilling tools Customer Challenges DTI’s Value-Additive Solutions Topic DTI has the resources to make renting downhole tools a Outsources Customers lack the
willingness, resources and/or experience reliable and economical choice for customers including a Logistics, to track, transport, store, maintain and inspect tubing, drill large physical infrastructure, proprietary inventory Inspection, Storage pipe
and other equipment management system, as well as needed inspection, repair, and Maintenance and hardfacing to support the fleet of rental equipment Eliminates By serving a broad customer base, DTI can efficiently Inefficient to own comprehensive
fleet of expensive Equipment deploy specialized equipment across major U.S. oil & gas equipment specifically designed for formations / regions regions Redeployment Risk Immediate DTI owns a wide variety of equipment available for use Modern well
designs require highly specialized equipment 24/7, along with extensive machining capabilities to rapidly Equipment that is not typically carried on drilling or workover rigs meet customer needs Availability DTI’s inventory includes equipment
required for extended Fill Many drillers and well service providers maintain only a reach laterals as well as a range of specialty or premium Equipment small core set of tubing and drill pipe products that are needed to withstand the rigors of deep
Supply Gaps unconventional wells Focus Capex DTI’s rental equipment allows operators to focus capex Industry shift towards lean capital programs investment on core businesses On Core Operations Simplifies Working DTI as a service provider
eliminates the need for an E&P The perception of excessive charges can lead to disputes Interest Partner operator to charge working interest partners a substantial among working interest partners fee for the purchase of equipment Expense
Allocation 7

Expansive Offering to Supply Drilling Tools Required in a Typical Job
Diverse and extensive inventory of tools to address the wide-ranging needs of oil & gas customers across all regions Blow Out Preventer Represents Key DTI Rental Product Crossover Subs Hevi-Wate Drill Pipe Drill Pipe Non-Magnetic Collar TM
Drill-N-Ream TM Spiral Drill Collar RotoSteer Stabilizer Bit Sub 8

A Market Leader in Downhole Tools for the Oil & Gas Industry
Leading provider of downhole drilling equipment rentals to North American onshore and offshore markets, as well as select international locations, with a highly competitive suite of differentiated products serving blue-chip E&P operators and
large oilfield service companies Core Product and Service Offering Directional Tool Rentals (“DTR”) Wellbore Optimization Tools Premium Tools (“Premium”) Other Products & Services (1) 60% of 2022 Revenue 20% of 2022
Revenue 18% of 2022 Revenue 2% of 2022 Revenue ⚫ Rental tools used in bottom ⚫ Sole North American distributor ⚫ Complete inventory of ⚫ Downhole Inspection Solutions TM hole assemblies (“BHA”) of the patented
Drill-N-Ream , necessary handling tools for offers inspection services and adjacent to the drill bit a proprietary and patented running workstrings provides technical support for wellbore conditioning tool tool life analysis and BHA ⚫ More
than 30 categories of ⚫ Offers tubulars for drilling, component development tools, including:⚫ Distributor of specialty roller workover and completion reamers operations including:⚫ Technical Services Group — Stabilizers
provides engineering, research ⚫ Emerging products include — Drill Pipe — Drill Collars and product development TM TM RotoSteer and SafeFloat — Drill Collars — Roller Reamers Float Valve for Managed ⚫ Product
Sales — Kellys Pressure Drilling — Hole Openers — Downhole Tools — Pup Joints — Downhole Filters — Completion and Production — Tubing Tools — Sub Assemblies ⚫ American Petroleum Institute ⚫
Emerging Product Launch — Drilling Accessories (“API”) blowout preventers Team incubates new tools and (“BOPs”) and related pressure businesses before they reach control accessories critical scale Source: Company
financials and management estimates. 9 1) Net of eliminations.

How Did We Get There? DTI Has a Long History of Success DTI’s
history began in 1984 when it was founded as Directional Rentals to provide equipment to offshore drillers ⚫ In 2012, Hicks Energy Partners acquired a majority interest in Directional Rentals before merging with Allegiant Tool & Machine to
become DTI ⚫ Since then, DTI has focused on strategically acquiring inventory and business units to become a leader in drilling tool rentals in North America 1984 2009 2013 2016 2018 2022 ⚫ Acquired: ⚫ Founded as ⚫ Opened
Houston, ⚫ Acquired ⚫ Substantially ⚫ Established Directional Rentals TX and Casper, Schlumberger’s increased market exclusive —Premium Tools WY offices downhole tools share in North partnership for ⚫ Primarily
rented —RIK, Incorporated TM inventory America RotoSteer stabilizers and sub-⚫ Mike Domino joined —Stinger assemblies to the management ⚫ Wayne Prejean ⚫ Established ⚫ ~65,000 tools Production Valve offshore
directional team and David Johnson partnership with ⚫ Sustains market —Friction Reduction drillers in the Gulf joined manufacturer of leading position Tools of Mexico (“GoM”) management team patented Drill-N- ⚫ Domestic
locations: TM —Cajun Plugs, a as CEO and CFO, Ream tool 18 (including dissolvable frac respectively headquarters) plug 1984 Today 1991 2012 2014 2017 2019 2023 TM ⚫ Expanded offering ⚫ Hicks acquired ⚫ Acquired Reamco,
⚫ Drill-N-Ream⚫ Achieved over 50% ⚫ After a successful to include non- majority interest in adding offshore average monthly market share in transaction with magnetic drill DTI tools and tool revenues exceed $1 North America in ROC
Energy collars and sub- repair capabilities million DTR segment Acquisition Corp., —~5,000 tools assemblies DTI became a ⚫ Rebranded as ⚫ Launched Downhole ⚫ Developed —Locations: 4 publicly traded Drilling Tools
Inspection Solutions Customer Order ⚫ Purchased NOV company on June International, Inc. Management Portal ⚫ Achieved leading tools, significantly st 21 2023 under the and Support ⚫ Established Quality market share in increasing
scale and ticker NASDAQ: System Assurance team offshore GoM, capabilities DTI (“COMPASS”) for and began API growing from 1 rig in customized rental certification 2013 to 12 rigs in tool management process 2017 10
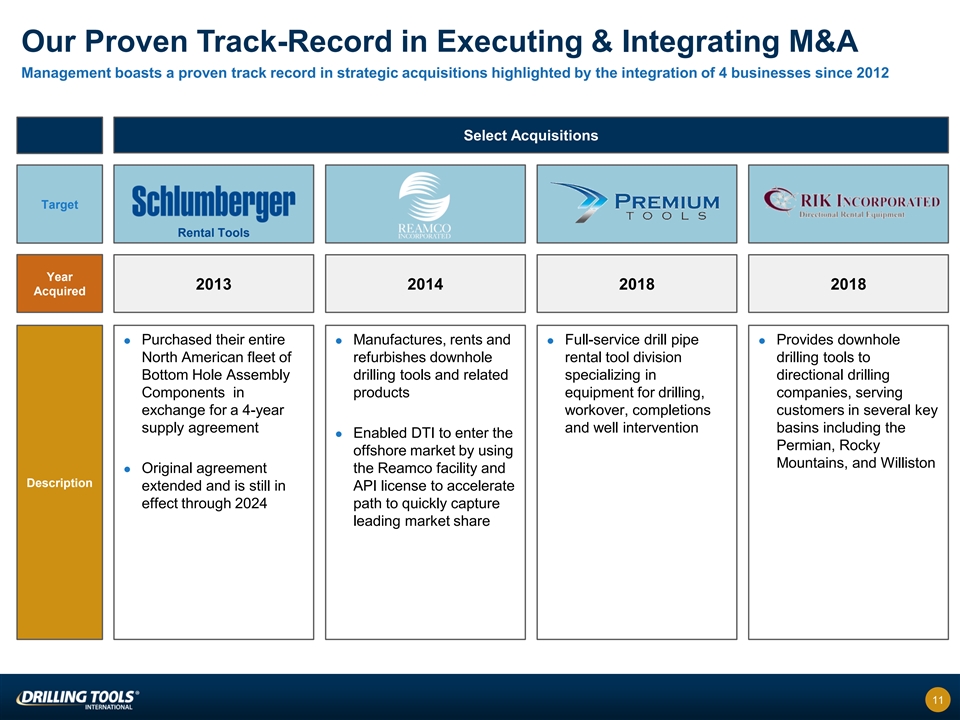
Our Proven Track-Record in Executing & Integrating M&A
Management boasts a proven track record in strategic acquisitions highlighted by the integration of 4 businesses since 2012 Select Acquisitions Target Rental Tools Year 2013 2014 2018 2018 Acquired ⚫ Purchased their entire ⚫
Manufactures, rents and ⚫ Full-service drill pipe ⚫ Provides downhole North American fleet of refurbishes downhole rental tool division drilling tools to Bottom Hole Assembly drilling tools and related specializing in directional
drilling Components in products equipment for drilling, companies, serving exchange for a 4-year workover, completions customers in several key supply agreement and well intervention basins including the ⚫ Enabled DTI to enter the Permian,
Rocky offshore market by using Mountains, and Williston ⚫ Original agreement the Reamco facility and Description extended and is still in API license to accelerate effect through 2024 path to quickly capture leading market share 11

Scale Matters: Operations Across All Major Operating Basins in North
America 16 service centers, shops, distribution and repair centers located strategically across North America to service all major oil & gas basins, providing solutions with minimal logistics required Major US Basins Serviced by DTI ✓
Permian – Midland✓ Eagle Ford✓ Anadarko / Woodford ✓ Permian – Delaware✓ Powder River✓ Granite Wash ✓ Marcellus / Utica✓ DJ Basin✓ Tuscaloosa Trend Nisku, Alberta ✓ Bakken /
Williston✓ Haynesville ✓ Barnett✓ Gulf of Mexico Williston, ND Casper, WY Charleroi, PA Vernal, UT Bakersfield, CA Aberdeen, Scotland Oklahoma City, OK Celle, Germany Kyiv, Ukraine Midland & Odessa, TX Carlsbad, NM Sibley,
LA DTI Corporate Headquarters DTI Service Centers (DTR, DNR, & DIS): 8 TM Drill-N-Ream : 2 Dubai, UAE Houston, TX Broussard & Premium Tools Division (PTD): 2 New Iberia, LA Stocking Points (DTR & DNR): 2 Inspection and Repair (DIS &
DMS): 1 Emerging Products: 1 12
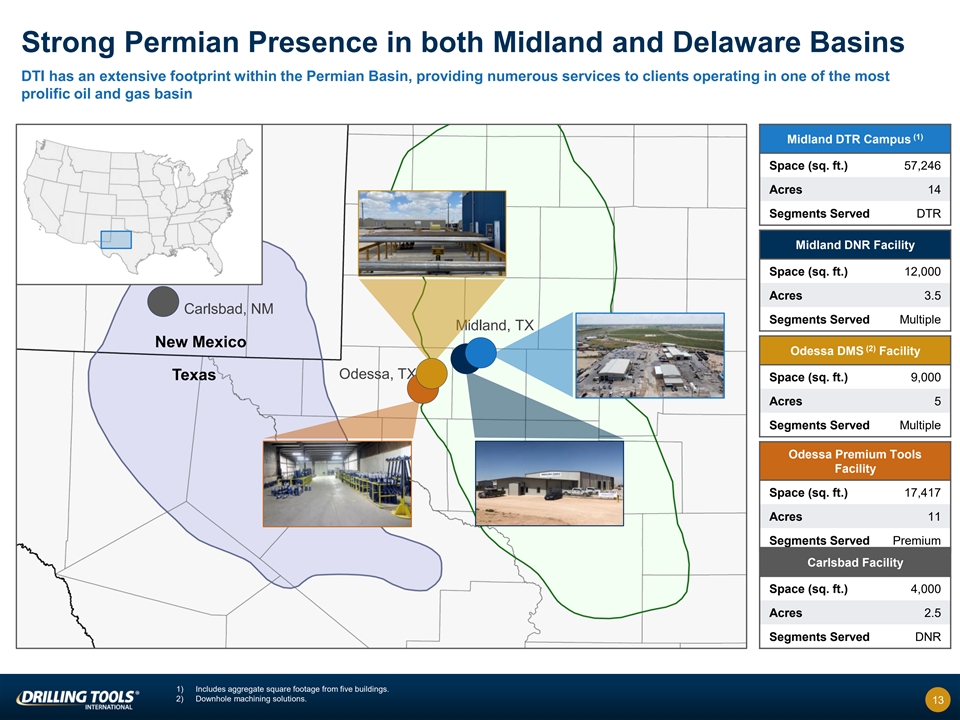
Strong Permian Presence in both Midland and Delaware Basins DTI has an
extensive footprint within the Permian Basin, providing numerous services to clients operating in one of the most prolific oil and gas basin (1) Midland DTR Campus Space (sq. ft.) 57,246 Acres 14 Segments Served DTR Midland DNR Facility Space (sq.
ft.) 12,000 Acres 3.5 Carlsbad, NM Segments Served Multiple Midland, TX New Mexico (2) Odessa DMS Facility Odessa, TX Texas Space (sq. ft.) 9,000 Acres 5 Segments Served Multiple Odessa Premium Tools Facility Space (sq. ft.) 17,417 Acres 11 Segments
Served Premium Carlsbad Facility Space (sq. ft.) 4,000 Acres 2.5 Segments Served DNR 1) Includes aggregate square footage from five buildings. 2) Downhole machining solutions. 13

Modernized Manufacturing and Repair Facility 35,840 square foot
facility located on a ten-acre campus in Broussard, Louisiana ⚫ Machine and repair equipment ensures product quality, increases product life and improves fleet utilization ⚫ Facility equipment includes hollow spindle lathes, CNC mills,
racking systems, manual lathes and in-house drill collar spiraling equipment ⚫ Machine shop reworks drill collars and hevi-wate drill pipe, spiraling of drill collars and anti-galling zinc phosphate applications of threading connections
⚫ A full-service welding and hard facing operation to support manufactured tools and enhance rental tool life ⚫ Ability to manufacture most of our rental tools enables cost reduction and control of supply chain for rental needs Raw
Materials From Mill DTI Manufacturing Facility Tools Added to Fleet Damaged Tools 14

DTI’s COMPASS Order Management System = Key Differentiator
DTI’s proprietary customer order management system provides valuable information to the company for use in making data-based capital allocation and pricing decisions Unique, Proprietary Software and Support System Customized, Automated and
Accurate Reporting Full Catalog of Tools and Equipment Provides Customers with Centralized Order Management System Expedites Order Process Transaction Data Can be Analyzed for Capital Expenditure & Pricing Decision Making 15
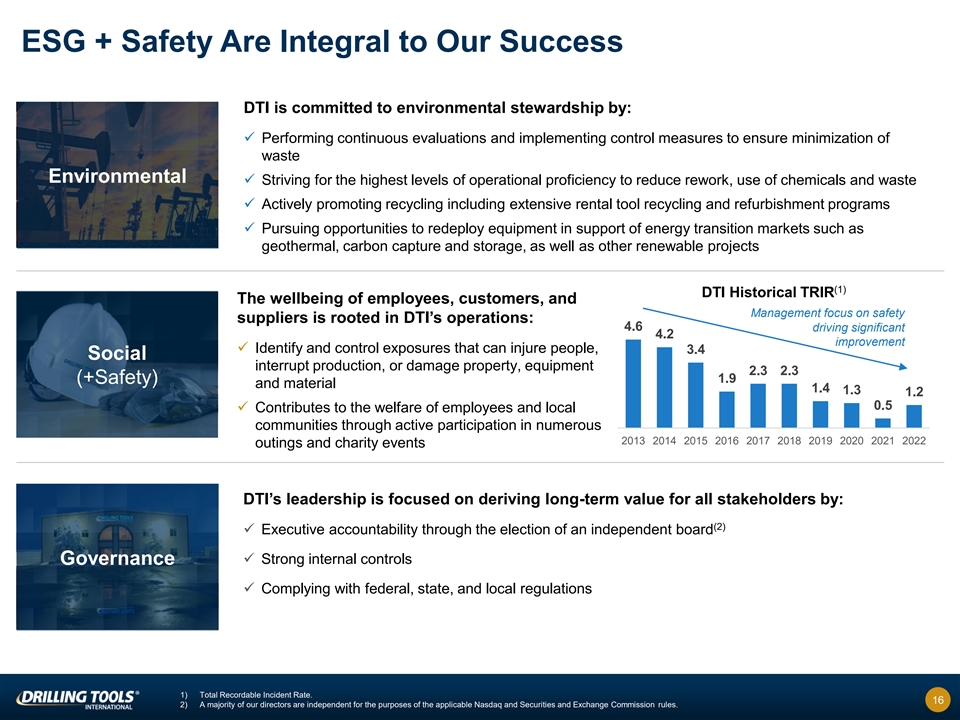
ESG + Safety Are Integral to Our Success DTI is committed to
environmental stewardship by: ✓ Performing continuous evaluations and implementing control measures to ensure minimization of waste Environmental ✓ Striving for the highest levels of operational proficiency to reduce rework, use of
chemicals and waste ✓ Actively promoting recycling including extensive rental tool recycling and refurbishment programs ✓ Pursuing opportunities to redeploy equipment in support of energy transition markets such as geothermal, carbon
capture and storage, as well as other renewable projects (1) DTI Historical TRIR The wellbeing of employees, customers, and Management focus on safety suppliers is rooted in DTI’s operations: 4.6 driving significant 4.2 improvement ✓
Identify and control exposures that can injure people, 3.4 Social interrupt production, or damage property, equipment 2.3 2.3 1.9 (+Safety) and material 1.4 1.3 1.2 0.5 ✓ Contributes to the welfare of employees and local communities through
active participation in numerous 2013 2014 2015 2016 2017 2018 2019 2020 2021 2022 outings and charity events DTI’s leadership is focused on deriving long-term value for all stakeholders by: (2) ✓ Executive accountability through the
election of an independent board ✓ Strong internal controls Governance ✓ Complying with federal, state, and local regulations 1) Total Recordable Incident Rate. 16 2) A majority of our directors are independent for the purposes of the
applicable Nasdaq and Securities and Exchange Commission rules.

Overview of DTI’s Core Product and Service Offering ($Millions)
Product / Service 2020A – 2023E Revenue Profile Key Products / Features Offering $93 - $95 ⚫ Roller reamers $78.0 ⚫ Stabilizers (standard, directional, integral blade, sleeve type, motor / ⚫ Hole openers MWD and RSS sleeve)
$47.6 Directional Tools $41.2 ⚫ Pup joints ⚫ Subs (rotary, side entry, reduced Rental section, crossover, top drive saver)⚫ Hardfacing ⚫ Steel drill collars⚫ Non magnetic drill collars 2020A 2021A 2022A 2023E $26 - $28
$25.3 ⚫ Unique and value add products $17.8 ⚫ Specialty roller reamers $15.8 deployed by a focused group of field TM Wellbore ⚫ SafeFloat float valve rentals for sales and service professionals managed pressure drilling
Optimization Tools TM ⚫ Patented Drill-N-Ream Wellbore TM ⚫ Emerging RotoSteer Technology Conditioning tool 2020A 2021A 2022A 2023E $27 - $29 $22.7 ⚫ Drill pipe and Hevi-Wate drill pipe⚫ BOPs ⚫ Drill collars⚫
Accumulators $8.9 ⚫ Kellys⚫ Hoses Premium Tools $6.3 ⚫ Pup joints⚫ Flanges ⚫ Tubing⚫ Range of handling tools 2020A 2021A 2022A 2023E $5.6 ⚫ Technical services group⚫ Downhole inspection solutions
– non- $4 - $6 destructive testing services — Sustaining engineering – research $3.5 and product development — Magnetic particle inspection liquid Other Products and penetrant inspection (1) $1.8 Services⚫ Product sales
(downhole tool and completion and production tools) — Ultrasonic testing ⚫ Emerging product launch team — Electro magnetic testing 2020A 2021A 2022A 2023E Source: Company financials and management estimates. 17 1) Net of
eliminations.

Overview of Directional Tool Rentals Key Equipment Stabilizers Reduces
drill string vibration and torque… Drill Collars Adds weight to the BHA to increase rate of penetration (“ROP”) and reduce vibration… Subs and Other Equipment Roller Reamers / Hole Openers Variety of subs, crossovers and
handling tools used Enlarges and conditions wellbore… in the drill string 18

Overview of Wellbore Optimization Tools Specialty tools division with a
focused group of field sales and service professionals providing rig site visits and customer service, enabling consistent product performance and customer satisfaction Products Offered Substantial Improvements in Wellbore Quality ⚫ Patented
technology allows the tool to maintain Drill-N- a market leading position TM Ream (“DNR”) ⚫ Numerous benefits to the customer WellBore Conditioning ⚫ Allows operators to extend length of wellbore at (1) Tool a lower cost
Specialty ⚫ Sealed bearing roller reamers Reamers, ⚫ Specialty pressure control drill stem valve for TM SafeFloat managed pressure drilling Float Valves ⚫ 2022: finalized development ⚫ 2023: Commercially launched Jan 2023
Emerging Technology ⚫ Improves ROP, reduces torque and drag and TM “RotoSteer ” eliminates slides ⚫ Applicable to hundreds of locations 1) DTI distributes the DNR pursuant to a distribution agreement with Superior Drilling
Products, Inc., the owner of the relevant patent. 19
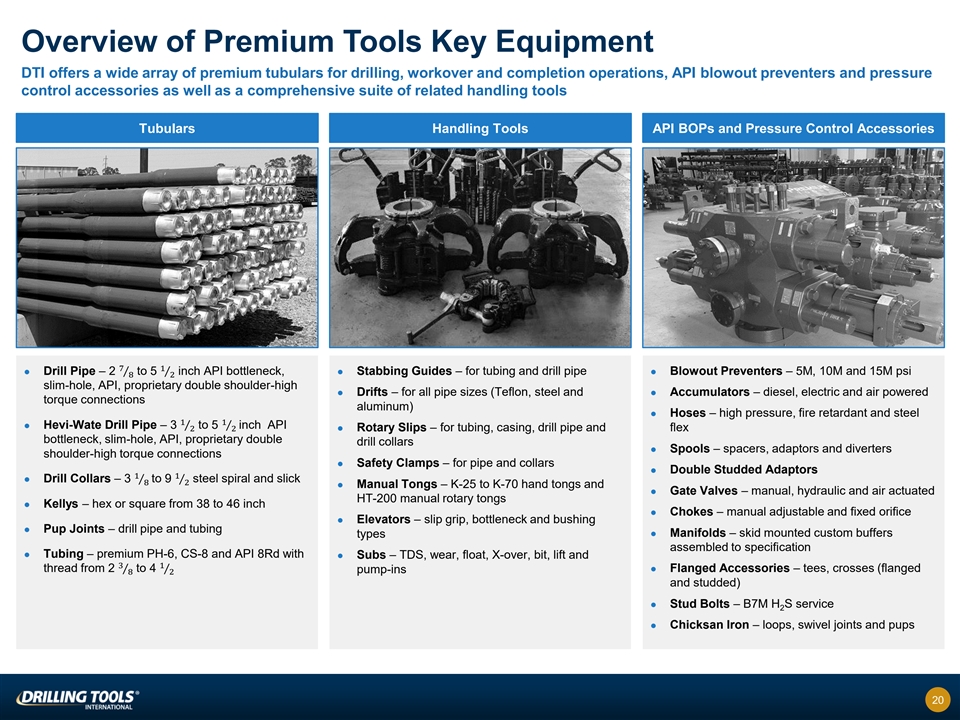
Overview of Premium Tools Key Equipment DTI offers a wide array of
premium tubulars for drilling, workover and completion operations, API blowout preventers and pressure control accessories as well as a comprehensive suite of related handling tools Tubulars Handling Tools API BOPs and Pressure Control Accessories
71 ⚫ Drill Pipe – 2 Τ to 5 Τ inch API bottleneck, ⚫ Stabbing Guides – for tubing and drill pipe⚫ Blowout Preventers – 5M, 10M and 15M psi 82 slim-hole, API, proprietary double shoulder-high ⚫
Drifts – for all pipe sizes (Teflon, steel and ⚫ Accumulators – diesel, electric and air powered torque connections aluminum) ⚫ Hoses – high pressure, fire retardant and steel 11 ΤΤ ⚫ Hevi-Wate Drill
Pipe – 3 to 5 inch API 22⚫ Rotary Slips – for tubing, casing, drill pipe and flex bottleneck, slim-hole, API, proprietary double drill collars ⚫ Spools – spacers, adaptors and diverters shoulder-high torque connections
⚫ Safety Clamps – for pipe and collars ⚫ Double Studded Adaptors 11 ⚫ Drill Collars – 3 Τ to 9 Τ steel spiral and slick 82 ⚫ Manual Tongs – K-25 to K-70 hand tongs and ⚫ Gate Valves –
manual, hydraulic and air actuated HT-200 manual rotary tongs ⚫ Kellys – hex or square from 38 to 46 inch ⚫ Chokes – manual adjustable and fixed orifice ⚫ Elevators – slip grip, bottleneck and bushing ⚫ Pup
Joints – drill pipe and tubing ⚫ Manifolds – skid mounted custom buffers types assembled to specification ⚫ Tubing – premium PH-6, CS-8 and API 8Rd with ⚫ Subs – TDS, wear, float, X-over, bit, lift and 31
thread from 2 Τ to 4 Τ⚫ Flanged Accessories – tees, crosses (flanged pump-ins 82 and studded) ⚫ Stud Bolts – B7M H S service 2 ⚫ Chicksan Iron – loops, swivel joints and pups 20

Other Products and Services Products Offered Internal Support Services
and Emerging Products ⚫ Independent inspection services equipment of all DTI divisions and select external customers Downhole ⚫ Critical to efficient operations Inspection Solutions ⚫ Services across North America including network
of six domestic and one Canadian inspection facilities ⚫ Sustaining engineering Technical ⚫ Performance analysis Services Group⚫ Product development ⚫ Technical support to quality assurance ⚫ Made-to-order downhole
drilling tools ⚫ Completion and production Product Sales Product Sales ⚫ Production desander tool operations ⚫ Williston, ND manufacturing and distribution facility 21

Blue-Chip Customer Base Across E&Ps & OFS Companies DTI has
established an exceptional customer base that includes blue-chip E&P operators and many of the largest oilfield services companies ⚫ First-call supplier for leading oilfield service providers in North America ⚫ Over the last decade,
DTI has actively expanded its customer base to further diversify its customer mix − In the nine months ending September 30, 2023, DTI’s two largest customers represented approximately 28% of revenue Revenue by Customer (%) Select DTI
Customers Nine months ended September 30, 2023 Top Two Customers 28% >40% of revenues from customers outside the Top 10 All Other Customers 72% 22
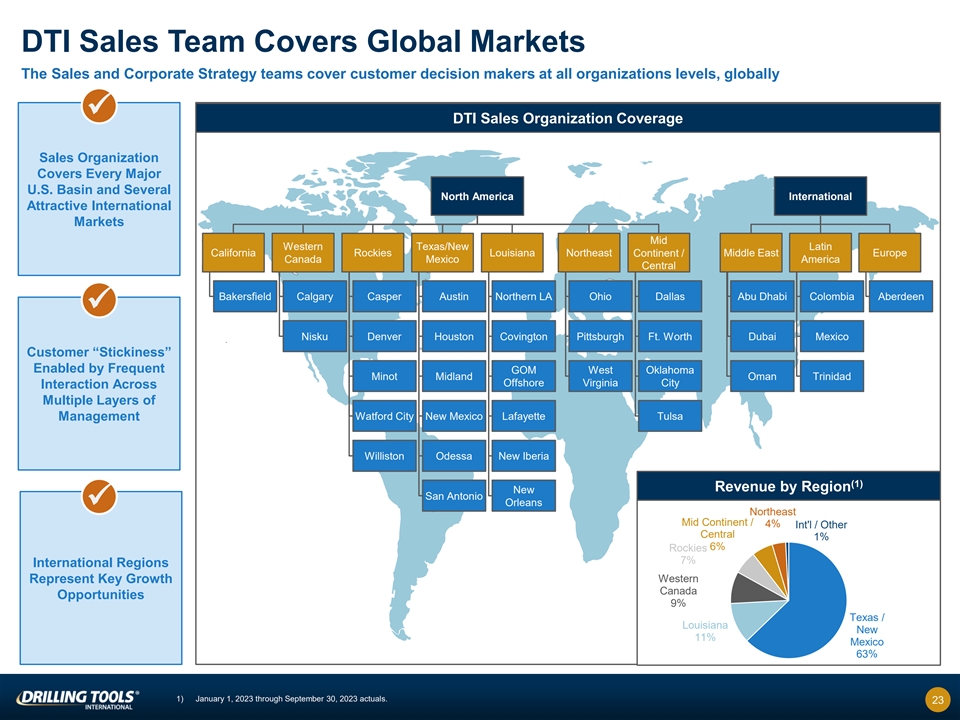
DTI Sales Team Covers Global Markets The Sales and Corporate Strategy
teams cover customer decision makers at all organizations levels, globally ✓ DTI Sales Organization Coverage Sales Organization Covers Every Major U.S. Basin and Several North America International Attractive International Markets Mid Western
Texas/New Latin California Rockies Louisiana Northeast Continent / Middle East Europe Canada Mexico America Central Bakersfield Calgary Casper Austin Northern LA Ohio Dallas Abu Dhabi Colombia Aberdeen ✓ Nisku Denver Houston Covington
Pittsburgh Ft. Worth Dubai Mexico Customer “Stickiness” Enabled by Frequent GOM West Oklahoma Minot Midland Oman Trinidad Offshore Virginia City Interaction Across Multiple Layers of Watford City New Mexico Lafayette Tulsa Management
Williston Odessa New Iberia (1) Revenue by Region New San Antonio Orleans ✓ Northeast Mid Continent / 4% Int'l / Other Central 1% 6% Rockies 7% International Regions Western Represent Key Growth Canada Opportunities 9% Texas / Louisiana New
11% Mexico 63% 1) January 1, 2023 through September 30, 2023 actuals. 23
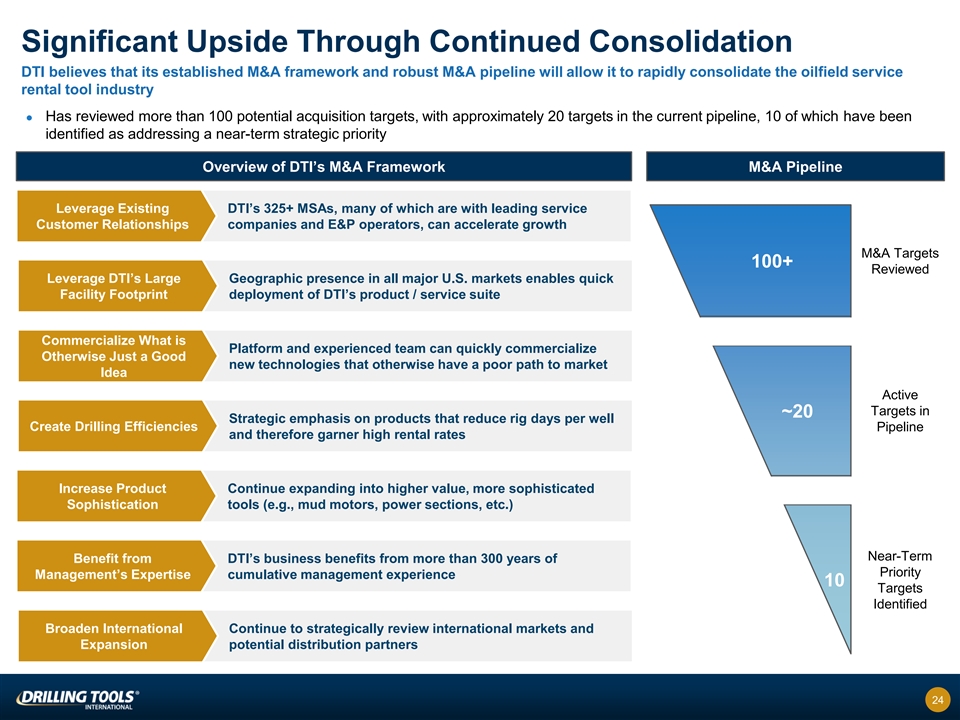
Significant Upside Through Continued Consolidation DTI believes that
its established M&A framework and robust M&A pipeline will allow it to rapidly consolidate the oilfield service rental tool industry ⚫ Has reviewed more than 100 potential acquisition targets, with approximately 20 targets in the
current pipeline, 10 of which have been identified as addressing a near-term strategic priority Overview of DTI’s M&A Framework M&A Pipeline Leverage Existing DTI’s 325+ MSAs, many of which are with leading service Customer
Relationships companies and E&P operators, can accelerate growth M&A Targets 100+ Reviewed Leverage DTI’s Large Geographic presence in all major U.S. markets enables quick Facility Footprint deployment of DTI’s product / service
suite Commercialize What is Platform and experienced team can quickly commercialize Otherwise Just a Good new technologies that otherwise have a poor path to market Idea Active Targets in ~20 Strategic emphasis on products that reduce rig days per
well Create Drilling Efficiencies Pipeline and therefore garner high rental rates Increase Product Continue expanding into higher value, more sophisticated Sophistication tools (e.g., mud motors, power sections, etc.) Near-Term Benefit from
DTI’s business benefits from more than 300 years of Priority Management’s Expertise cumulative management experience 10 Targets Identified Broaden International Continue to strategically review international markets and Expansion
potential distribution partners 24

Experience Matters! – The DTI Leadership Team Experienced,
talented, and committed management team with history of success Wayne Prejean Mike Domino David Johnson Jim Rowell President & Chief President, Directional Tool Chief Financial VP, Premium Tools Executive Officer Rentals Division Officer Aldo
Rodriguez Trent Pope Rick Young Ashley Lane VP of Sales & Corporate VP, Business Development VP, QHSE VP, International Business Development Wellbore Optimization Group Development & Corporate Support Christian Middleton David Cotten Chris
Conner Veda Ragsdill Jameson Parker VP, Finance Director, General Manager, Director, VP, Corporate Development Technical Services Downhole Inspection Solutions Human Resources 25

Financial Overview and Growth Opportunities 26
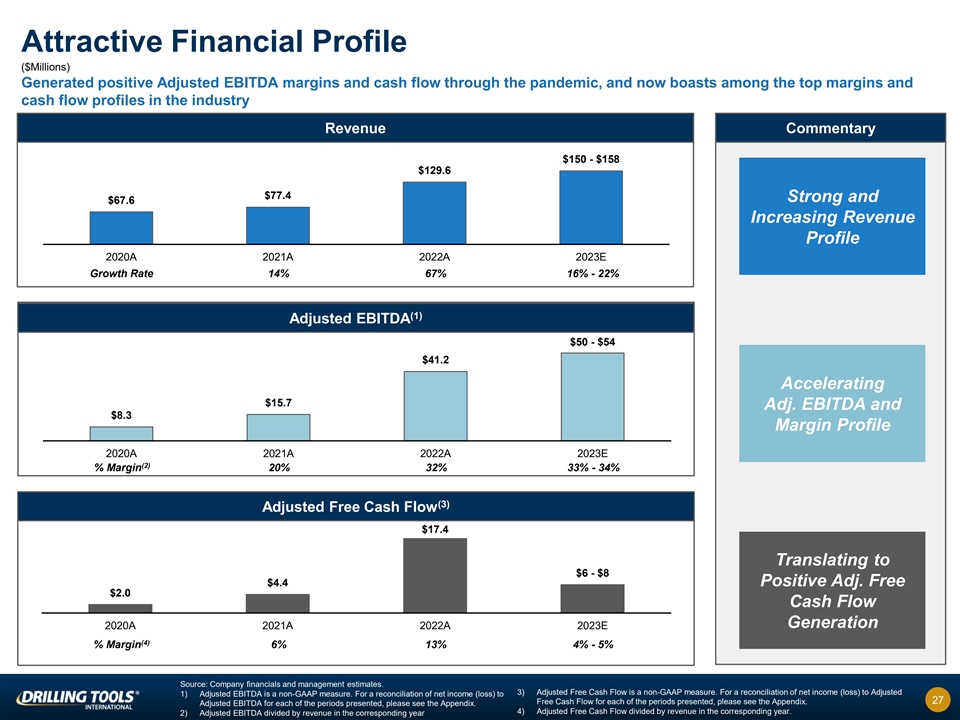
Attractive Financial Profile ($Millions) Generated positive Adjusted
EBITDA margins and cash flow through the pandemic, and now boasts among the top margins and cash flow profiles in the industry Revenue Commentary $150 - $158 $129.6 $77.4 Strong and $67.6 Increasing Revenue Profile 2020A 2021A 2022A 2023E Growth
Rate 14% 67% 16% - 22% (1) Adjusted EBITDA $50 - $54 $41.2 Accelerating $15.7 Adj. EBITDA and $8.3 Margin Profile 2020A 2021A 2022A 2023E (2) % Margin 20% 32% 33% - 34% (3) Adjusted Free Cash Flow $17.4 Translating to $6 - $8 $4.4 Positive Adj. Free
$2.0 Cash Flow Generation 2020A 2021A 2022A 2023E (4) % Margin 6% 13% 4% - 5% Source: Company financials and management estimates. 3) Adjusted Free Cash Flow is a non-GAAP measure. For a reconciliation of net income (loss) to Adjusted 1) Adjusted
EBITDA is a non-GAAP measure. For a reconciliation of net income (loss) to 27 Free Cash Flow for each of the periods presented, please see the Appendix. Adjusted EBITDA for each of the periods presented, please see the Appendix. 4) Adjusted Free
Cash Flow divided by revenue in the corresponding year. 2) Adjusted EBITDA divided by revenue in the corresponding year

Smart Capital Expenditures ($Millions) Increase in 2023 Growth Capital
spending to support stronger adjusted free cash flow in 2024+ translating to lower YE 2023 adjusted free cash flow Components of Adjusted EBITDA Commentary Adjusted Free Cash $6 - $8 (1) Flow can be directly influenced by Growth CapEx strategy $17.4
$24.5 - $25.5 Growth CapEx is company funded and increased as a $3.7 percentage of revenue in 2023 to $4.4 support strong 2024+ adj. free cash $1.6 $19.5 - $20.5 $2.0 $20.0 flow $6.6 $9.8 Maintenance CapEx is funded by tool 2020A 2021A 2022A 2023E
$(0.3) recovery revenue and is relatively Maintenance CapEx Growth CapEx Adj. Free Cash Flow % Maintenance CapEx % of steady-state as a 13% 15% 13% (2) Revenue percentage of total (2) Growth CapEx % of Revenue 2% 3% 16% revenue (3) Adj. Free Cash
Flow % of EBITDA 28% 42% 12% - 15% Source: Company financials and management estimates. 1) Adjusted Free Cash Flow defined as Adjusted EBITDA less Gross Capital Expenditures 2) Maintenance and Growth percentages for FY 2023 represents the current
forecasted split as of 9/30/23 28 3) Adjusted Free Cash Flow defined as Adjusted EBITDA less Gross Capital Expenditures

Strong Growth Driven by all DTI Products… ($Millions) Revenue
Growth by Product CAGR ’20A – ’23E Total: 30% – 33% $150 - $158 30% - 49% $4 - $6 129.6 $27 - $29 45% - 48% $3.5 $22.7 18% - 21% $26 - $28 $25.3 77.4 67.6 $5.6 $1.8 $6.3 $8.9 $17.8 $15.8 31% - 32% $93 - $95 $78.0 $47.6 $41.2
2020A 2021A 2022A 2023E DTR Wellbore Optimization Tools Premium Other Products and Services Source: Company financials and management estimates. 29 Note: Due to rounding numbers presented herein may not sum precisely to the totals
provided.

Appendix 30
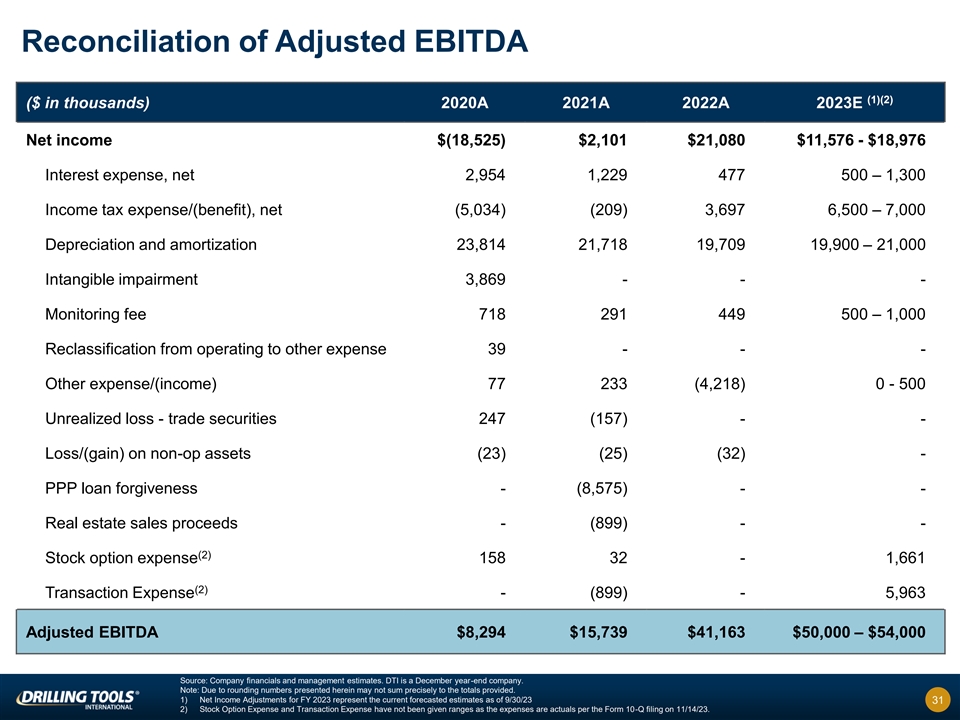
Reconciliation of Adjusted EBITDA (1)(2) ($ in thousands) 2020A 2021A
2022A 2023E Net income $(18,525) $2,101 $21,080 $11,576 - $18,976 Interest expense, net 2,954 1,229 477 500 – 1,300 Income tax expense/(benefit), net (5,034) (209) 3,697 6,500 – 7,000 Depreciation and amortization 23,814 21,718 19,709
19,900 – 21,000 Intangible impairment 3,869 - - - Monitoring fee 718 291 449 500 – 1,000 Reclassification from operating to other expense 39 - - - Other expense/(income) 77 233 (4,218) 0 - 500 Unrealized loss - trade securities 247 (157)
- - Loss/(gain) on non-op assets (23) (25) (32) - PPP loan forgiveness - (8,575) - - Real estate sales proceeds - (899) - - (2) Stock option expense 158 32 - 1,661 (2) Transaction Expense - (899) - 5,963 Adjusted EBITDA $8,294 $15,739 $41,163
$50,000 – $54,000 Source: Company financials and management estimates. DTI is a December year-end company. Note: Due to rounding numbers presented herein may not sum precisely to the totals provided. 1) Net Income Adjustments for FY 2023
represent the current forecasted estimates as of 9/30/23 31 2) Stock Option Expense and Transaction Expense have not been given ranges as the expenses are actuals per the Form 10-Q filing on 11/14/23.
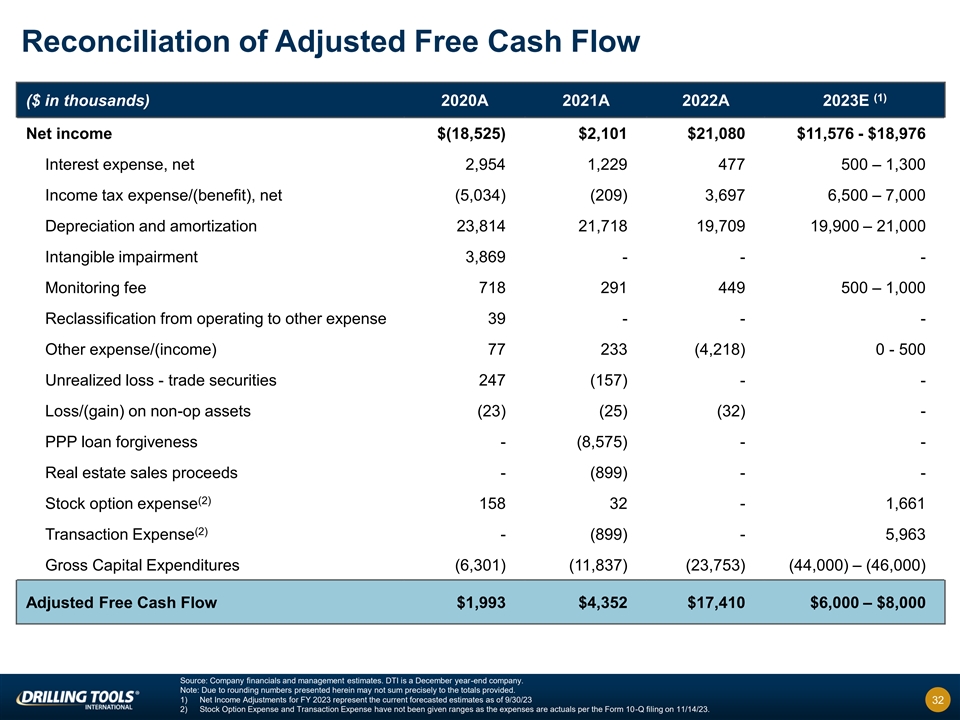
Reconciliation of Adjusted Free Cash Flow (1) ($ in thousands) 2020A
2021A 2022A 2023E Net income $(18,525) $2,101 $21,080 $11,576 - $18,976 Interest expense, net 2,954 1,229 477 500 – 1,300 Income tax expense/(benefit), net (5,034) (209) 3,697 6,500 – 7,000 Depreciation and amortization 23,814 21,718
19,709 19,900 – 21,000 Intangible impairment 3,869 - - - Monitoring fee 718 291 449 500 – 1,000 Reclassification from operating to other expense 39 - - - Other expense/(income) 77 233 (4,218) 0 - 500 Unrealized loss - trade securities
247 (157) - - Loss/(gain) on non-op assets (23) (25) (32) - PPP loan forgiveness - (8,575) - - Real estate sales proceeds - (899) - - (2) Stock option expense 158 32 - 1,661 (2) Transaction Expense - (899) - 5,963 Gross Capital Expenditures (6,301)
(11,837) (23,753) (44,000) – (46,000) Adjusted Free Cash Flow $1,993 $4,352 $17,410 $6,000 – $8,000 Source: Company financials and management estimates. DTI is a December year-end company. Note: Due to rounding numbers presented
herein may not sum precisely to the totals provided. 1) Net Income Adjustments for FY 2023 represent the current forecasted estimates as of 9/30/23 32 2) Stock Option Expense and Transaction Expense have not been given ranges as the expenses are
actuals per the Form 10-Q filing on 11/14/23.

Risk Factors Risk Factors Summary Certain factors may have a material
adverse effect on our business, financial condition and results of operations. The risks and uncertainties described below are not the only ones we face. Additional risks and uncertainties that we are unaware of, or that we currently believe are not
material, may also become important factors that adversely affect our business. If any of the following risks actually occurs, our business, financial condition, results of operations and future prospects could be materially and adversely affected.
In that event, the trading price of our common stock following the business combination could decline, and you could lose part or all of your investment. Potential investors are encouraged to review the “Risk Factors” section of our
proxy statement/prospectus/consent solicitation statement filed with the SEC on May 12, 2023. Risks Relating to Our Business and Industry • We are dependent upon the level of activity in the oil and gas industry, which is volatile and has
caused, and may in the future cause, fluctuations in our operating results. Volatility and declines in oil and gas prices may adversely affect our financial condition and results of operation. • We operate in a highly competitive industry, and
the introduction of new products and technologies by our competitors, as well as the expiration of the intellectual property rights protecting our products and technologies, could lead to lower revenue and earnings. • We are dependent on a
relatively small number of customers in a single industry. The loss of an important customer could adversely affect our results of operations and financial condition. • A portion of our revenue is derived from our non-United States operations
and sales, which exposes us to additional risks inherent in doing business in other countries. • If we fail to continue to improve and enhance the functionality, performance, reliability and design of our products in a manner that responds to
our customers’ evolving needs, our business may be adversely affected. • Quality inconsistency, defects and product failures could harm our reputation and adversely affect our business, financial condition, results of operations and
prospects. • We may be unable to manage our growth effectively. • A financial downturn could negatively affect our business, results of operations, financial condition and liquidity. • Inflation may increase the cost of operations
beyond what we can recover through price increases. • Events outside of our control, including an epidemic or outbreak of an infectious disease, such as COVID-19, may materially adversely affect our business. • Cyberattacks or other
failures in telecommunications or IT systems could result in client or proprietary information theft, data corruption and significant disruption of our business operations. Our services may be perceived as not being secure, clients may curtail or
stop using our services and we may incur significant legal and financial exposure and liabilities. • If we fail to attract and retain qualified management and skilled technical personnel, our business may be adversely affected. • We may
incur indebtedness following the business combination that could adversely affect our business. • The terms and covenants in our existing indebtedness restrict our ability to engage in some business and financial transactions, which could
adversely affect our business. • Our customers and the third parties with whom we contract are participants in the oil and gas, manufacturing, engineering and various other industries and are therefore subject to a number of risks specific to
their industries, which directly or indirectly subjects our business to many of the same risks to which their respective operations are subject. • If the security measures of the third parties with whom we contract are breached and
unauthorized access is obtained to client or proprietary data or our IT systems, we may incur significant legal and financial exposure and liabilities. Risks Relating to Legal and Regulatory Matters • We could be adversely affected if we fail
to comply with any of the numerous existing or future federal, state, local and foreign laws, regulations and policies that govern environmental protection, manufacturing and other matters applicable to our businesses. • The legal and
regulatory landscape concerning oil & gas is complex and constantly changing. The adoption of any future federal, state, local or foreign laws or regulations imposing reporting obligations on, banning or in any other way limiting hydraulic
fracturing, land or offshore drilling, or any other aspect of oil and gas exploration could make it more difficult for our clients to complete natural gas and oil wells, which could have a material adverse effect on our business, results of
operations and financial condition. • We may be unable to protect our proprietary rights in our products, technologies and processes. • Legislative or regulatory initiatives, conservation measures or technological advances could reduce
demand for oil and gas and, in turn, reduce demand for our products. • Climate change laws and regulations restricting emissions of greenhouse gasses could result in increased operating costs and reduced demand for our products. • Our
business exposes us to potential environmental, product or personal injury liability. • We may not have adequate insurance for potential environmental, product or personal injury liabilities. 33

Risk Factors (Cont’d) Risks Relating to Ownership of Our Common
Stock • We may not meet the expectations of the market or achieve the performance indicated in this Presentation. • The price of our securities may be volatile and may trade significantly below the price you pay for them. • Our
financial projections may not prove to be reflective of actual future results. • There may be circumstances in which the interests of our significant stockholders could conflict with the interests of our other stockholders. • We may
issue additional shares of our common stock or other equity securities, and such issuances could reduce the price of our common stock and dilute your ownership interest. • Nasdaq may delist our common stock from trading, and such delisting
could limit investors’ ability to execute transactions in our common stock and subject us to additional trading restrictions. 34

Recent Milestones 35
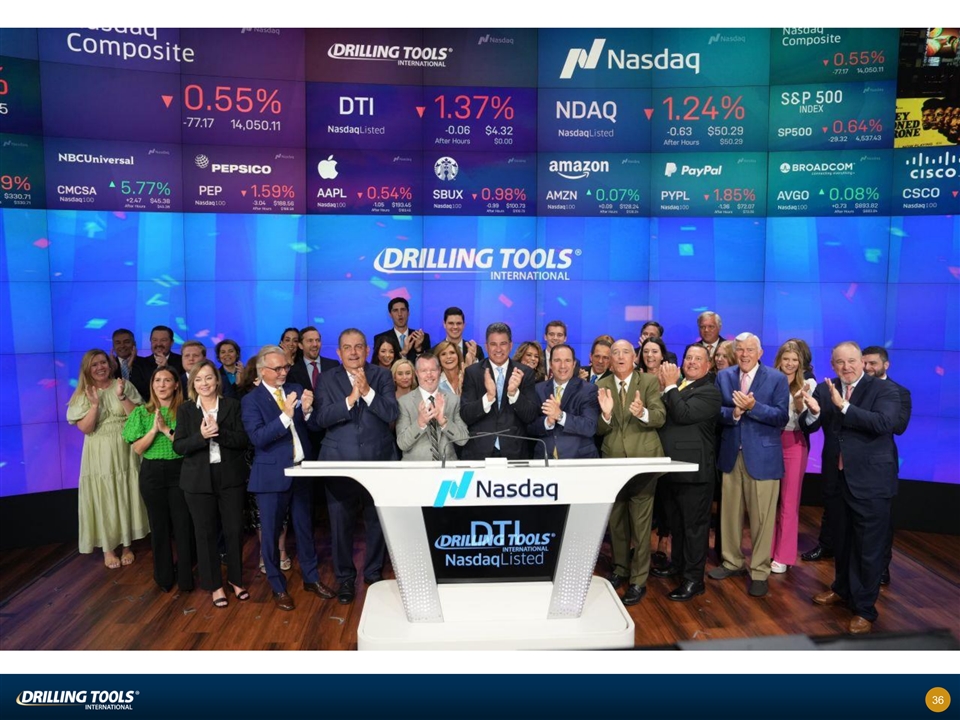
36
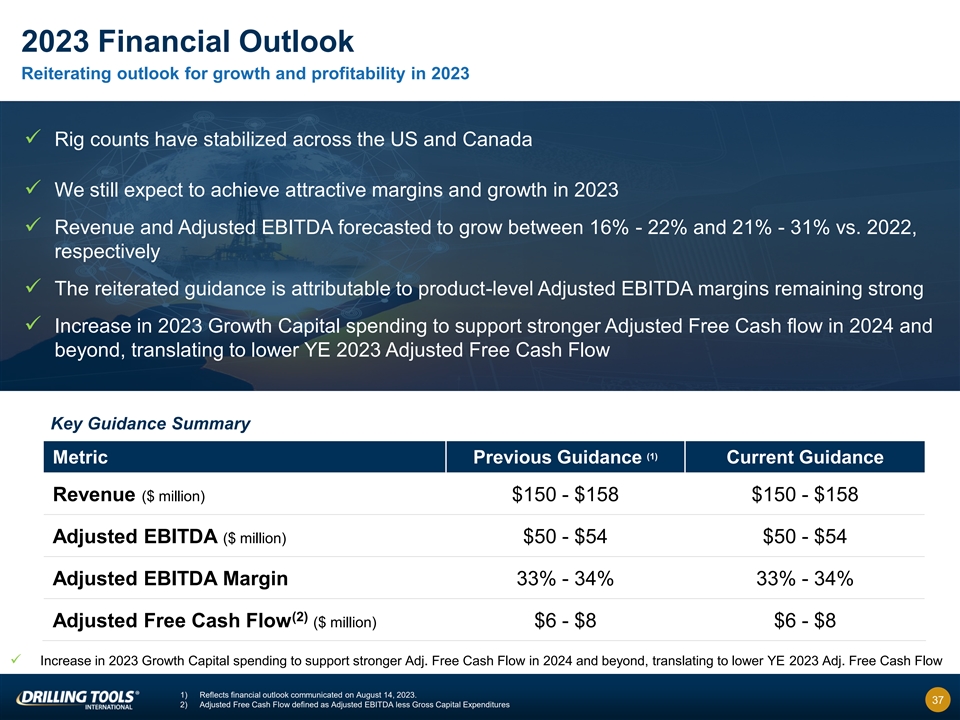
2023 Financial Outlook Reiterating outlook for growth and profitability
in 2023 ✓ Rig counts have stabilized across the US and Canada ✓ We still expect to achieve attractive margins and growth in 2023 ✓ Revenue and Adjusted EBITDA forecasted to grow between 16% - 22% and 21% - 31% vs. 2022,
respectively ✓ The reiterated guidance is attributable to product-level Adjusted EBITDA margins remaining strong ✓ Increase in 2023 Growth Capital spending to support stronger Adjusted Free Cash flow in 2024 and beyond, translating to
lower YE 2023 Adjusted Free Cash Flow Key Guidance Summary (1) Metric Previous Guidance Current Guidance Revenue ($ million) $150 - $158 $150 - $158 Adjusted EBITDA ($ million) $50 - $54 $50 - $54 Adjusted EBITDA Margin 33% - 34% 33% - 34% (2)
Adjusted Free Cash Flow ($ million) $6 - $8 $6 - $8 ✓ Increase in 2023 Growth Capital spending to support stronger Adj. Free Cash Flow in 2024 and beyond, translating to lower YE 2023 Adj. Free Cash Flow 1) Reflects financial outlook
communicated on August 14, 2023. 37 2) Adjusted Free Cash Flow defined as Adjusted EBITDA less Gross Capital Expenditures
v3.23.3
| X |
- DefinitionBoolean flag that is true when the XBRL content amends previously-filed or accepted submission.
| Name: |
dei_AmendmentFlag |
| Namespace Prefix: |
dei_ |
| Data Type: |
xbrli:booleanItemType |
| Balance Type: |
na |
| Period Type: |
duration |
|
| X |
- DefinitionFor the EDGAR submission types of Form 8-K: the date of the report, the date of the earliest event reported; for the EDGAR submission types of Form N-1A: the filing date; for all other submission types: the end of the reporting or transition period. The format of the date is YYYY-MM-DD.
| Name: |
dei_DocumentPeriodEndDate |
| Namespace Prefix: |
dei_ |
| Data Type: |
xbrli:dateItemType |
| Balance Type: |
na |
| Period Type: |
duration |
|
| X |
- DefinitionThe type of document being provided (such as 10-K, 10-Q, 485BPOS, etc). The document type is limited to the same value as the supporting SEC submission type, or the word 'Other'.
| Name: |
dei_DocumentType |
| Namespace Prefix: |
dei_ |
| Data Type: |
dei:submissionTypeItemType |
| Balance Type: |
na |
| Period Type: |
duration |
|
| X |
- DefinitionAddress Line 1 such as Attn, Building Name, Street Name
| Name: |
dei_EntityAddressAddressLine1 |
| Namespace Prefix: |
dei_ |
| Data Type: |
xbrli:normalizedStringItemType |
| Balance Type: |
na |
| Period Type: |
duration |
|
| X |
- DefinitionAddress Line 2 such as Street or Suite number
| Name: |
dei_EntityAddressAddressLine2 |
| Namespace Prefix: |
dei_ |
| Data Type: |
xbrli:normalizedStringItemType |
| Balance Type: |
na |
| Period Type: |
duration |
|
| X |
- Definition
+ References
+ Details
| Name: |
dei_EntityAddressCityOrTown |
| Namespace Prefix: |
dei_ |
| Data Type: |
xbrli:normalizedStringItemType |
| Balance Type: |
na |
| Period Type: |
duration |
|
| X |
- DefinitionCode for the postal or zip code
| Name: |
dei_EntityAddressPostalZipCode |
| Namespace Prefix: |
dei_ |
| Data Type: |
xbrli:normalizedStringItemType |
| Balance Type: |
na |
| Period Type: |
duration |
|
| X |
- DefinitionName of the state or province.
| Name: |
dei_EntityAddressStateOrProvince |
| Namespace Prefix: |
dei_ |
| Data Type: |
dei:stateOrProvinceItemType |
| Balance Type: |
na |
| Period Type: |
duration |
|
| X |
- DefinitionA unique 10-digit SEC-issued value to identify entities that have filed disclosures with the SEC. It is commonly abbreviated as CIK. Reference 1: http://www.xbrl.org/2003/role/presentationRef
-Publisher SEC
-Name Exchange Act
-Number 240
-Section 12
-Subsection b-2
| Name: |
dei_EntityCentralIndexKey |
| Namespace Prefix: |
dei_ |
| Data Type: |
dei:centralIndexKeyItemType |
| Balance Type: |
na |
| Period Type: |
duration |
|
| X |
- DefinitionIndicate if registrant meets the emerging growth company criteria. Reference 1: http://www.xbrl.org/2003/role/presentationRef
-Publisher SEC
-Name Exchange Act
-Number 240
-Section 12
-Subsection b-2
| Name: |
dei_EntityEmergingGrowthCompany |
| Namespace Prefix: |
dei_ |
| Data Type: |
xbrli:booleanItemType |
| Balance Type: |
na |
| Period Type: |
duration |
|
| X |
- DefinitionCommission file number. The field allows up to 17 characters. The prefix may contain 1-3 digits, the sequence number may contain 1-8 digits, the optional suffix may contain 1-4 characters, and the fields are separated with a hyphen.
| Name: |
dei_EntityFileNumber |
| Namespace Prefix: |
dei_ |
| Data Type: |
dei:fileNumberItemType |
| Balance Type: |
na |
| Period Type: |
duration |
|
| X |
- DefinitionTwo-character EDGAR code representing the state or country of incorporation.
| Name: |
dei_EntityIncorporationStateCountryCode |
| Namespace Prefix: |
dei_ |
| Data Type: |
dei:edgarStateCountryItemType |
| Balance Type: |
na |
| Period Type: |
duration |
|
| X |
- DefinitionThe exact name of the entity filing the report as specified in its charter, which is required by forms filed with the SEC. Reference 1: http://www.xbrl.org/2003/role/presentationRef
-Publisher SEC
-Name Exchange Act
-Number 240
-Section 12
-Subsection b-2
| Name: |
dei_EntityRegistrantName |
| Namespace Prefix: |
dei_ |
| Data Type: |
xbrli:normalizedStringItemType |
| Balance Type: |
na |
| Period Type: |
duration |
|
| X |
- DefinitionThe Tax Identification Number (TIN), also known as an Employer Identification Number (EIN), is a unique 9-digit value assigned by the IRS. Reference 1: http://www.xbrl.org/2003/role/presentationRef
-Publisher SEC
-Name Exchange Act
-Number 240
-Section 12
-Subsection b-2
| Name: |
dei_EntityTaxIdentificationNumber |
| Namespace Prefix: |
dei_ |
| Data Type: |
dei:employerIdItemType |
| Balance Type: |
na |
| Period Type: |
duration |
|
| X |
- DefinitionLocal phone number for entity.
| Name: |
dei_LocalPhoneNumber |
| Namespace Prefix: |
dei_ |
| Data Type: |
xbrli:normalizedStringItemType |
| Balance Type: |
na |
| Period Type: |
duration |
|
| X |
- DefinitionBoolean flag that is true when the Form 8-K filing is intended to satisfy the filing obligation of the registrant as pre-commencement communications pursuant to Rule 13e-4(c) under the Exchange Act. Reference 1: http://www.xbrl.org/2003/role/presentationRef
-Publisher SEC
-Name Exchange Act
-Number 240
-Section 13e
-Subsection 4c
| Name: |
dei_PreCommencementIssuerTenderOffer |
| Namespace Prefix: |
dei_ |
| Data Type: |
xbrli:booleanItemType |
| Balance Type: |
na |
| Period Type: |
duration |
|
| X |
- DefinitionBoolean flag that is true when the Form 8-K filing is intended to satisfy the filing obligation of the registrant as pre-commencement communications pursuant to Rule 14d-2(b) under the Exchange Act. Reference 1: http://www.xbrl.org/2003/role/presentationRef
-Publisher SEC
-Name Exchange Act
-Number 240
-Section 14d
-Subsection 2b
| Name: |
dei_PreCommencementTenderOffer |
| Namespace Prefix: |
dei_ |
| Data Type: |
xbrli:booleanItemType |
| Balance Type: |
na |
| Period Type: |
duration |
|
| X |
- DefinitionTitle of a 12(b) registered security. Reference 1: http://www.xbrl.org/2003/role/presentationRef
-Publisher SEC
-Name Exchange Act
-Number 240
-Section 12
-Subsection b
| Name: |
dei_Security12bTitle |
| Namespace Prefix: |
dei_ |
| Data Type: |
dei:securityTitleItemType |
| Balance Type: |
na |
| Period Type: |
duration |
|
| X |
- DefinitionName of the Exchange on which a security is registered. Reference 1: http://www.xbrl.org/2003/role/presentationRef
-Publisher SEC
-Name Exchange Act
-Number 240
-Section 12
-Subsection d1-1
| Name: |
dei_SecurityExchangeName |
| Namespace Prefix: |
dei_ |
| Data Type: |
dei:edgarExchangeCodeItemType |
| Balance Type: |
na |
| Period Type: |
duration |
|
| X |
- DefinitionBoolean flag that is true when the Form 8-K filing is intended to satisfy the filing obligation of the registrant as soliciting material pursuant to Rule 14a-12 under the Exchange Act. Reference 1: http://www.xbrl.org/2003/role/presentationRef
-Publisher SEC
-Name Exchange Act
-Section 14a
-Number 240
-Subsection 12
| Name: |
dei_SolicitingMaterial |
| Namespace Prefix: |
dei_ |
| Data Type: |
xbrli:booleanItemType |
| Balance Type: |
na |
| Period Type: |
duration |
|
| X |
- DefinitionTrading symbol of an instrument as listed on an exchange.
| Name: |
dei_TradingSymbol |
| Namespace Prefix: |
dei_ |
| Data Type: |
dei:tradingSymbolItemType |
| Balance Type: |
na |
| Period Type: |
duration |
|
| X |
- DefinitionBoolean flag that is true when the Form 8-K filing is intended to satisfy the filing obligation of the registrant as written communications pursuant to Rule 425 under the Securities Act. Reference 1: http://www.xbrl.org/2003/role/presentationRef
-Publisher SEC
-Name Securities Act
-Number 230
-Section 425
| Name: |
dei_WrittenCommunications |
| Namespace Prefix: |
dei_ |
| Data Type: |
xbrli:booleanItemType |
| Balance Type: |
na |
| Period Type: |
duration |
|
ROC Energy Acquisition (NASDAQ:ROCAU)
Historical Stock Chart
From Apr 2024 to May 2024

ROC Energy Acquisition (NASDAQ:ROCAU)
Historical Stock Chart
From May 2023 to May 2024
