SECURITIES AND EXCHANGE COMMISSION
Washington, D.C. 20549
Form 6-K
REPORT OF FOREIGN PRIVATE ISSUER PURSUANT TO
RULE 13A-16 OR 15D-16
UNDER THE SECURITIES EXCHANGE ACT OF 1934
May 2024
Commission File Number 1-15182
DR.
REDDY’S LABORATORIES LIMITED
(Translation of registrant’s name into English)
8-2-337, Road No. 3, Banjara Hills
Hyderabad, Telangana 500 034, India
+91-40-49002900
(Address of principal executive office)
Indicate by check mark whether the registrant files or will file annual
reports under cover of Form 20-F or Form 40-F.
Form
20-F x Form
40-F ¨
Indicate by check mark if the registrant is submitting the Form 6-K
in paper as permitted by Regulation S-T Rule 101(b)(1): ______
Note: Regulation S-T Rule 101(b)(1) only permits the submission
in paper of a Form 6-K if submitted solely to provide an attached annual report to security holders.
Indicate by check mark if the registrant is submitting the Form 6-K
in paper as permitted by Regulation S-T Rule 101(b)(7): ______
Note: Regulation S-T Rule 101(b)(7) only
permits the submission in paper of a Form 6-K if submitted to furnish a report or other document that the registrant foreign private issuer
must furnish and make public under the laws of the jurisdiction in which the registrant is incorporated, domiciled or legally organized
(the registrant’s “home country”), or under the rules of the home country exchange on which the registrant’s securities
are traded, as long as the report or other document is not a press release, is not required to be and has not been distributed to the
registrant’s security holders, and, if discussing a material event, has already been the subject of a Form 6-K submission or other
Commission filing on EDGAR.
Indicate by check mark whether by furnishing the
information contained in this Form, the registrant is also thereby furnishing the information to the Commission pursuant to Rule 12g3-2(b)
under the Securities Exchange Act of 1934.
Yes
¨ No
x
If “Yes” is marked, indicate below the file number assigned
to registrant in connection with Rule 12g3-2(b): 82-________.
DISCLOSURE
OF RESULTS OF OPERATIONS AND FINANCIAL CONDITION
We
hereby furnish the United States Securities and Exchange Commission with copies of the following information about our public disclosures
regarding our results of operations and financial condition for the quarter and year ended March 31, 2024.
On
May 07, 2024, we announced our results of operations for the quarter and year ended March 31, 2024. We issued a press release announcing
our results under International Financial Reporting Standards (“IFRS”), IFRS Audited Consolidated Financial Results, Ind
AS Audited Consolidated Financial Results with audit report and Ind AS Audited Standalone Financial Results with audit report for the
quarter and year ended March 31, 2024, a copy of which is attached to this Form 6-K as Exhibit 99.2 , 99.3 , 99.4 and 99.5 respectively.
We
have also made available to the public on our web site, www.drreddys.com, the following: IFRS Audited Consolidated Financial Results,
Ind AS Audited Consolidated Financial Results and Ind AS Audited Standalone Financial Results for the quarter and year ended March 31,
2024.
EXHIBITS
SIGNATURES
Pursuant to the requirements of the Securities Exchange Act of 1934,
the registrant has duly caused this report to be signed on its behalf by the undersigned, thereunto duly authorized.
| |
DR. REDDY’S LABORATORIES LIMITED
(Registrant) |
|
| |
|
|
| Date: May 07, 2024 |
By: |
/s/ K Randhir Singh |
|
| |
|
Name: |
K Randhir Singh |
|
| |
|
Title: |
Company Secretary & Compliance Officer |
|
Exhibit 99.1
 |
Dr. Reddy’s Laboratories Ltd.
8-2-337, Road No. 3, Banjara Hills,
Hyderabad - 500 034, Telangana,
India.
CIN : L85195TG1984PLC004507
Tel :+91 40 4900 2900
Fax :+91 40 4900 2999
Email :mail@drreddys.com
www.drreddys.com |
May
7, 2024
National
Stock Exchange of India Ltd. (Scrip Code: DRREDDY-EQ)
BSE
Limited. (Scrip Code: 500124)
New
York Stock Exchange Inc. (Stock Code: RDY)
NSE
IFSC Ltd. (Stock Code: DRREDDY)
Dear
Sir/Madam,
| Sub: | Outcome of
Board Meeting – Audited Financial Results for the quarter and year ended March 31, 2024 |
In
furtherance to our letter dated March 22, 2024, we would like to inform you that the Board of Directors of the Company, at its meeting
held on May 7, 2024, has inter alia transacted and approved the following businesses:
Financial
Results
Approved
the Audited Financial Results of the Company for the quarter and year ended March 31, 2024. In terms of the above, we are enclosing herewith:
| 1. | Audited
Consolidated Financial Results of the Company and its subsidiaries for the quarter and year
ended March 31, 2024 as per the International Financial Reporting Standards (IFRS) as issued
by International Accounting Standards Board (IASB). |
| 2. | Press
Release on Financial Results of the Company for the above period. |
| 3. | Audited
Consolidated Financial Results of the Company and its subsidiaries for the quarter and year
ended March 31, 2024, as per Indian Accounting Standards. |
| 4. | Audited
Standalone Financial Results of the Company for the quarter and year ended March 31, 2024,
as per Indian Accounting Standards. |
Pursuant
to Regulation 33 of the SEBI (Listing Obligations and Disclosure Requirements) Regulations, 2015, the Audit Reports of the Statutory
Auditors on the Financial Results as mentioned at serial nos. 3 and 4 are also enclosed.
We
would like to confirm that the Statutory Auditors of the Company have issued Audit Reports with 'Unmodified Opinion' on the Audited Financial
Statements of the Company (Standalone and Consolidated) for the year ended March 31, 2024
Dividend
Recommended
a final dividend of Rs. 40/- (800%) per equity share of Rs. 5/- each for the financial year 2023-24. The dividend will be paid on or
after five days from the date of declaration of the final dividend by the shareholders at the ensuing 40th Annual General Meeting (AGM)
of the Company.
Change
in Key Managerial Personnel
| a) | Mr.
Parag Agarwal will retire as the Chief Financial Officer of the Company effective from close
of working hours on July 31, 2024, consequent to his decision to expand his involvement in
philanthropy for the cause of making a meaningful difference to the lives of the most vulnerable
segment of the society – the voiceless animals. His resignation cum retirement letter
is attached. He will also cease to be a member of the Management Council and Senior Management
Personnel of the Company, effective from the close of working hours on July 31, 2024. He
will continue to be available with the Company till August 31, 2024, and |
| b) | Mr.
M V Narasimham, currently Dy. Chief Financial Officer of the Company is being elevated to
the role of the Chief Financial Officer of the Company with effect from August 1, 2024. Presently,
he is also a Member of the Management Council and Senior Management Personnel of the Company. |
The
details required under Regulation 30 of the SEBI Listing Regulations, read with SEBI Circular No. SEBI/HO/CFD/CFD-PoD-1/P/CIR/2023/123
dated July 13, 2023, is given in Annexure enclosed herewith.
Annual
General Meeting and Book Closure Date
Approved
convening of 40th Annual General Meeting (AGM) of the members of the Company on Monday, July 29, 2024.
The
Register of Members and the Share Transfer Books of the Company shall remain closed from Wednesday, July 17, 2024, to Friday, July 19,
2024 (both days inclusive) for the purpose of the Dividend and Annual General Meeting of the Company.
The
Board Meeting commenced at 2:00 p.m. IST and concluded at 3:55 p.m IST.
This
is for your information and records.
Thanking
you.
Yours
faithfully,
For
Dr. Reddy’s Laboratories Limited
K
Randhir Singh
Company
Secretary, Compliance Officer & Head-CSR
Encl:
as above
Annexure
Details
under Regulation 30 of SEBI (Listing Obligations and Disclosure Requirements) Regulations, 2015, read with SEBI/HO/CFD/CFD-PoD-1/P/CIR/2023/123
dated July 13, 2023
| Sl.
No. |
Particulars |
Details |
| 1 |
Reason
for change viz. appointment, re-appointment, resignation, removal, death or otherwise |
a) |
Resignation
cum retirement of Mr. Parag Agarwal from his position as Chief Financial Officer of the Company, consequent to his decision to expand
involvement in philanthropy for the cause of making a meaningful difference to the lives of the most vulnerable segment of the society
– the voiceless animals.
|
| |
b) |
Appointment
of Mr. M V Narasimham, currently the Dy. Chief Financial Officer of the Company, as the Chief Financial Officer of the Company. |
| 2 |
Date
of appointment/ re-appointment/ cessation (as applicable); and term of appointment/ re-appointment |
a) |
Resignation cum retirement of Mr. Parag Agarwal will be effective from the close of working hours on July 31, 2024. He will also cease to be a Member of Management Council as well as a Senior Management Personnel of the Company, effective on that day. He will continue to be available with the Company till August 31, 2024.
|
| |
b) |
Mr.
M V Narasimham, currently the Dy. Chief Financial Officer of the Company, has been appointed as the Chief Financial Officer of the
Company, with effect from August 1, 2024.
|
| |
The Board of the Directors has approved the above changes at its meeting held today, i.e. on May 7, 2024 on the recommendations of the Nomination, Governance and Compensation Committee and the Audit Committee of the Company. |
| 3 |
Brief
profile (in case of appointment) |
a)
b) |
Not
applicable
The
profile of Mr. M V Narasimham is annexed herewith |
| 4 |
Disclosure
of relationships between directors (in case of appointment of a director) |
Not applicable |
Profile
of Mr. M V Narasimham

Mr. M V Narasimham serves as Deputy Chief Financial Officer with responsibilities of global commercial
business finance and global taxation. He is a qualified Chartered Accountant with more than 30 years of experience across several finance
functions. Mr. Narasimham joined the Company in the year 2000 and has held various positions of increasing responsibility across
finance in the Company. He was leading the finance operations of our business segments PSAI and Global Generics during the period 2006
to 2012. Since 2012, he has been heading the Corporate Finance (Direct and Indirect Taxation, Consolidation and Corporate Analytics)
along with Global Business finance involving both India and overseas operations.
Exhibit
99.2

| |
CONTACT |
| DR. REDDY'S LABORATORIES LTD. |
Investor relationS |
Media relationS |
| 8-2-337, Road No. 3, Banjara Hills, |
Richa Periwal |
richaperiwal@drreddys.com |
USHA IYER |
| Hyderabad - 500034. Telangana, India. |
AISHWARYA SITHARAM |
aishwaryasitharam@drreddys.com |
ushaiyer@drreddys.com |
Dr.
Reddy’s Q4 & full year FY24 Financial Results
Hyderabad,
India, May 7, 2024: Dr. Reddy’s Laboratories Ltd. (BSE: 500124 | NSE: DRREDDY | NYSE: RDY | NSEIFSC: DRREDDY) today announced
its consolidated financial results for the fourth quarter and full year ended March 31, 2024. The information mentioned in this release
is based on consolidated financial statements under International Financial Reporting Standards (IFRS).
| |
Q4FY24 |
FY24 |
| |
|
|
| Revenues |
₹ 70,830 Mn |
₹ 279,164 Mn |
| |
[Up: 12% YoY; Down: 2 % QoQ]^ |
[Up: 14% YoY]^ |
| |
|
|
| Gross Margin |
58.6% |
58.6% |
| |
[Q4FY23: 57.2%; Q3FY24: 58.5%] |
[FY23: 56.7%] |
| |
|
|
| SG&A Expenses |
₹ 20,476 Mn |
₹ 77,201 Mn |
| |
[Up: 14% YoY; 1% QoQ] |
[Up: 13% YoY] |
| |
|
|
| R&D Expenses |
₹ 6,877 Mn |
₹ 22,873 Mn |
| |
[9.7% of Revenues] |
[8.2% of Revenues] |
| |
|
|
| EBITDA |
₹ 18,720 Mn |
₹ 83,013 Mn |
| |
[26.4% of Revenues] |
[29.7% of Revenues] |
| |
|
|
| Profit before Tax |
₹ 16,016 Mn |
₹ 71,870 Mn |
| |
[Up: 21% YoY; Down: 12% QoQ] |
[Up: 19% YoY] |
| |
|
|
| Profit after Tax |
₹ 13,070 Mn |
₹ 55,684 Mn |
| |
[Up: 36% YoY; Down: 5% QoQ] |
[Up: 24% YoY] |
^Excluding
revenues from brands divested during the corresponding previous periods, Q4FY24 YoY growth is 17% and FY24 growth is 16%.
Commenting
on the results, Co-Chairman & MD, G V Prasad said: “Our growth and profitability in FY2024 has been driven by our
performance in the US. We have also made significant progress on future growth drivers through licensing, collaboration and pipeline
building. We will continue to strengthen our core businesses through superior execution as we invest and build the future growth drivers.”
| All amounts
in millions, except EPS |
All US dollar
amounts based on convenience translation rate of 1 USD = ₹ 83.34 |
Dr. Reddy’s
Laboratories Limited & Subsidiaries
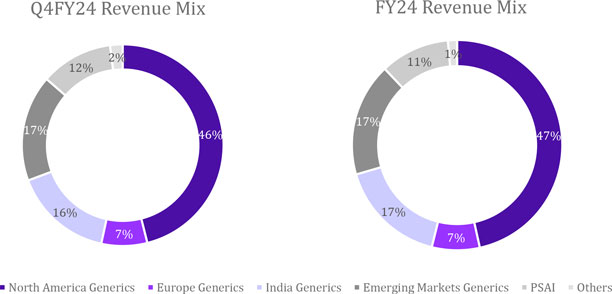
Revenue
Mix by Segment for the quarter
| | |
Q4FY24 | | |
Q4FY23 | | |
YoY | | |
Q3FY24 | | |
QoQ | |
| Particulars | |
(₹) | | |
(₹) | | |
Gr % | | |
(₹) | | |
Gr% | |
| Global Generics | |
| 61,191 | | |
| 54,257 | | |
| 13 | | |
| 63,095 | | |
| (3 | ) |
| North America | |
| 32,626 | | |
| 25,321 | | |
| 29 | | |
| 33,492 | | |
| (3 | ) |
| Europe | |
| 5,208 | | |
| 4,960 | | |
| 5 | | |
| 4,970 | | |
| 5 | |
| India | |
| 11,265 | | |
| 12,834 | | |
| (12)^ | | |
| 11,800 | | |
| (5 | ) |
| Emerging Markets | |
| 12,091 | | |
| 11,142 | | |
| 9 | | |
| 12,833 | | |
| (6 | ) |
| Pharmaceutical Services and Active Ingredients (PSAI) | |
| 8,219 | | |
| 7,787 | | |
| 6 | | |
| 7,839 | | |
| 5 | |
| Others | |
| 1,420 | | |
| 924 | | |
| 54 | | |
| 1,214 | | |
| 17 | |
| Total | |
| 70,830 | | |
| 62,968 | | |
| 12 | | |
| 72,148 | | |
| (2 | ) |
^Excluding
revenues from brands divested during the corresponding previous periods, Q4FY24 YoY India growth is 17%.
Revenue
Mix by Segment for the year
| | |
FY24 | | |
FY23 | | |
YoY | |
| Particulars | |
(₹) | | |
(₹) | | |
Gr% | |
| Global Generics | |
| 245,453 | | |
| 213,768 | | |
| 15 | |
| North America | |
| 129,895 | | |
| 101,704 | | |
| 28 | |
| Europe | |
| 20,511 | | |
| 17,603 | | |
| 17 | |
| India | |
| 46,407 | | |
| 48,932 | | |
| (5)^ | |
| Emerging Markets | |
| 48,640 | | |
| 45,529 | | |
| 7 | |
| PSAI | |
| 29,801 | | |
| 29,069 | | |
| 3 | |
| Others | |
| 3,910 | | |
| 3,042 | | |
| 29 | |
| Total | |
| 279,164 | | |
| 245,879 | | |
| 14^ | |
^Excluding
revenues from brands divested during the corresponding previous periods, India growth is 5.5% and overall 16%.
Consolidated
Income Statement for the quarter
| | |
Q4FY24 | | |
Q4FY23 | | |
YoY | | |
Q3FY24 | | |
QoQ | |
| Particulars | |
($) | | |
(₹) | | |
($) | | |
(₹) | | |
Gr
% | | |
($) | | |
(₹) | | |
Gr% | |
| Revenues | |
| 850 | | |
| 70,830 | | |
| 756 | | |
| 62,968 | | |
| 12 | | |
| 866 | | |
| 72,148 | | |
| (2 | ) |
| Cost of Revenues | |
| 352 | | |
| 29,347 | | |
| 324 | | |
| 26,971 | | |
| 9 | | |
| 359 | | |
| 29,945 | | |
| (2 | ) |
| Gross
Profit | |
| 498 | | |
| 41,483 | | |
| 432 | | |
| 35,997 | | |
| 15 | | |
| 506 | | |
| 42,203 | | |
| (2 | ) |
| % of Revenues | |
| | | |
| 58.6 | % | |
| | | |
| 57.2 | % | |
| | | |
| | | |
| 58.5 | % | |
| | |
| Operating
Expenses | |
| | | |
| | | |
| | | |
| | | |
| | | |
| | | |
| | | |
| | |
| Selling, General & Administrative
Expenses | |
| 246 | | |
| 20,476 | | |
| 216 | | |
| 17,992 | | |
| 14 | | |
| 243 | | |
| 20,228 | | |
| 1 | |
| % of Revenues | |
| | | |
| 28.9 | % | |
| | | |
| 28.6 | % | |
| | | |
| | | |
| 28.0 | % | |
| | |
| Research & Development
Expenses | |
| 83 | | |
| 6,877 | | |
| 64 | | |
| 5,366 | | |
| 28 | | |
| 67 | | |
| 5,565 | | |
| 24 | |
| % of Revenues | |
| | | |
| 9.7 | % | |
| | | |
| 8.5 | % | |
| | | |
| | | |
| 7.7 | % | |
| | |
| Impairment of Non-Current Assets,
net | |
| (2 | ) | |
| (173 | ) | |
| 6 | | |
| 540 | | |
| (132 | ) | |
| 1 | | |
| 110 | | |
| (257 | ) |
| Other
Operating (Income)/Expense | |
| (8 | ) | |
| (656 | ) | |
| (3 | ) | |
| (281 | ) | |
| 133 | | |
| (12 | ) | |
| (967 | ) | |
| (32 | ) |
| Results
from Operating Activities | |
| 179 | | |
| 14,959 | | |
| 149 | | |
| 12,380 | | |
| 21 | | |
| 207 | | |
| 17,267 | | |
| (13 | ) |
| Finance (Income)/Expense, net | |
| (12 | ) | |
| (1022 | ) | |
| (10 | ) | |
| (799 | ) | |
| 28 | | |
| (12 | ) | |
| (963 | ) | |
| 6 | |
| Share
of Profit of Equity Accounted Investees, net of tax | |
| (0 | ) | |
| (35 | ) | |
| (1 | ) | |
| (76 | ) | |
| (54 | ) | |
| (0 | ) | |
| (27 | ) | |
| 30 | |
| Profit
before Income Tax | |
| 192 | | |
| 16,016 | | |
| 159 | | |
| 13,255 | | |
| 21 | | |
| 219 | | |
| 18,257 | | |
| (12 | ) |
| % of Revenues | |
| | | |
| 22.6 | % | |
| | | |
| 21.1 | % | |
| | | |
| | | |
| 25.3 | % | |
| | |
| Income
Tax Expense | |
| 35 | | |
| 2,946 | | |
| 44 | | |
| 3,663 | | |
| (20 | ) | |
| 54 | | |
| 4,468 | | |
| (34 | ) |
| Profit
for the Period | |
| 157 | | |
| 13,070 | | |
| 115 | | |
| 9,592 | | |
| 36 | | |
| 165 | | |
| 13,789 | | |
| (5 | ) |
| % of Revenues | |
| | | |
| 18.5 | % | |
| | | |
| 15.2 | % | |
| | | |
| | | |
| 19.1 | % | |
| | |
| | |
| | | |
| | | |
| | | |
| | | |
| | | |
| | | |
| | | |
| | |
| Diluted
Earnings per Share (EPS) | |
| 0.94 | | |
| 78.35 | | |
| 0.69 | | |
| 57.62 | | |
| 36 | | |
| 0.99 | | |
| 82.67 | | |
| (5 | ) |
| EBITDA Computation for
the quarter |
*Includes
income from Investment |
| | |
Q4FY24 | | |
Q4FY23 | | |
Q3FY24 | |
| Particulars | |
($) | | |
(₹) | | |
($) | | |
(₹) | | |
($) | | |
(₹) | |
| Profit before Income Tax | |
| 192 | | |
| 16,016 | | |
| 159 | | |
| 13,255 | | |
| 219 | | |
| 18,257 | |
| Interest (Income) / Expense, net* | |
| (10 | ) | |
| (835 | ) | |
| (8 | ) | |
| (673 | ) | |
| (12 | ) | |
| (1,030 | ) |
| Depreciation | |
| 29 | | |
| 2,421 | | |
| 27 | | |
| 2,213 | | |
| 29 | | |
| 2,437 | |
| Amortization | |
| 15 | | |
| 1,291 | | |
| 12 | | |
| 977 | | |
| 16 | | |
| 1,333 | |
| Impairment | |
| (2 | ) | |
| (173 | ) | |
| 6 | | |
| 539 | | |
| 1 | | |
| 110 | |
| EBITDA | |
| 225 | | |
| 18,720 | | |
| 196 | | |
| 16,311 | | |
| 253 | | |
| 21,107 | |
| % of Revenues | |
| | | |
| 26.4 | % | |
| | | |
| 25.9 | % | |
| | | |
| 29.3 | % |
Consolidated
Income Statement for the year
| | |
FY24 | | |
FY23 | | |
YoY | |
| Particulars | |
($) | | |
(₹) | | |
($) | | |
(₹) | | |
Gr % | |
| Revenues | |
| 3,350 | | |
| 279,164 | | |
| 2,950 | | |
| 245,879 | | |
| 14 | |
| Cost of Revenues | |
| 1,387 | | |
| 115,557 | | |
| 1,278 | | |
| 106,536 | | |
| 8 | |
| Gross Profit | |
| 1,963 | | |
| 163,607 | | |
| 1,672 | | |
| 139,343 | | |
| 17 | |
| % of Revenues | |
| | | |
| 58.6 | % | |
| | | |
| 56.7 | % | |
| | |
| Operating Expenses | |
| | | |
| | | |
| | | |
| | | |
| | |
| Selling, General & Administrative Expenses | |
| 926 | | |
| 77,201 | | |
| 816 | | |
| 68,026 | | |
| 13 | |
| % of Revenues | |
| | | |
| 27.7 | % | |
| | | |
| 27.7 | % | |
| | |
| Research & Development Expenses | |
| 274 | | |
| 22,873 | | |
| 233 | | |
| 19,381 | | |
| 18 | |
| % of Revenues | |
| | | |
| 8.2 | % | |
| | | |
| 7.9 | % | |
| | |
| Impairment of Non-Current Assets, net | |
| 0 | | |
| 3 | | |
| 8 | | |
| 699 | | |
| (100 | ) |
| Other Operating (Income)/Expense | |
| (50 | ) | |
| (4,199 | ) | |
| (71 | ) | |
| (5,907 | ) | |
| (29 | ) |
| Results from Operating Activities | |
| 813 | | |
| 67,729 | | |
| 686 | | |
| 57,144 | | |
| 19 | |
| Finance (Income)/Expense, net | |
| (48 | ) | |
| (3,994 | ) | |
| (34 | ) | |
| (2,853 | ) | |
| 40 | |
| Share of Profit of Equity Accounted Investees, net of tax | |
| (2 | ) | |
| (147 | ) | |
| (4 | ) | |
| (370 | ) | |
| (60 | ) |
| Profit before Income Tax | |
| 862 | | |
| 71,870 | | |
| 724 | | |
| 60,367 | | |
| 19 | |
| % of Revenues | |
| | | |
| 25.7 | % | |
| | | |
| 24.6 | % | |
| | |
| Income Tax Expense | |
| 194 | | |
| 16,186 | | |
| 184 | | |
| 15,300 | | |
| 6 | |
| Profit for the Period | |
| 668 | | |
| 55,684 | | |
| 541 | | |
| 45,067 | | |
| 24 | |
| % of Revenues | |
| | | |
| 19.9 | % | |
| | | |
| 18.3 | % | |
| | |
| Diluted Earnings per Share (EPS) | |
| 4.01 | | |
| 334.02 | | |
| 3.25 | | |
| 270.85 | | |
| 23 | |
| EBITDA Computation for
the year |
*Includes
income from Investment |
| | |
FY24 | | |
FY23 | |
| Particulars | |
($) | | |
(₹) | | |
($) | | |
(₹) | |
| Profit before Income Tax | |
| 862 | | |
| 71,870 | | |
| 724 | | |
| 60,367 | |
| Interest (Income) / Expense, net* | |
| (45 | ) | |
| (3,716 | ) | |
| (7 | ) | |
| (621 | ) |
| Depreciation | |
| 115 | | |
| 9,576 | | |
| 103 | | |
| 8,614 | |
| Amortization | |
| 63 | | |
| 5,280 | | |
| 48 | | |
| 4,022 | |
| Impairment | |
| 0 | | |
| 3 | | |
| 8 | | |
| 698 | |
| EBITDA | |
| 996 | | |
| 83,013 | | |
| 877 | | |
| 73,081 | |
| % of Revenues | |
| | | |
| 29.7 | % | |
| | | |
| 29.7 | % |
Key
Balance Sheet Items
| | |
As
on 31st Mar 2024 | | |
As
on 31st Dec 2023 | | |
As
on 31st Mar 2023 | |
| Particulars | |
($) | | |
(₹) | | |
($) | | |
(₹) | | |
($) | | |
(₹) | |
| Cash and Cash Equivalents and Other Investments | |
| 990 | | |
| 82,529 | | |
| 920 | | |
| 76,665 | | |
| 749 | | |
| 62,456 | |
| Trade Receivables | |
| 963 | | |
| 80,298 | | |
| 948 | | |
| 79,028 | | |
| 870 | | |
| 72,486 | |
| Inventories | |
| 763 | | |
| 63,552 | | |
| 729 | | |
| 60,796 | | |
| 584 | | |
| 48,670 | |
| Property, Plant, and Equipment | |
| 923 | | |
| 76,886 | | |
| 871 | | |
| 72,554 | | |
| 797 | | |
| 66,462 | |
| Goodwill and Other Intangible Assets | |
| 494 | | |
| 41,204 | | |
| 494 | | |
| 41,192 | | |
| 421 | | |
| 35,094 | |
| Loans and Borrowings (Current & Non-Current) | |
| 240 | | |
| 20,020 | | |
| 238 | | |
| 19,851 | | |
| 162 | | |
| 13,472 | |
| Trade Payables | |
| 371 | | |
| 30,919 | | |
| 381 | | |
| 31,716 | | |
| 317 | | |
| 26,444 | |
| Equity | |
| 3,366 | | |
| 280,550 | | |
| 3,264 | | |
| 272,026 | | |
| 2,772 | | |
| 230,991 | |
Key Business Highlights [for Q4FY24]
| · | Entered
into an exclusive partnership with Sanofi to promote and distribute its vaccine brands in India. |
| · | Partnered
with Bayer to distribute the second brand for heart failure management drug, Vericiguat, in India. |
| · | Entered
into a licensing agreement with U.S. based biopharma, Pharmazz, to market first-in-class Centhaquine (Lyfaquin®)
for treatment of hypovolemic shock in India. |
| · | Acquired
MenoLabs® business, a women’s health, and dietary supplement branded portfolio from Amyris, Inc. |
| · | Forayed
into the consumer health market of United Kingdom (UK) with the launch of allergy medication, Histallay®. |
| · | Launched
Bevacizumab, our first biosimilar in the UK. |
| · | Launched
migraine management wearable device, Nerivio®, in Germany and South Africa. |
| · | Received
a ‘Voluntary Action Indicated’ (VAI) status from the United States Food and Drug Administration (U.S. FDA)
at both our formulations manufacturing facility (FTO-3) following their routine cGMP inspection in October 2023 as well as our
R&D facility center in Bachupally, following their GMP and Pre-Approval Inspection (PAI) in December 2023. |
| · | Received
a Complete Response Letter (CRL) from the U.S. FDA on our Biologics License Application (BLA) of our proposed biosimilar,
Rituximab. We will continue to work closely with the agency to address and resolve all concerns within stipulated timelines. |
ESG & other Highlights [for Q4FY24]
| · | Included
in the S&P Global Sustainability Yearbook 2024 for the 4th consecutive year, making it to the top 10% score category for
the first time. |
| · | Received
an ‘A’ rating in Carbon Disclosure Project (CDP) Supplier Engagement, which is in the Leadership Band. Only
Indian Pharma company to get an ‘A-’ rating in Climate Change and Water Security for our 2023
CDP disclosures. |
| · | Secured
the Leadership position in the Indian Corporate Governance Assessment for 2023 conducted by the Institutional Investor
Advisory Services (IiAS) |
Revenue Analysis
| · | Q4FY24
consolidated revenues at ₹ 70.8 billion, YoY growth of 12% and QoQ decline of 2%. Adjusted for income from non-core brands
divested in the previous year, on a re-based comparator, YoY growth was 17%. The reported YoY growth was largely driven by growth in
global generics revenues in North America as well as Emerging Markets. QoQ decline was primarily due to lower global generics revenues
in North America, Emerging Markets, and India. |
FY24 consolidated revenues at
₹ 279.2 billion, YoY growth of 14%. Adjusted for income from brands divested in the previous year, on a re-based comparator, YoY
growth of 16%. The reported growth was primarily driven by strong performances witnessed in North America, Europe, and Emerging Markets.
Global Generics (GG)
| · | Q4FY24 revenues at ₹ 61.2 billion,
YoY growth of 13% and QoQ decline of 3%. YoY growth was primarily driven by increase in volumes of our base business, new product launches,
partially offset by price erosion in certain markets. Sequential decline is due change in product mix, price erosion and unfavorable forex
impact. |
FY24 revenues at ₹ 245.5
billion, a YoY growth of 15%. The growth was primarily driven by increase in volumes of our base business, new product launches partially
offset by price erosion in US and Europe.
North America
| · | Q4FY24 revenues at ₹ 32.6 billion,
YoY growth of 29% and QoQ decline of 3%. YoY growth was largely on account of increase in volumes of our base business, contribution from
new launches, partly offset by price erosion. Sequential decline was due to decrease in base business volumes and price erosion in select
brands. |
FY24 revenues at ₹ 129.9
billion, YoY growth of 28%. The growth was largely on account of increase in base business volumes, integration of Mayne portfolio, forex
gains partly offset by price erosion.
| · | During the quarter, we launched 5 new products
in the region, of which 4 were launched in the U.S. A total of 21 products were launched during the year. |
| · | During the quarter, we filed 9 new Abbreviated
New Drug Applications (ANDAs) with the USFDA, taking our annual ANDA filing count to 17. As of March 31, 2024, 86 generic filings were
pending approval from the USFDA. These comprise of 81 ANDAs and five New Drug Applications (NDAs) filed under the Section 505(b)(2) route
of the US Federal Food, Drug, and Cosmetic Act. Of the 86 ANDAs, 50 are Paragraph IV applications, and we believe that 24 of these have
the ‘First to File’ status. |
Europe
| · | Q4FY24 revenues at ₹ 5.2 billion,
YoY and sequential growth of 5%. YoY growth was primarily on account of improvement in base business volumes, new product launches, partly
offset by price erosion. QoQ growth was primarily on account increase in base business and favorable forex. |
| - | Germany at ₹ 2.8 billion, YoY growth of 7% and QoQ growth of 5%. |
| - | UK at ₹ 1.5 billion, YoY growth of 9% and QoQ growth of 10%. |
| - | Rest of Europe at ₹ 0.9 billion, YoY decline of 7% and QoQ decline of 5%. |
FY24 revenues at ₹ 20.5
billion, YoY growth of 17%. The growth was primarily on account leveraging the portfolio and momentum in base business, partly offset
by price erosion.
| - | Germany at ₹ 10.6 billion, YoY growth of 13%. |
| - | UK at ₹ 6.3 billion, YoY growth of 32%. |
| - | Rest of Europe at ₹ 3.6 billion, YoY growth of 4%. |
| · | During the quarter, we launched 6 new products in the region, taking the
annual total to 42. |
India
| · | Q4FY24 revenues at ₹ 11.3 billion,
YoY decline of 12% and QoQ decline of 5%. Adjusted for brand divestment income, on a re-based comparator, YoY growth of 11%. QoQ decline
is on account of lower volumes from base business. As per IQVIA, our IPM rank was at 10 for the quarter. |
| · | FY24 revenues at ₹ 46.4 billion,
YoY decline of 5%. Excluding the income from divestment of non-core brands in the previous year, on a re-based comparator, India growth
is in mid-single digit. |
| · | During the quarter, we launched 3 new brands
in the country, taking the annual total to 13. |
Emerging Markets
| · | Q4FY24 revenues at ₹ 12.1 billion,
YoY growth of 9% and QoQ decline of 6%. YoY growth is attributable to new product launches, while QoQ decline was due to unfavorable forex. |
| - | Revenues from Russia at ₹ 5.0 billion, YoY decline of 4% and QoQ decline of 15%. |
| - | YoY decline was majorly due to unfavorable currency exchange rate movements, partially offset by price
increases. |
| - | QoQ decline was on account of unfavorable forex. |
| - | Revenues from other Commonwealth of Independent States (CIS) countries and Romania at ₹ 2.2
billion, decline of 5% YoY and 7% QoQ. |
| - | YoY decline was primarily on account of decline in base business volumes, partly offset by increase in
prices. |
| - | QoQ decline was driven by decline in base business volumes, partly offset by higher prices. |
| - | Revenues from Rest of World (RoW) territories at ₹ 4.9 billion, growth of 34% YoY and 7%
QoQ. |
| - | YoY growth was largely attributable to contribution from new products. |
| - | QoQ growth was primarily driven by increase in base business volumes and new product launches. |
| · | FY24 revenues at ₹ 48.6 billion,
YoY growth of 7%. The growth is attributable to new product launches and market share expansion, partially offset by unfavorable forex. |
| - | Revenues from Russia at ₹ 22.3 billion, YoY growth of 5%. The growth was largely on account
of improved volumes and increase in certain brand prices, partially offset by unfavorable currency exchange rate movements. |
| - | Revenues from other CIS countries and Romania at ₹ 8.6 billion, broadly flat on YoY basis. |
| - | Revenues from RoW territories at ₹ 17.7 billion, YoY growth of 13%. The growth is largely
attributable to contribution from new product launches. |
| · | During the quarter, we launched 17 new products
across various countries in the region, taking the annual total to 106. |
Pharmaceutical Services and Active Ingredients (PSAI)
| · | Q4FY24 revenues at ₹ 8.2 billion,
with a growth of 6% YoY and 5% QoQ. YoY growth was mainly driven by revenues from new products, favourable forex, partially offset by
price decline. QoQ growth was driven by improved volumes in base business partially offset by price decline. |
| · | FY24 revenues at ₹ 29.8 billion,
with a growth of 3% YoY. The growth was mainly driven by revenues from new products, favourable forex, partially offset by price erosion.
|
| · | During the quarter, we filed 48 Drug Master Files
(DMFs) globally, taking the annual count to 133. |
Income Statement Highlights:
Gross Margin
| · | Q4FY24 at 58.6% (GG: 62.0%, PSAI: 28.6%),
an increase of 140 basis points (bps) over previous year and 7 bps sequentially. The YoY increase was on account of improvement in product
mix and productivity cost savings, partially offset by income from non-core brands divested in previous period. On a sequential basis,
the growth was primarily on account of favourable product mix. |
FY24 at 58.6% (GG: 62.9%, PSAI:
23.2%). Gross margin increased by 193 bps YoY. The expansion in margin was on account of favourable product mix, higher government incentive,
productivity cost savings, partially offset by price erosion in select markets and brand divestment income during previous period.
Selling, General & Administrative (SG&A) Expenses
| · | Q4FY24 at ₹ 20.5 billion, YoY increase of 14% and by 1% QoQ.
|
FY24 at ₹ 77.2 billion, YoY increase of 13%.
The increase is largely on account of
higher investments in sales & marketing activities to strengthen our existing brands, new business initiatives including scaling up
OTC and consumer health & wellness business, digitalization initiatives and building strong commercial capabilities.
Research & Development (R&D) Expenses
| · | Q4FY24 at ₹ 6.9 billion. As % to
Revenues – Q4FY24: 9.7% | Q3FY24: 7.7% | Q4FY23: 8.5%. |
FY24 at ₹ 22.9 billion.
As % to Revenues – FY24: 8.2% | FY23: 7.9%.
R&D investments is related to our
biosimilar products pipeline, development efforts across generics as well as our novel oncology assets.
Other Operating Income
| · | Q4FY24 at ₹ 0.7 billion as compared
to ₹ 0.3 billion in Q4FY23. |
FY24 at ₹ 4.2 billion as
compared to ₹ 5.9 billion in FY23.
Net Finance Income
| · | Q4FY24 at ₹1.0 billion compared
to ₹ 0.8 billion in Q4FY23. |
FY24 at ₹ 4.0 billion as
compared to ₹ 2.9 billion in FY23.
Profit before Tax
| · | Q4FY24 at ₹ 16.0 billion, YoY growth
of 21%. QoQ decline of 12%. |
FY24 at ₹ 71.9 billion,
an increase of 19%. As % to Revenues –FY24: 25.7% | FY23: 24.6%.
Profit after Tax
| · | Q4FY24 at ₹ 13.1 billion, YoY growth
of 36%, QoQ decline of 5%. |
FY24 at ₹ 55.7 billion,
a growth of 24%. As % to Revenues –FY24: 19.9% | FY23: 18.3%.
The Effective Tax Rate (ETR) for the
quarter has been 18.4%. The ETR during the quarter is lower due to a one-time benefit accruing on account reversal of a tax provision,
re-measurement of Deferred Tax asset owing to increase in USA state tax liability and adoption of corporate tax rate under section 115BAA
of the IT Act.
The ETR for FY24 was 22.5% as compared
to 25.3% in FY23. The ETR was lower for FY24 mainly due to adoption of corporate tax rate under section 115BAA of the Income Tax Act of
India.
Diluted Earnings per Share (EPS)
| · | Q4FY24 is ₹ 78.4. FY24 is ₹ 334.0. |
Other Highlights:
Earnings before Interest, Tax, Depreciation and Amortization
(EBITDA)
| · | Q4FY24 at ₹ 18.7 billion, YoY growth
of 15% and QoQ decline of 11%. EBITDA margin is 26.4%. |
FY24 at ₹ 83.0 billion,
a YoY growth of 14%. EBITDA margin is 29.7%.
Others:
| · | Operating Working Capital : As on 31st
March 2024 at ₹ 112.9 billion. |
| · | Capital Expenditure: Q4FY24 at ₹
5.0 billion. FY24 at ₹ 15.2 billion. |
| · | Free Cash Flow: Q4FY24 at ₹ 5.3
billion. FY24 at ₹ 19.1 billion. |
| · | Net Cash Surplus : As on 31st March
2024at ₹ 64.6 billion |
| · | Debt to Equity : As on 31st March
2024 is (0.23) |
| · | The Board has recommended payment of a dividend
of Rs. 40 per equity share of face value Rs. 5/- each (800% of face value) for the year ended March 31, 2024, subject to
approval of the members of the company. |
About key metrics and non-GAAP Financial Measures
This press release contains non-GAAP financial
measures within the meaning of Regulation G and Item 10(e) of Regulation S-K. Such non-GAAP financial measures are measures of our historical
performance, financial position or cash flows that are adjusted to exclude or include amounts from the most directly comparable financial
measure calculated and presented in accordance with IFRS.
The presentation of this financial information
is not intended to be considered in isolation or as a substitute for, or superior to, the financial information prepared and presented
in accordance with IFRS. Our non-GAAP financial measures are not based on any comprehensive set of accounting rules or principles. These
measures may be different from non-GAAP financial measures used by other companies, limiting their usefulness for comparison purposes.
We believe these non-GAAP financial measures provide
investors with useful supplemental information about the financial performance of our business, enable comparison of financial results
between periods where certain items may vary independent of business performance, and allow for greater transparency with respect to key
metrics used by management in operating our business.
For more information on our non-GAAP financial
measures and a reconciliation of GAAP to non-GAAP measures, please refer to "Reconciliation of GAAP to Non-GAAP Results"
table in this press release.
All amounts in millions, except EPS
Reconciliation of GAAP Measures to Non-GAAP Measures
Operating Working Capital
| | |
As
on 31st Mar 2024 | |
| Particulars | |
(₹) | |
| Inventories | |
| 63,552 | |
| Trade Receivables | |
| 80,298 | |
| Less: | |
| | |
| Trade Payables | |
| 30,919 | |
| Operating Working Capital | |
| 112,931 | |
Free Cash Flow
| Particulars | |
Three
months ended 31st
Mar 2024 | | |
Year
ended 31st Mar 2024 | |
| | |
(₹) | | |
(₹) | |
| Net cash generated from operating activities | |
| 17,053 | | |
| 65,479 | |
| Less: | |
| | | |
| | |
| Taxes | |
| 5,534 | | |
| 20,047 | |
| Investments in Property, Plant & Equipment, and Intangibles | |
| 6,230 | | |
| 18,709 | |
| Free Cash Flow before Acquisitions | |
| 5,289 | | |
| 26,723 | |
| Less: | |
| | | |
| | |
| Acquisitions related Pay-out | |
| - | | |
| 7,640 | |
| Free Cash Flow | |
| 5,289 | | |
| 19,083 | |
Net Cash Surplus and Debt to Equity
| | |
As
on 31st Mar 2024 | |
| Particulars | |
(₹) | |
| Cash and Cash Equivalents | |
| 7,107 | |
| Investments | |
| 75,422 | |
| Short-term Borrowings | |
| (12,723 | ) |
| Long-term Borrowings, Non-Current | |
| (5,990 | ) |
| Less: | |
| | |
| Restricted Cash Balance – Unclaimed Dividend | |
| 227 | |
| Lease liabilities (included in Long-term Borrowings, Non-Current) | |
| (2,190 | ) |
| Equity Investments (Included in Investments) | |
| 1,193 | |
| Net Cash Surplus | |
| 64,586 | |
| Equity | |
| 280,550 | |
| Net Debt/Equity | |
| (0.23 | ) |
Computation of Return on Capital Employed
| | |
As on 31st Mar 2024 | |
| Particulars | |
(₹) | |
| Profit before Tax | |
| 71,870 | |
| Less: | |
| | |
| Interest and Investment Income (Excluding forex gain/loss) | |
| 3,716 | |
| Earnings Before Interest and taxes [A] | |
| 68,154 | |
| | |
| | |
| Average Capital Employed [B] | |
| 191,809 | |
| | |
| | |
| Return on Capital Employed (A/B) (Ratio) | |
| 36 | % |
Computation of Capital Employed:
| | |
Year Ended | |
| Particulars | |
Mar
31, 2024 | | |
Mar
31, 2023 | |
| Property Plant and Equipment | |
| 76,886 | | |
| 66,462 | |
| Intangibles | |
| 36,951 | | |
| 30,849 | |
| Goodwill | |
| 4,253 | | |
| 4,245 | |
| Investment in Equity Accounted Associates | |
| 4,196 | | |
| 4,702 | |
| Other Current Assets | |
| 22,560 | | |
| 20,069 | |
| Other Investments | |
| 1,059 | | |
| 660 | |
| Other Non-Current Assets | |
| 1,632 | | |
| 800 | |
| Inventories | |
| 63,552 | | |
| 48,670 | |
| Trade Receivables | |
| 80,298 | | |
| 72,485 | |
| Derivative Financial Instruments | |
| (299 | ) | |
| 1,095 | |
| Less: | |
| | | |
| | |
| Other Liabilities | |
| 46,866 | | |
| 42,320 | |
| Provisions | |
| 5,444 | | |
| 5,513 | |
| Trade payables | |
| 30,919 | | |
| 26,444 | |
| Operating Capital Employed | |
| 207,859 | | |
| 175,760 | |
| Average Capital Employed | |
| 191,809 | |
Computation of EBITDA
Refer page no. 3 & 4.
Earnings Call Details
The management of the Company will host an Earnings
call to discuss the Company’s financial performance and answer any questions from the participants.
Date: May 7, 2024
Time: 19:30 pm IST | 10:00 am ET
| Conference Joining Information |
| Option 1: Pre-register with the below link and join without waiting for the operator |
| https://services.choruscall.in/DiamondPassRegistration/register?confirmationNumber=9249934&linkSecurityString=380ecdb9f6 |
| Option 2: Join through below Dial-In Numbers |
|
Universal Access Number:
|
+91 22 6280 1219
+91 22 7115 8120 |
| International Toll-Free Number: |
USA: 1 866 746 2133
UK: 0 808 101 1573
Singapore: 800 101 2045
Hong Kong: 800 964 448 |
No password/pin number is necessary to dial in
to any of the above numbers. The operator will provide instructions on asking questions before and during the call.
Play Back: The play back will be available
after the earnings call, till May 14th, 2024. For play back dial in phone No: +91 22 7194 5757, and Playback Code is 40871.
Transcript: Transcript of the Earnings
call will be available on the Company’s website: www.drreddys.com
About Dr. Reddy’s: Dr. Reddy’s
Laboratories Ltd. (BSE: 500124, NSE: DRREDDY, NYSE: RDY, NSEIFSC: DRREDDY) is a global pharmaceutical company headquartered in Hyderabad,
India. Established in 1984, we are committed to providing access to affordable and innovative medicines. Driven by our purpose of ‘Good
Health Can’t Wait’, we offer a portfolio of products and services including APIs, generics, branded generics, biosimilars
and OTC. Our major therapeutic areas of focus are gastrointestinal, cardiovascular, diabetology, oncology, pain management and dermatology.
Our major markets include – USA, India, Russia & CIS countries, China, Brazil, and Europe. As a company with a history of deep
science that has led to several industry firsts, we continue to plan and invest in businesses of the future. As an early adopter of sustainability
and ESG actions, we released our first Sustainability Report in 2004. Our current ESG goals aim to set the bar high in environmental stewardship;
access and affordability for patients; diversity; and governance.
For more information, log on to: www.drreddys.com.
Disclaimer: This press release may include
statements of future expectations and other forward-looking statements that are based on the management’s current views and assumptions
and involve known or unknown risks and uncertainties that could cause actual results, performance, or events to differ materially from
those expressed or implied in such statements. In addition to statements which are forward-looking by reason of context, the words "may",
"will", "should", "expects", "plans", "intends", "anticipates", "believes",
"estimates", "predicts", "potential", or "continue" and similar expressions identify forward-looking
statements. Actual results, performance or events may differ materially from those in such statements due to without limitation, (i) general
economic conditions such as performance of financial markets, credit defaults , currency exchange rates , interest rates , persistency
levels and frequency / severity of insured loss events (ii) mortality and morbidity levels and trends, (iii) changing levels of competition
and general competitive factors, (iv) changes in laws and regulations and in the policies of central banks and/or governments, (v) the
impact of acquisitions or reorganization , including related integration issues, and (vi) the susceptibility of our industry and the markets
addressed by our, and our customers’, products and services to economic downturns as a result of natural disasters, epidemics, pandemics
or other widespread illness, including coronavirus (or COVID-19), and (vii) other risks and uncertainties identified in our public filings
with the Securities and Exchange Commission, including those listed under the "Risk Factors" and "Forward-Looking Statements"
sections of our Annual Report on Form 20-F for the year ended March 31, 2023. The company assumes no obligation to update any information
contained herein.” The company assumes no obligation to update any information contained herein.
Exhibit 99.3
 |
Dr. Reddy’s Laboratories Ltd.
8-2-337, Road No. 3, Banjara Hills,
Hyderabad - 500 034, Telangana,
India.
CIN : L85195TG1984PLC004507
Tel :+91 40 4900 2900
Fax :+91 40 4900 2999
Email :mail@drreddys.com
www.drreddys.com |
DR. REDDY'S LABORATORIES LIMITED
Audited consolidated financial results of Dr.
Reddy's Laboratories Limited and its subsidiaries for the quarter and year ended 31 March 2024 prepared in accordance with International
Financial Reporting Standards (IFRS) as issued by the International Accounting Standards Board (IASB)
| All amounts in Indian Rupees millions | |
| | | |
| |
Quarter ended | | |
Year ended | |
| | | |
| |
31.03.2024 | | |
31.12.2023 | | |
31.03.2023 | | |
31.03.2024 | | |
31.03.2023 | |
| Sl. No. | | |
Particulars | |
(Audited) | | |
(Unaudited) | | |
(Audited) | | |
(Audited) | | |
(Audited) | |
| | 1 | | |
Revenues | |
| 70,830 | | |
| 72,148 | | |
| 62,968 | | |
| 279,164 | | |
| 245,879 | |
| | 2 | | |
Cost of revenues | |
| 29,347 | | |
| 29,945 | | |
| 26,971 | | |
| 115,557 | | |
| 106,536 | |
| | 3 | | |
Gross profit (1 - 2) | |
| 41,483 | | |
| 42,203 | | |
| 35,997 | | |
| 163,607 | | |
| 139,343 | |
| | 4 | | |
Selling, general and administrative expenses | |
| 20,476 | | |
| 20,228 | | |
| 17,992 | | |
| 77,201 | | |
| 68,026 | |
| | 5 | | |
Research and development expenses | |
| 6,877 | | |
| 5,565 | | |
| 5,366 | | |
| 22,873 | | |
| 19,381 | |
| | 6 | | |
Impairment of non-current assets, net | |
| (173 | ) | |
| 110 | | |
| 540 | | |
| 3 | | |
| 699 | |
| | 7 | | |
Other income, net | |
| (656 | ) | |
| (967 | ) | |
| (281 | ) | |
| (4,199 | ) | |
| (5,907 | ) |
| | | | |
Total operating expenses | |
| 26,524 | | |
| 24,936 | | |
| 23,617 | | |
| 95,878 | | |
| 82,199 | |
| | 8 | | |
Results from operating activities [(3) - (4 + 5 + 6 + 7)] | |
| 14,959 | | |
| 17,267 | | |
| 12,380 | | |
| 67,729 | | |
| 57,144 | |
| | | | |
Finance income | |
| 1,615 | | |
| 1,357 | | |
| 1,153 | | |
| 5,705 | | |
| 4,281 | |
| | | | |
Finance expense | |
| (593 | ) | |
| (394 | ) | |
| (354 | ) | |
| (1,711 | ) | |
| (1,428 | ) |
| | 9 | | |
Finance income, net | |
| 1,022 | | |
| 963 | | |
| 799 | | |
| 3,994 | | |
| 2,853 | |
| | 10 | | |
Share of profit of equity accounted investees, net of tax | |
| 35 | | |
| 27 | | |
| 76 | | |
| 147 | | |
| 370 | |
| | 11 | | |
Profit before tax (8 + 9 + 10) | |
| 16,016 | | |
| 18,257 | | |
| 13,255 | | |
| 71,870 | | |
| 60,367 | |
| | 12 | | |
Tax expense, net | |
| 2,946 | | |
| 4,468 | | |
| 3,663 | | |
| 16,186 | | |
| 15,300 | |
| | 13 | | |
Profit for the period/year (11 -12) | |
| 13,070 | | |
| 13,789 | | |
| 9,592 | | |
| 55,684 | | |
| 45,067 | |
| | 14 | | |
Earnings per share: | |
| | | |
| | | |
| | | |
| | | |
| | |
| | | | |
Basic earnings per share of Rs.5/- each | |
| 78.49 | | |
| 82.81 | | |
| 57.74 | | |
| 334.65 | | |
| 271.43 | |
| | | | |
Diluted earnings per share of Rs.5/- each | |
| 78.35 | | |
| 82.68 | | |
| 57.62 | | |
| 334.02 | | |
| 270.85 | |
| | | | |
| |
| (Not annualised) | | |
| (Not annualised) | | |
| (Not annualised) | | |
| | | |
| | |

| Segment information | |
All amounts in Indian Rupees millions | |
| | | |
| |
Quarter ended | | |
Year ended | |
| | | |
| |
31.03.2024 | | |
31.12.2023 | | |
31.03.2023 | | |
31.03.2024 | | |
31.03.2023 | |
| Sl. No. | | |
Particulars | |
(Audited) | | |
(Unaudited) | | |
(Audited) | | |
(Audited) | | |
(Audited) | |
| | | | |
Segment wise revenue and results: | |
| | | |
| | | |
| | | |
| | | |
| | |
| | 1 | | |
Segment revenue: | |
| | | |
| | | |
| | | |
| | | |
| | |
| | | | |
a) Pharmaceutical Services and Active Ingredients | |
| 11,526 | | |
| 10,390 | | |
| 10,261 | | |
| 40,580 | | |
| 36,646 | |
| | | | |
b) Global Generics | |
| 61,191 | | |
| 63,095 | | |
| 54,257 | | |
| 245,453 | | |
| 213,768 | |
| | | | |
c) Others | |
| 1,420 | | |
| 1,214 | | |
| 924 | | |
| 3,910 | | |
| 3,042 | |
| | | | |
Total | |
| 74,137 | | |
| 74,699 | | |
| 65,442 | | |
| 289,943 | | |
| 253,456 | |
| | | | |
Less: Inter-segment revenues | |
| 3,307 | | |
| 2,551 | | |
| 2,474 | | |
| 10,779 | | |
| 7,577 | |
| | | | |
Total Revenues | |
| 70,830 | | |
| 72,148 | | |
| 62,968 | | |
| 279,164 | | |
| 245,879 | |
| | | | |
| |
| | | |
| | | |
| | | |
| | | |
| | |
| | 2 | | |
Segment results: | |
| | | |
| | | |
| | | |
| | | |
| | |
| | | | |
Gross profit from each segment | |
| | | |
| | | |
| | | |
| | | |
| | |
| | | | |
a) Pharmaceutical Services and Active Ingredients | |
| 2,350 | | |
| 2,306 | | |
| 1,963 | | |
| 6,919 | | |
| 4,715 | |
| | | | |
b) Global Generics | |
| 37,933 | | |
| 39,075 | | |
| 33,498 | | |
| 154,268 | | |
| 132,719 | |
| | | | |
c) Others | |
| 1,200 | | |
| 822 | | |
| 536 | | |
| 2,420 | | |
| 1,909 | |
| | | | |
Total | |
| 41,483 | | |
| 42,203 | | |
| 35,997 | | |
| 163,607 | | |
| 139,343 | |
| | | | |
Less: Selling and other un-allocable expenditure, net of other income | |
| 25,467 | | |
| 23,946 | | |
| 22,742 | | |
| 91,737 | | |
| 78,976 | |
| | | | |
Total profit before tax | |
| 16,016 | | |
| 18,257 | | |
| 13,255 | | |
| 71,870 | | |
| 60,367 | |
Global Generics segment includes operations of
Biologics business. Inter-segment revenues represent sale from Pharmaceutical Services and Active Ingredients to Global Generics and Others
at cost.
Segmental capital employed
As certain assets of the Company including manufacturing facilities,
development facilities, treasury assets and liabilities are often deployed interchangeably across segments, it is impractical to allocate
these assets and liabilities to each segment. Hence, the details for capital employed have not been disclosed in the above table.
Notes:
| 1 | The above statement of financial results of Dr.Reddy's Laboratories Limited ("the Company"), which have been prepared in
accordance with recognition and measurement principles as issued by the International Accounting Standards Board (IASB) and were reviewed
and recommended by Audit Committee and approved by the Board of Directors at their meetings held on 07 May 2024. The Independent Auditors
have issued an unqualified report thereon. |
| 2 | Revenues for the year ended 31 March 2023 includes :
a) Rs. 2,640 million from sale of certain non-core dermatology brands to Eris Lifesciences Limited for the quarter ended 31 March 2023;
b) Rs. 1,399 million from sale of brands Styptovit-E, Finast, Finast-T and Dynapres to Torrent Pharmaceuticals Limited;
c) Rs. 902 million from sale of brands Z&D, Pedicloryl, Pecef and Ezinapi to J B Chemicals and Pharmaceuticals Limited.
The amounts recognised above are adjusted for expected sales returns. These transactions pertain to Company’s Global Generics segment. |
| 3 | During the quarter and year ended 31 March 2024, an amount of Rs. 810 million and Rs. 4,232 million
respectively, and during the quarter and year ended 31 March 2023, an amount of Rs. 305 million and Rs. 3,111 million, respectively,
representing government grants has been accounted for as a reduction from cost of revenues. |
| 4 | "Impairment of non-current assets, net" for the year ended 31 March 2024 primarily includes:
a. Reversal of impairment loss of Rs. 226 million in March 2024, with respect to saxagliptin/metformin (generic version of Kombiglyze®
- XR) and enalaprilat (generic version of Vasotec®) pursuant to launch of these two products during the year.
The Company re-assessed the recoverable amount pursuant to favorable market conditions and change in circumstances that led to initial
impairment during year ended 31 March 2021 by revisiting the market volumes, share and price assumptions of these two products and accordingly,
capitalized under product related intangibles with corresponding reversal of impairment loss of Rs. 191 million and Rs. 35 million respectively.
This impairment loss pertains to the Company’s Global Generics segment
b. Consequent to adverse market conditions with respect to certain products related intangibles and software platforms, the Company assessed
the recoverable amount of certain products and recognized impairment loss of Rs. 86 million and Rs. 99 million pertaining to products
and software platforms forming part of the Company’s Global Generics and Others segment, respectively. |
| 5 | During the quarter ended 31 March 2023, Company considered a total impairment of Rs. 540 million towards:
a. The Company assessed performance of business acquired from Nimbus Health GmbH against the initial estimates and performance of the
products. Basis the assessment, the Company had recorded an impairment charge of the carrying values amounting to Rs. 375 million (Goodwill-
Rs. 272 million and Other intangibles- Rs. 103 million). The said impairment charge pertains to the Company’s Global Generics segment.
b. Consequent to adverse market conditions with respect to certain of the Company’s products related intangibles forming part of
the Company’s Global Generics and Pharmaceutical Services and Active Ingredients segments, the Company assessed the recoverable
amount of these products and recognised an amount of Rs. 165 million as impairment charge during the quarter ended 31 March 2023. |
| 6 | “Other income, net” for the year ended 31 March 2024 includes:
a. Rs. 540 million recognised, in April 2023, pursuant to settlement agreement with Janssen Group in settlement of the claim brought in
the Federal Court of Canada by the Company and its affiliates for damages under section 8 of the Canadian Patented Medicines (Notice of
Compliance) Regulations in regard to the Company’s ANDS for a generic version of Zytiga®(Abiraterone).
b. Rs. 984 million recognised pursuant to settlement of product related litigation by the Company and its affiliates in the United Kingdom.
These transactions pertains to the Company's Global Generics segment. |
| 7 | “Other income, net” for the year ended 31 March 2023 includes:
a. Rs. 991 million representing the loss on sale of assets recognised in December 2022, pursuant to agreement dated 16 December 2022 with
Delpharm Development Leiden B.V (Delpharm) for transfer of certain assets, liabilities and employees at its site at Leiden, Netherlands.This
transaction pertains to Company’s Global Generics segment.
b. Rs. 5,638 million (U.S.$71.39 million discounted to present value) recognised in June 2022 towards the settlement of an ongoing litigation
relating to launch of a product with Indivior Inc., Indivior UK Limited and Aquestive Therapeutics, Inc. |
| 8 | The Company considered the uncertainties relating to the escalation of conflict in the middle east, and duration of military conflict
between Russia and Ukraine, in assessing the recoverability of receivables, goodwill, intangible assets, investments and other assets.
For this purpose, the Company considered internal and external sources of information up to the date of approval of these financial results.
Based on its judgments, estimates and assumptions, including sensitivity analysis, the Company expects to fully recover the carrying amount
of receivables, goodwill, intangible assets, investments and other assets. The Company will continue to closely monitor any material changes
to future economic conditions. |
| 9 | The Company received an anonymous complaint in September 2020, alleging that healthcare professionals in Ukraine and potentially in
other countries were provided with improper payments by or on behalf of the Company in violation of U.S. anti-corruption laws, specifically
the U.S. Foreign Corrupt Practices Act. The Company disclosed the matter to the U.S. Department of Justice (“DOJ”), Securities
and Exchange Commission (“SEC”) and Securities Exchange Board of India. The Company engaged a U.S. law firm to conduct the
investigation at the instruction of a committee of the Company’s Board of Directors. On 06 July 2021, the Company received a subpoena
from the SEC for the production of related documents, which were provided to the SEC. |
During the previous years, the Company made presentations to the SEC
and the DOJ in relation to the investigation in the aforementioned countries, and in relation to its Global Compliance Framework, which
includes enhancement initiatives undertaken by the Company. The Company continues to respond to the requests made by the SEC and the DOJ
and is complying with its listing obligations as it relates to updating the regulatory agencies. While the findings from the aforesaid
investigations could result in government or regulatory enforcement actions against the Company in the United States and/or foreign jurisdictions
and can also lead to civil and criminal sanctions under relevant laws, the outcomes, including liabilities, are not reasonably ascertainable
at this time.
| 10 | Consolidated statements of financial position |
| All amounts in Indian Rupees millions | |
| | |
As at | | |
As at | |
| | |
31.03.2024 | | |
31.03.2023 | |
| Particulars | |
(Audited) | | |
(Audited) | |
| ASSETS | |
| | | |
| | |
| Current assets | |
| | | |
| | |
| Cash and cash equivalents | |
| 7,107 | | |
| 5,779 | |
| Other investments | |
| 74,363 | | |
| 56,018 | |
| Trade and other receivables | |
| 80,298 | | |
| 72,485 | |
| Inventories | |
| 63,552 | | |
| 48,670 | |
| Derivative financial instruments | |
| 169 | | |
| 1,232 | |
| Other current assets | |
| 22,560 | | |
| 20,069 | |
| Total current assets | |
| 248,049 | | |
| 204,253 | |
| Non-current assets | |
| | | |
| | |
| Property, plant and equipment | |
| 76,886 | | |
| 66,462 | |
| Goodwill | |
| 4,253 | | |
| 4,245 | |
| Other intangible assets | |
| 36,951 | | |
| 30,849 | |
| Investment in equity accounted investees | |
| 4,196 | | |
| 4,702 | |
| Other investments | |
| 1,059 | | |
| 660 | |
| Deferred tax assets | |
| 10,774 | | |
| 7,196 | |
| Tax assets | |
| 3,718 | | |
| 2,687 | |
| Other non-current assets | |
| 1,632 | | |
| 800 | |
| Total non-current assets | |
| 139,469 | | |
| 117,601 | |
| Total assets | |
| 387,518 | | |
| 321,854 | |
| | |
| | | |
| | |
| LIABILITIES AND EQUITY | |
| | | |
| | |
| Current liabilities | |
| | | |
| | |
| Trade and other payables | |
| 30,919 | | |
| 26,444 | |
| Short-term borrowings | |
| 12,723 | | |
| 7,390 | |
| Long-term borrowings, current portion | |
| 1,307 | | |
| 4,804 | |
| Provisions | |
| 5,383 | | |
| 5,454 | |
| Tax liabilities | |
| 2,342 | | |
| 2,144 | |
| Derivative financial instruments | |
| 468 | | |
| 137 | |
| Other current liabilities | |
| 42,897 | | |
| 39,472 | |
| Total current liabilities | |
| 96,039 | | |
| 85,845 | |
| Non-current liabilities | |
| | | |
| | |
| Long-term borrowings | |
| 5,990 | | |
| 1,278 | |
| Deferred tax liabilities | |
| 909 | | |
| 833 | |
| Provisions | |
| 61 | | |
| 59 | |
| Other non-current liabilities | |
| 3,969 | | |
| 2,848 | |
| Total non-current liabilities | |
| 10,929 | | |
| 5,018 | |
| Total liabilities | |
| 106,968 | | |
| 90,863 | |
| Equity | |
| | | |
| | |
| Share capital | |
| 834 | | |
| 833 | |
| Treasury shares | |
| (991 | ) | |
| (1,269 | ) |
| Share premium | |
| 10,765 | | |
| 9,688 | |
| Share based payment reserve | |
| 1,508 | | |
| 1,652 | |
| Capital redemption reserve | |
| 173 | | |
| 173 | |
| Debenture redemption reserve | |
| - | | |
| 380 | |
| Special economic zone re-investment reserve | |
| 653 | | |
| 886 | |
| Retained earnings | |
| 265,257 | | |
| 215,593 | |
| Other components of equity | |
| 2,351 | | |
| 3,055 | |
| Total equity | |
| 280,550 | | |
| 230,991 | |
| Total liabilities and equity | |
| 387,518 | | |
| 321,854 | |
| |
11 |
Consolidated statements of cash flows |
| All amounts in Indian Rupees millions |
| | |
Year ended | |
| | |
31.03.2024 | | |
31.03.2023 | |
| Particulars | |
(Audited) | | |
(Audited) | |
| Cash flows from/(used in) operating activities : | |
| | | |
| | |
| Profit for the year | |
| 55,684 | | |
| 45,067 | |
| Adjustments for: | |
| | | |
| | |
| Tax expense, net | |
| 16,186 | | |
| 15,300 | |
| Fair value changes and profit on sale of financial instruments measured at FVTPL**, net | |
| (3,149 | ) | |
| (876 | ) |
| Depreciation and amortization | |
| 14,841 | | |
| 12,636 | |
| Impairment of non-current assets, net | |
| 3 | | |
| 699 | |
| Allowance for credit losses (on trade receivables and other advances) | |
| 275 | | |
| 205 | |
| (Gain)/loss on sale or de-recognition of non-current assets, net | |
| (900 | ) | |
| 208 | |
| Share of profit of equity accounted investees | |
| (147 | ) | |
| (370 | ) |
| Unrealized exchange (gain)/loss, net | |
| (534 | ) | |
| (939 | ) |
| Interest (income)/expense, net | |
| (567 | ) | |
| 248 | |
| Inventories write-down | |
| 3,563 | | |
| 4,869 | |
| Equity settled share-based payment expense | |
| 407 | | |
| 397 | |
| Dividend income | |
| - | * | |
| - | * |
| Changes in operating assets and liabilities: | |
| | | |
| | |
| Trade and other receivables | |
| (8,054 | ) | |
| (5,752 | ) |
| Inventories | |
| (18,445 | ) | |
| (2,654 | ) |
| Trade and other payables | |
| 3,460 | | |
| 23 | |
| Other assets and other liabilities, net | |
| 2,857 | | |
| 528 | |
| Cash generated from operations | |
| 65,480 | | |
| 69,589 | |
| Income tax paid, net | |
| (20,047 | ) | |
| (10,714 | ) |
| Net cash generated from operating activities | |
| 45,433 | | |
| 58,875 | |
| Cash flows from/(used in) investing activities : | |
| | | |
| | |
| Purchase of property, plant and equipment | |
| (16,403 | ) | |
| (11,323 | ) |
| Proceeds from sale of property, plant and equipment | |
| 1,064 | | |
| 82 | |
| Purchase of other intangible assets | |
| (11,032 | ) | |
| (7,543 | ) |
| Proceeds from sale of other intangible assets | |
| 21 | | |
| - | |
| Investment in associates | |
| (12 | ) | |
| - | |
| Purchase of other investments (incuding bank deposits) | |
| (145,488 | ) | |
| (136,171 | ) |
| Proceeds from sale of other investments (incuding bank deposits) | |
| 129,784 | | |
| 112,805 | |
| Dividend received from equity accounted investees | |
| 445 | | |
| - | |
| Interest and dividend received | |
| 1,338 | | |
| 777 | |
| Net cash used in investing activities | |
| (40,283 | ) | |
| (41,373 | ) |
| Cash flows from/(used in) financing activities : | |
| | | |
| | |
| Proceeds from issuance of equity shares (including treasury shares) | |
| 805 | | |
| 157 | |
| Proceeds from sale of treasury shares | |
| - | | |
| 211 | |
| Proceeds from/(Repayment of) short-term loans and borrowings, net | |
| 5,493 | | |
| (19,382 | ) |
| Proceeds from long-term borrowings | |
| 3,800 | | |
| - | |
| Repayment of long-term borrowings | |
| (3,800 | ) | |
| - | |
| Payment of principal portion of lease liabilities | |
| (1,147 | ) | |
| (1,015 | ) |
| Dividend paid | |
| (6,648 | ) | |
| (4,979 | ) |
| Interest paid | |
| (2,266 | ) | |
| (1,853 | ) |
| Net cash used in financing activities | |
| (3,763 | ) | |
| (26,861 | ) |
| Net increase/(decrease) in cash and cash equivalents | |
| 1,387 | | |
| (9,359 | ) |
| Effect of exchange rate changes on cash and cash equivalents | |
| (59 | ) | |
| 286 | |
| Cash and cash equivalents at the beginning of the year | |
| 5,779 | | |
| 14,852 | |
| Cash and cash equivalents at the end of the year | |
| 7,107 | | |
| 5,779 | |
| ** | FVTPL (fair value through profit or loss) |
| |
12 |
The Board of Directors, at their meeting held on 07 May 2024, have recommended a final dividend of Rs.40 per share subject to approval of shareholders.
|
| |
13 |
The figures of the fourth quarter are the balancing figures between audited figures in respect of the full financial year and the published year to date figures upto the third quarter of the relevant financial year. Also the figures upto the end of third quarter were only reviewed and not subjected to audit. Previous period figures have been regrouped/rearranged, wherever necessary. |
| |
By order of the Board |
| |
For Dr. Reddy's Laboratories Limited |
| |
|
 |
| Place:
Hyderabad |
G V Prasad |
| Date: 07
May 2024 |
Co-Chairman & Managing Director |

Exhibit 99.4
|
S.R. Batliboi & Associates LLP
Chartered Accountants |
THE SKYVIEW 10
18th Floor, "NORTH LOBBY"
Survey No. 83/1, Raidurgam
Hyderabad - 500 032, India
Tel: +91 40 6141 6000 |
Independent Auditor’s Report on the Quarterly
and Year to Date Consolidated Financial Results of the Company Pursuant to the Regulation 33 of the SEBI (Listing Obligations and Disclosure
Requirements) Regulations, 2015, as amended
To
The Board of Directors of
Dr. Reddy’s Laboratories Limited
Report on the audit of the Consolidated Financial
Results
Opinion
We have audited the accompanying Statement of
Audited Consolidated Financial Results for the quarter and year ended 31 March 2024 (“Statement”) of Dr. Reddy’s Laboratories
Limited (“Holding Company”) and its subsidiaries (the Holding Company and its subsidiaries together referred to as “the
Group”), its associate and joint ventures for the quarter and year ended March 31, 2024, attached herewith, being submitted by the
Holding Company pursuant to the requirement of Regulation 33 of the SEBI (Listing Obligations and Disclosure Requirements) Regulations,
2015, as amended (“Listing Regulations”) .
In our opinion and to the best of our information
and according to the explanations given to us and based on the consideration of the reports of the other auditors on separate audited
financial statements of the subsidiary referred to in the Other Matters paragraph below, the Statement:
(i) includes the
results of the following entities:
Holding Company:
| 1. | Dr. Reddy’s Laboratories Limited |
Subsidiaries
| 1. | Aurigene Oncology limited |
| 2. | Cheminor Investments Limited |
| 3. | Dr. Reddy’s Bio-Sciences Limited |
| 4. | Dr. Reddy’s Formulations Limited |
| 5. | Dr. Reddy’s Farmaceutica Do Brasil Ltda. |
| 6. | Dr. Reddy's Laboratories SA |
| 7. | Idea2Enterprises (India) Private Limited |
| 8. | Imperial Owners and Land Possessions Private Limited (Formerly Imperial Credit Private Limited) |
| 9. | Industrias Quimicas Falcon de Mexico, S.A.de C.V. |
| 10. | Svaas Wellness Limited |
| 11. | Aurigene Discovery Technologies (Malaysia) Sdn. Bhd. |
| 12. | Aurigene Pharmaceutical Services Limited |
| 13. | beta Institut gemeinnützige GmbH |
| 14. | betapharm Arzneimittel GmbH |
| 15. | Chirotech Technology Limited |
| 17. | Dr. Reddy’s Laboratories (Australia) Pty. Limited |
| 18. | Dr. Reddy’s (Beijing) Pharmaceutical Co. Limited |
| 19. | Dr. Reddy’s Laboratories Canada, Inc. |
| 20. | Dr. Reddy's Laboratories Chile SPA. |
| 21. | Dr. Reddy’s Laboratories (EU) Limited |
| 22. | Dr. Reddy’s Laboratories Inc. |
| 23. | Dr. Reddy's Laboratories Japan KK |
| 24. | Dr. Reddy’s Laboratories Kazakhstan LLP |
| 25. | Dr. Reddy’s Laboratories LLC, Ukraine |
| 26. | Dr. Reddy's Laboratories Louisiana LLC |
| 27. | Dr. Reddy’s Laboratories Malaysia Sdn. Bhd. |

S.R. Batliboi & Associates LLP, a Limited Liability
Partnership with LLP Identity No. AAB-4295
Regd. Office: 22, Camac Street, Block ‘B’,
3rd Floor, Kolkata-700 016
S.R. Batliboi & Associates LLP
Chartered Accountants
| | 28. | Dr. Reddy’s Laboratories New York, LLC |
| 29. | Dr. Reddy's Laboratories Philippines Inc. |
| 30. | Dr. Reddy’s Laboratories (Proprietary) Limited |
| 31. | Dr. Reddy's Laboratories Romania S.R.L. |
| 32. | Dr. Reddy's Laboratories SAS |
| 33. | Dr. Reddy's Laboratories Taiwan Limited |
| 34. | Dr. Reddy's Laboratories (Thailand) Limited |
| 35. | Dr. Reddy’s Laboratories (UK) Limited |
| 36. | Dr. Reddy’s New Zealand Limited |
| 37. | Dr. Reddy's Research and Development B.V. |
| 39. | Dr. Reddy's Venezuela, C.A. |
| 40. | Dr. Reddy’s Laboratories LLC, Russia |
| 41. | Lacock Holdings Limited |
| 44. | Reddy Netherlands B.V. |
| 45. | Reddy Pharma Iberia SAU |
| 46. | Reddy Pharma Italia S.R.L |
| 49. | Dr. Reddy’s Laboratories Jamaica Limited (effective from September 25, 2023) |
| 50. | Dr. Reddy’s Nutraceuticals Limited (effective from March 14, 2024) |
| 1. | O2 Renewable Energy IX Private Limited (effective from November 10, 2023) |
Joint
ventures
| 1. | DRES Energy Private Limited |
| 2. | Kunshan Rotam Reddy Pharmaceutical Company Limited |
Other consolidating
entities
| 1. | Cheminor Employees Welfare Trust |
| 2. | Dr. Reddy’s Research Foundation |
| i. | are presented in accordance with the requirements of the Listing Regulations in this regard; and |
| ii. | gives a true and fair view in conformity with the applicable accounting standards, and other accounting
principles generally accepted in India, of the consolidated net profit and other comprehensive loss and other financial information of
the Group, its associate and joint ventures for the quarter and year ended March 31, 2024. |
Basis for Opinion
We conducted our audit in accordance with the
Standards on Auditing (SAs), as specified under Section 143(10) of the Companies Act, 2013, as amended (“the Act”). Our
responsibilities under those Standards are further described in the “Auditor’s Responsibilities for the Audit of the Consolidated
Financial Results” section of our report. We are independent of the Group, its associate and joint ventures in accordance with the
‘Code of Ethics’ issued by the Institute of Chartered Accountants of India together with the ethical requirements that are
relevant to our audit of the financial statements under the provisions of the Act and the Rules thereunder, and we have fulfilled our
other ethical responsibilities in accordance with these requirements and the Code of Ethics. We believe that the audit evidence obtained
by us and other auditors in terms of their reports referred to in “Other Matter” paragraph below, is sufficient and appropriate
to provide a basis for our opinion.
S.R. Batliboi & Associates LLP
Chartered Accountants
Management’s Responsibilities for the Consolidated Financial
Results
The Statement has been prepared on the basis of
the consolidated annual financial statements. The Holding Company’s Board of Directors are responsible for the preparation and presentation
of the Statement that give a true and fair view of the net profit and other comprehensive loss and other financial information of the
Group including its associate and joint ventures in accordance with the applicable accounting standards prescribed under section 133 of
the Act read with relevant rules issued thereunder and other accounting principles generally accepted in India and in compliance with
Regulation 33 of the Listing Regulations. The respective Board of Directors of the companies included in the Group and of its associate
and joint ventures are responsible for maintenance of adequate accounting records in accordance with the provisions of the Act for safeguarding
of the assets of their respective companies and for preventing and detecting frauds and other irregularities; selection and application
of appropriate accounting policies; making judgments and estimates that are reasonable and prudent; and the design, implementation and
maintenance of adequate internal financial controls, that were operating effectively for ensuring the accuracy and completeness of the
accounting records, relevant to the preparation and presentation of the Statement that give a true and fair view and are free from material
misstatement, whether due to fraud or error, which have been used for the purpose of preparation of the Statement by the Directors of
the Holding Company, as aforesaid.
In preparing the Statement, the respective Board
of Directors of the companies included in the Group and of its associate and joint ventures are responsible for assessing the ability
of their respective companies to continue as a going concern, disclosing, as applicable, matters related to going concern and using the
going concern basis of accounting unless the respective Board of Directors either intends to liquidate the companies or to cease operations,
or has no realistic alternative but to do so.
The respective Board of Directors of the companies
included in the Group and of its associate and joint ventures are also responsible for overseeing the financial reporting process of their
respective companies.
Auditor’s Responsibilities for the Audit
of the Consolidated Financial Results
Our objectives are to obtain reasonable assurance
about whether the Statement as a whole is free from material misstatement, whether due to fraud or error, and to issue an auditor’s
report that includes our opinion. Reasonable assurance is a high level of assurance, but is not a guarantee that an audit conducted in
accordance with SAs will always detect a material misstatement when it exists. Misstatements can arise from fraud or error and are considered
material if, individually or in the aggregate, they could reasonably be expected to influence the economic decisions of users taken on
the basis of the Statement.
As part of an audit in accordance with SAs, we
exercise professional judgment and maintain professional skepticism throughout the audit. We also:
| · | Identify and assess the risks of material misstatement
of the Statement, whether due to fraud or error, design and perform audit procedures responsive to those risks, and obtain audit evidence
that is sufficient and appropriate to provide a basis for our opinion. The risk of not detecting a material misstatement resulting from
fraud is higher than for one resulting from error, as fraud may involve collusion, forgery, intentional omissions, misrepresentations,
or the override of internal control. |
| · | Obtain an understanding of internal control relevant
to the audit in order to design audit procedures that are appropriate in the circumstances. Under Section 143(3)(i) of the Act, we are
also responsible for expressing our opinion on whether the company has adequate internal financial controls with reference to financial
statements in place and the operating effectiveness of such controls. |
| · | Evaluate the appropriateness of accounting policies
used and the reasonableness of accounting estimates and related disclosures made by the Board of Directors. |
| · | Conclude on the appropriateness of the Board
of Directors’ use of the going concern basis of accounting and, based on the audit evidence obtained, whether a material uncertainty
exists related to events or conditions that may cast significant doubt on the ability of the Group and its associate and joint ventures
to continue as a going concern. If we conclude that a material uncertainty exists, we are required to draw attention in our auditor’s
report to the related disclosures in the Statement or, if such disclosures are inadequate, to modify our opinion. Our conclusions are
based on the audit evidence obtained up to the date of our auditor’s report. However, future events or conditions may cause the
Group and its associate and joint ventures to cease to continue as a going concern. |
S.R. Batliboi & Associates LLP
Chartered Accountants
| · | Evaluate the overall presentation, structure
and content of the Statement, including the disclosures, and whether the Statement represent the underlying transactions and events in
a manner that achieves fair presentation. |
| · | Obtain sufficient appropriate audit evidence
regarding the financial results/financial information of the entities within the Group of which we are the independent auditors and whose
financial information we have audited, to express an opinion on the Statement. We are responsible for the direction, supervision and performance
of the audit of the financial information of such entities included in the Statement of which we are the independent auditors. For the
other entities included in the Statement, which have been audited by other auditors, such other auditors remain responsible for the direction,
supervision and performance of the audits carried out by them. We remain solely responsible for our audit opinion. |
We communicate with those charged with governance
of the Holding Company and such other entities included in the Statement of which we are the independent auditors regarding, among other
matters, the planned scope and timing of the audit and significant audit findings, including any significant deficiencies in internal
control that we identify during our audit. We also provide those charged with governance with a statement that we have complied with relevant
ethical requirements regarding independence, and to communicate with them all relationships and other matters that may reasonably be thought
to bear on our independence, and where applicable, related safeguards.
We also performed procedures in accordance with
the Master Circular issued by the Securities Exchange Board of India under Regulation 33 (8) of the Listing Regulations, to the extent
applicable.
Other Matters
| 1. | The accompanying Statement includes the audited financial statements and other financial information,
in respect of one subsidiary, whose financial statements include total assets of Rs 13,142 million as at March 31, 2024, total revenues
of Rs 4,700 million and Rs 21,391 million total net profit after tax of Rs. 100 million and Rs. 1,079 million, total comprehensive income
of Rs. 100 million and Rs. 1,079 million, for the quarter and year ended on that date respectively, and net cash inflows of Rs. 554
million for the year ended March 31, 2024, as considered in the Statement which have been audited by their auditors. The auditor’s
report on the financial statements and other financial information of this entity has been furnished to us by the Management and our opinion
on the Statement, in so far as it relates to the amounts and disclosures included in respect of this subsidiary is based solely on such
audited financial statements and other financial information. |
| 2. | The accompanying Statement includes the unaudited financial results and other unaudited financial information,
in respect of one associate and two joint ventures, whose financial results include the Group’s share of net profit of Rs. 147 million
and Rs. 147 million and Group’s share of total comprehensive income of Rs. 147 million and Rs. 147 million for the quarter and year
ended March 31, 2024 respectively, as considered in the Statement whose financial results have not been audited by their respective
auditors. These unaudited financial results and other unaudited financial information have been approved and furnished to us by the Management
and our opinion on the Statement, in so far as it relates to the amounts and disclosures included in respect of this associate and joint
venture, is based solely on such unaudited financial results and other unaudited financial information. In our opinion and according to
the information and explanations given to us by the Management, these financial results are not material to the Group. |
Our opinion on the Statement is not modified in
respect of the above matters with respect to our reliance on the work done and the reports of the other auditors and the financial results/financial
information certified by the Management.
S.R. Batliboi & Associates LLP
Chartered Accountants
| 3. | The Statement includes the results for the quarter ended March 31, 2024 being the balancing
figures between the audited figures in respect of the full financial year ended March 31, 2024 and the published unaudited year-to-date
figures up to the end of the third quarter of the current financial year, which were subjected to a limited review by us, as required
under the Listing Regulations. |
For S.R. BATLIBOI & ASSOCIATES LLP
Chartered Accountants
ICAI Firm Registration
Number: 101049W/E300004
 |
 |
| per Shankar Srinivasan |
| Partner |
| Membership No.: 213271 |
| |
| UDIN: 24213271BKELCI9910 |
| |
| Place: Hyderabad |
| Date: May 07, 2024 |
 |
Dr. Reddy’s Laboratories Ltd.
8-2-337, Road No. 3, Banjara Hills,
Hyderabad - 500 034, Telangana,
India.
CIN : L85195TG1984PLC004507
Tel :+91 40 4900 2900
Fax :+91 40 4900 2999
Email :mail@drreddys.com
www.drreddys.com |
DR. REDDY'S LABORATORIES LIMITED
STATEMENT OF AUDITED CONSOLIDATED FINANCIAL
RESULTS FOR THE QUARTER AND YEAR ENDED 31 MARCH 2024
All amounts in Indian Rupees millions
| | | |
| |
Quarter ended | | |
Year ended | |
| | | |
| |
31.03.2024 | | |
31.12.2023 | | |
31.03.2023 | | |
31.03.2024 | | |
31.03.2023 | |
| Sl. No. | | |
Particulars | |
(Audited) | | |
(Unaudited) | | |
(Audited) | | |
(Audited) | | |
(Audited) | |
| | | |
| |
| | |
| | |
| | |
| | |
| |
| | 1 | | |
Revenue from operations | |
| | | |
| | | |
| | | |
| | | |
| | |
| | | | |
a) Sales | |
| 68,258 | | |
| 69,647 | | |
| 58,430 | | |
| 271,396 | | |
| 234,595 | |
| | | | |
b) License fees and service income | |
| 2,572 | | |
| 2,501 | | |
| 4,539 | | |
| 7,768 | | |
| 11,284 | |
| | | | |
c) Other operating income | |
| 308 | | |
| 220 | | |
| 183 | | |
| 947 | | |
| 818 | |
| | | | |
| |
| | | |
| | | |
| | | |
| | | |
| | |
| | | | |
Total revenue from operations | |
| 71,138 | | |
| 72,368 | | |
| 63,152 | | |
| 280,111 | | |
| 246,697 | |
| | | | |
| |
| | | |
| | | |
| | | |
| | | |
| | |
| | 2 | | |
Other income | |
| 1,975 | | |
| 2,162 | | |
| 1,385 | | |
| 8,943 | | |
| 10,555 | |
| | | | |
| |
| | | |
| | | |
| | | |
| | | |
| | |
| | 3 | | |
Total income (1 + 2) | |
| 73,113 | | |
| 74,530 | | |
| 64,537 | | |
| 289,054 | | |
| 257,252 | |
| | | | |
| |
| | | |
| | | |
| | | |
| | | |
| | |
| | 4 | | |
Expenses | |
| | | |
| | | |
| | | |
| | | |
| | |
| | | | |
a) Cost of materials consumed | |
| 10,962 | | |
| 11,412 | | |
| 10,728 | | |
| 44,901 | | |
| 42,198 | |
| | | | |
b) Purchase of stock-in-trade | |
| 11,759 | | |
| 12,083 | | |
| 7,667 | | |
| 43,991 | | |
| 33,670 | |
| | | | |
c) Changes in inventories of finished goods, work-in-progress and stock-in-trade | |
| (1,800 | ) | |
| (1,735 | ) | |
| 586 | | |
| (6,805 | ) | |
| 709 | |
| | | | |
d) Employee benefits expense | |
| 12,836 | | |
| 12,764 | | |
| 12,760 | | |
| 50,301 | | |
| 46,466 | |
| | | | |
e) Depreciation and amortisation expense | |
| 3,677 | | |
| 3,735 | | |
| 3,155 | | |
| 14,700 | | |
| 12,502 | |
| | | | |
f) Impairment of non-current assets, net | |
| (173 | ) | |
| 110 | | |
| 540 | | |
| 3 | | |
| 699 | |
| | | | |
g) Finance costs | |
| 593 | | |
| 394 | | |
| 354 | | |
| 1,711 | | |
| 1,428 | |
| | | | |
h) Other expenses | |
| 19,242 | | |
| 17,503 | | |
| 15,532 | | |
| 68,389 | | |
| 59,465 | |
| | | | |
Total expenses | |
| 57,096 | | |
| 56,266 | | |
| 51,322 | | |
| 217,191 | | |
| 197,137 | |
| | 5 | | |
Profit before tax and before share of equity accounted investees(3 - 4) | |
| 16,017 | | |
| 18,264 | | |
| 13,215 | | |
| 71,863 | | |
| 60,115 | |
| | | | |
| |
| | | |
| | | |
| | | |
| | | |
| | |
| | 6 | | |
Share of profit of equity accounted investees, net of tax | |
| 35 | | |
| 27 | | |
| 76 | | |
| 147 | | |
| 370 | |
| | | | |
| |
| | | |
| | | |
| | | |
| | | |
| | |
| | 7 | | |
Profit before tax (5+6) | |
| 16,052 | | |
| 18,291 | | |
| 13,291 | | |
| 72,010 | | |
| 60,485 | |
| | | | |
| |
| | | |
| | | |
| | | |
| | | |
| | |
| | 8 | | |
Tax expense/(benefit): | |
| | | |
| | | |
| | | |
| | | |
| | |
| | | | |
a) Current tax | |
| 2,823 | | |
| 3,538 | | |
| 4,279 | | |
| 19,459 | | |
| 8,144 | |
| | | | |
b) Deferred tax | |
| 131 | | |
| 944 | | |
| (589 | ) | |
| (3,228 | ) | |
| 7,268 | |
| | | | |
| |
| | | |
| | | |
| | | |
| | | |
| | |
| | 9 | | |
Net profit after taxes and share of profit of associates (7 - 8) | |
| 13,098 | | |
| 13,809 | | |
| 9,601 | | |
| 55,779 | | |
| 45,073 | |
| | | | |
| |
| | | |
| | | |
| | | |
| | | |
| | |
| | 10 | | |
Other comprehensive income/(loss) | |
| | | |
| | | |
| | | |
| | | |
| | |
| | | | |
a) (i) Items that will not be reclassified subsequently to profit or loss | |
| (44 | ) | |
| 132 | | |
| 83 | | |
| (28 | ) | |
| (660 | ) |
| | | | |
(ii) Income tax relating to items that will not be reclassified to profit or loss | |
| 4 | | |
| - | | |
| (12 | ) | |
| 4 | | |
| (43 | ) |
| | | | |
b) (i) Items that will be reclassified subsequently to profit or loss | |
| (565 | ) | |
| 782 | | |
| 1,196 | | |
| (749 | ) | |
| 276 | |
| | | | |
(ii) Income tax relating to items that will be reclassified to profit or loss | |
| 48 | | |
| 78 | | |
| (342 | ) | |
| 117 | | |
| 306 | |
| | | | |
Total other comprehensive income/(loss) | |
| (557 | ) | |
| 992 | | |
| 925 | | |
| (656 | ) | |
| (121 | ) |
| | | | |
| |
| | | |
| | | |
| | | |
| | | |
| | |
| | 11 | | |
Total comprehensive income (9 + 10) | |
| 12,541 | | |
| 14,801 | | |
| 10,526 | | |
| 55,123 | | |
| 44,952 | |
| | | | |
| |
| | | |
| | | |
| | | |
| | | |
| | |
| | 12 | | |
Paid-up equity share capital (face value Rs. 5/- each) | |
| 834 | | |
| 834 | | |
| 833 | | |
| 834 | | |
| 833 | |
| | | | |
| |
| | | |
| | | |
| | | |
| | | |
| | |
| | 13 | | |
Other equity | |
| | | |
| | | |
| | | |
| 281,714 | | |
| 232,028 | |
| | | | |
| |
| | | |
| | | |
| | | |
| | | |
| | |
| | 14 | | |
Earnings per equity share (face value Rs. 5/- each) | |
| | | |
| | | |
| | | |
| | | |
| | |
| | | | |
| |
| | | |
| | | |
| | | |
| | | |
| | |
| | | | |
Basic | |
| 78.66 | | |
| 82.94 | | |
| 57.79 | | |
| 335.22 | | |
| 271.47 | |
| | | | |
Diluted | |
| 78.53 | | |
| 82.81 | | |
| 57.68 | | |
| 334.59 | | |
| 270.90 | |
| | | | |
| |
| (Not annualised) | | |
| (Not annualised) | | |
| (Not annualised) | | |
| | | |
| | |
See accompanying notes to the financial results
DR. REDDY'S LABORATORIES LIMITED
| Segment information | |
All amounts in Indian Rupees millions | |
| | | |
| |
Quarter ended | | |
Year ended | |
| | | |
| |
31.03.2024 | | |
31.12.2023 | | |
31.03.2023 | | |
31.03.2024 | | |
31.03.2023 | |
| Sl. No. | | |
Particulars | |
(Audited) | | |
(Unaudited) | | |
(Audited) | | |
(Audited) | | |
(Audited) | |
| | | | |
Segment wise revenue and results: | |
| | | |
| | | |
| | | |
| | | |
| | |
| | 1 | | |
Segment revenue : | |
| | | |
| | | |
| | | |
| | | |
| | |
| | | | |
a) Pharmaceutical Services and Active Ingredients | |
| 11,725 | | |
| 10,580 | | |
| 10,398 | | |
| 41,295 | | |
| 37,195 | |
| | | | |
b) Global Generics | |
| 61,289 | | |
| 63,124 | | |
| 54,297 | | |
| 245,673 | | |
| 213,953 | |
| | | | |
c) Others | |
| 1,431 | | |
| 1,215 | | |
| 931 | | |
| 3,922 | | |
| 3,126 | |
| | | | |
Total | |
| 74,445 | | |
| 74,919 | | |
| 65,626 | | |
| 290,890 | | |
| 254,274 | |
| | | | |
| |
| | | |
| | | |
| | | |
| | | |
| | |
| | | | |
Less: Inter-segment revenue | |
| 3,307 | | |
| 2,551 | | |
| 2,474 | | |
| 10,779 | | |
| 7,577 | |
| | | | |
Total revenue from operations | |
| 71,138 | | |
| 72,368 | | |
| 63,152 | | |
| 280,111 | | |
| 246,697 | |
| | | | |
| |
| | | |
| | | |
| | | |
| | | |
| | |
| | 2 | | |
Segment results: | |
| | | |
| | | |
| | | |
| | | |
| | |
| | | | |
Gross profit from each segment | |
| | | |
| | | |
| | | |
| | | |
| | |
| | | | |
a) Pharmaceutical Services and Active Ingredients | |
| 2,349 | | |
| 2,307 | | |
| 1,970 | | |
| 6,929 | | |
| 4,733 | |
| | | | |
b) Global Generics | |
| 37,937 | | |
| 39,077 | | |
| 33,498 | | |
| 154,272 | | |
| 132,719 | |
| | | | |
c) Others | |
| 1,202 | | |
| 823 | | |
| 535 | | |
| 2,423 | | |
| 1,909 | |
| | | | |
Total | |
| 41,488 | | |
| 42,207 | | |
| 36,003 | | |
| 163,624 | | |
| 139,361 | |
| | | | |
| |
| | | |
| | | |
| | | |
| | | |
| | |
| | | | |
Less: Selling and other un-allocable expenditure/(income), net | |
| 25,436 | | |
| 23,916 | | |
| 22,712 | | |
| 91,614 | | |
| 78,876 | |
| | | | |
Total profit before tax | |
| 16,052 | | |
| 18,291 | | |
| 13,291 | | |
| 72,010 | | |
| 60,485 | |
Global Generics includes operations of Biologics
business. Inter-segment revenue represents sales from Pharmaceutical Services and Active Ingredients to Global Generics and Others at
cost.
Segmental capital employed
As certain assets of the Company including manufacturing
facilities, development facilities and treasury assets and liabilities are often deployed interchangeably across segments, it is impractical
to allocate these assets and liabilities to each segment. Hence, the details for capital employed have not been disclosed in the above
table.
Notes:
| 1 | The above statement of audited consolidated financial results of Dr. Reddy's Laboratories Limited ("the
Company"), which have been prepared in accordance with Indian Accounting Standards ("Ind AS") prescribed under section
133 of Companies Act,2013 ("the Act") read with relevant rules issues thereunder, other accounting principles generally accepted
in India and guidelines issues by the Securities and Exchange Board of India ("SEBI") were reviewed and recommended by Audit
Committee and approved by the Board of Directors at their meetings held on 7 May 2024. The Statutory Auditors have issued an unqualified
report thereon. |
| 2 | License fee and service income for the year ended 31 March 2023 includes: |
a. Rs. 2,640 million from sale of certain
non-core dermatology brands to Eris Lifesciences Limited for the quarter ended 31 March 2023;
b. Rs. 1,399 million from sale of brands
Styptovit-E, Finast, Finast-T and Dynapres to Torrent Pharmaceuticals Limited;
c. Rs. 902 million from sale of brands
Z&D, Pedicloryl, Pecef and Ezinapi to J B Chemicals and Pharmaceuticals Limited. The amounts recognised above are adjusted for expected
sales returns. These transactions pertain to Company’s Global Generics segment.
| 3 | “Other income” for the year ended 31 March 2024 includes : |
a. Rs.540 million recognised in April
2023, pursuant to settlement agreement with Janssen Group, in settlement of the claim brought in the Federal Court of Canada by the Company
and its affiliates for damages under section 8 of the Canadian Patented Medicines (Notice of Compliance) Regulations in regard to the
Company’s ANDS for a generic version of Zytiga®(Abiraterone).This transaction pertains to the Company's Global Generics segment.
b. Rs.984 million recognised pursuant
to settlement of product related litigation by the Company and its affiliates in the United Kingdom. This transaction pertains to the
Company's Global Generics segment.
| 4 | “Other income” for the year ended 31 March 2023 includes an amount of Rs.5,638 million (U.S.$71.39
discounted to present value), recognised in June 2022 towards the settlement of an ongoing litigation relating to launch of a product
with Indivior Inc., Indivior UK Limited and Aquestive Therapeutics, Inc. |
| 5 | During the quarter and year ended 31 March 2024, an amount of Rs. 810 million and Rs. 4,232 million respectively,
and during the quarter and year ended 31 March 2023, an amount of Rs.305 million and Rs.3,111 million, respectively, representing government
grants has been accounted for as a reduction from cost of materials consumed. |
| 6 | "Impairment of non-current assets, net" for the year ended 31 March 2024 primarily includes: |
a. Reversal of impairment loss of Rs.
226 million in March 2024, with respect to saxagliptin/metformin (generic version of Kombiglyze® - XR) and enalaprilat (generic version
of Vasotec®) pursuant to launch of these two products during the year.
The company re-assessed the recoverable
amount pursuant to favorable market conditions and change in circumstances that led to initial impairment during year ended 31 March 2021
by revisiting the market volumes, share and price assumptions of these two products and accordingly capitalized under Product related
intangibles with corresponding reversal of impairment loss of Rs. 191 million and Rs. 35 million respectively. This impairment loss pertains
to the Company’s Global Generics segment
b. Consequent to adverse market conditions
with respect to certain products related intangibles and software platforms, the Company assessed the recoverable amount of certain products
and recognized impairment loss of Rs. 86 million and Rs. 99 million pertaining to products and software platforms forming part of the
Company’s Global Generics and Others segment, respectively.
DR. REDDY'S LABORATORIES LIMITED
| 7 | Consolidated Balance Sheet |
| All amounts in Indian Rupees millions |
| | |
As at | | |
As at | |
| | |
31.03.2024 | | |
31.03.2023 | |
| Particulars | |
(Audited) | | |
(Audited) | |
| ASSETS | |
| | | |
| | |
| Non-current assets | |
| | | |
| | |
| Property, plant and equipment | |
| 62,487 | | |
| 56,542 | |
| Capital work-in-progress | |
| 13,510 | | |
| 9,752 | |
| Goodwill | |
| 5,501 | | |
| 5,474 | |
| Other intangible assets | |
| 36,268 | | |
| 30,175 | |
| Intangible assets under development | |
| 683 | | |
| 549 | |
| Investment in equity accounted investees | |
| 4,196 | | |
| 4,702 | |
| Financial assets | |
| | | |
| | |
| Investments | |
| 1,059 | | |
| 660 | |
| Other financial assets | |
| 1,212 | | |
| 727 | |
| Deferred tax assets, net | |
| 10,578 | | |
| 7,052 | |
| Tax assets, net | |
| 3,718 | | |
| 2,687 | |
| Other non-current assets | |
| 1,373 | | |
| 276 | |
| Total non-current assets | |
| 140,585 | | |
| 118,596 | |
| Current assets | |
| | | |
| | |
| Inventories | |
| 63,552 | | |
| 48,670 | |
| Financial assets | |
| | | |
| | |
| Investments | |
| 44,050 | | |
| 44,496 | |
| Trade receivables | |
| 80,298 | | |
| 72,485 | |
| Derivative financial instruments | |
| 169 | | |
| 1,232 | |
| Cash and cash equivalents | |
| 7,107 | | |
| 5,779 | |
| Other bank balances | |
| 10,170 | | |
| 11,523 | |
| Other financial assets | |
| 22,527 | | |
| 4,950 | |
| Other current assets | |
| 20,180 | | |
| 15,120 | |
| Total current assets | |
| 248,053 | | |
| 204,255 | |
| TOTAL ASSETS | |
| 388,638 | | |
| 322,851 | |
| | |
| | | |
| | |
| EQUITY AND LIABILITIES | |
| | | |
| | |
| Equity | |
| | | |
| | |
| Equity share capital | |
| 834 | | |
| 833 | |
| Other equity | |
| 281,714 | | |
| 232,028 | |
| Total equity | |
| 282,548 | | |
| 232,861 | |
| | |
| | | |
| | |
| Liabilities | |
| | | |
| | |
| Non-current liabilities | |
| | | |
| | |
| Financial liabilities | |
| | | |
| | |
| Borrowings | |
| 3,800 | | |
| - | |
| Lease liabilities | |
| 2,190 | | |
| 1,278 | |
| Provisions | |
| 239 | | |
| 199 | |
| Deferred tax liabilities, net | |
| 841 | | |
| 760 | |
| Other non-current liabilities | |
| 3,140 | | |
| 2,032 | |
| Total non-current liabilities | |
| 10,210 | | |
| 4,269 | |
| Current liabilities | |
| | | |
| | |
| Financial liabilities | |
| | | |
| | |
| Borrowings | |
| 12,723 | | |
| 11,190 | |
| Lease liabilities | |
| 1,307 | | |
| 1,004 | |
| Trade payables | |
| - | | |
| - | |
| Total outstanding dues of micro enterprises and small enterprises | |
| 282 | | |
| 83 | |
| Total outstanding dues of creditors other than micro enterprises and small enterprises | |
| 25,862 | | |
| 22,601 | |
| Derivative financial instruments | |
| 468 | | |
| 137 | |
| Other financial liabilities | |
| 34,540 | | |
| 29,175 | |
| Liabilities for current tax, net | |
| 2,341 | | |
| 2,143 | |
| Provisions | |
| 6,920 | | |
| 6,525 | |
| Other current liabilities | |
| 11,437 | | |
| 12,863 | |
| Total current liabilities | |
| 95,880 | | |
| 85,721 | |
| TOTAL EQUITY AND LIABILITIES | |
| 388,638 | | |
| 322,851 | |
|
 |
DR. REDDY'S LABORATORIES LIMITED
| 8 | Consolidated statement of cashflows |
| All amounts in Indian Rupees millions |
| | |
Year ended | | |
Year ended | |
| | |
31.03.2024 | | |
31.03.2023 | |
| Particulars | |
(Audited) | | |
(Audited) | |
| Cash flows from/(used in) operating activities : | |
| | | |
| | |
| Profit before tax | |
| 72,010 | | |
| 60,485 | |
| Adjustments for: | |
| | | |
| | |
| Fair value changes and profit on sale of financial instruments measured at FVTPL**, net | |
| (3,149 | ) | |
| (876 | ) |
| Depreciation and amortisation expense | |
| 14,700 | | |
| 12,502 | |
| Impairment of non-current assets | |
| 3 | | |
| 699 | |
| Allowance for credit losses (on trade receivables and other advances) | |
| 275 | | |
| 205 | |
| (Profit)/Loss on sale or de-recognition of non-current assets, net | |
| (900 | ) | |
| 208 | |
| Share of profit of equity accounted investees | |
| (147 | ) | |
| (370 | ) |
| Unrealized exchange (gain)/loss, net | |
| (533 | ) | |
| (925 | ) |
| Interest income | |
| (2,278 | ) | |
| (1,180 | ) |
| Finance costs | |
| 1,711 | | |
| 1,428 | |
| Equity settled share-based payment expense | |
| 407 | | |
| 397 | |
| Inventories write-down | |
| 3,563 | | |
| 4,869 | |
| Dividend income | |
| - | * | |
| - | * |
| Changes in operating assets and liabilities: | |
| | | |
| | |
| Trade receivables | |
| (8,054 | ) | |
| (5,752 | ) |
| Inventories | |
| (18,445 | ) | |
| (2,654 | ) |
| Trade payables | |
| 3,460 | | |
| 23 | |
| Other assets and other liabilities, net | |
| 2,857 | | |
| 528 | |
| Cash generated from operations | |
| 65,480 | | |
| 69,587 | |
| Income tax paid, net | |
| (20,047 | ) | |
| (10,714 | ) |
| Net cash from operating activities | |
| 45,433 | | |
| 58,873 | |
| Cash flows from/(used in) investing activities : | |
| | | |
| | |
| Purchase of property, plant and equipment | |
| (16,403 | ) | |
| (11,323 | ) |
| Proceeds from sale of property, plant and equipment | |
| 1,064 | | |
| 82 | |
| Purchase of other intangible assets | |
| (11,032 | ) | |
| (7,541 | ) |
| Proceeds from sale of other intangible assets | |
| 21 | | |
| - | |
| Investment in associates | |
| (12 | ) | |
| - | |
| Purchase of investments (including bank deposits) | |
| (145,488 | ) | |
| (136,171 | ) |
| Proceeds from sale of investments (including bank deposits) | |
| 129,784 | | |
| 112,805 | |
| Dividend received from equity accounted investees | |
| 445 | | |
| - | |
| Interest and dividend received | |
| 1,338 | | |
| 777 | |
| Net cash used in investing activities | |
| (40,283 | ) | |
| (41,371 | ) |
| Cash flows from/(used in) financing activities : | |
| | | |
| | |
| Proceeds from issuance of equity shares (including treasury shares) | |
| 805 | | |
| 157 | |
| Proceeds from sale of treasury shares | |
| - | | |
| 211 | |
| Proceeds from/(Repayment of) from short-term loans and borrowings, net | |
| 5,493 | | |
| (19,382 | ) |
| Repayment of long-term loans and borrowings | |
| (3,800 | ) | |
| - | |
| Proceeds from long term borrowings | |
| 3,800 | | |
| - | |
| Payment of principal portion of lease liabilities | |
| (1,147 | ) | |
| (1,015 | ) |
| Dividend paid | |
| (6,648 | ) | |
| (4,979 | ) |
| Interest paid | |
| (2,266 | ) | |
| (1,853 | ) |
| Net cash used in financing activities | |
| (3,763 | ) | |
| (26,861 | ) |
| | |
| | | |
| | |
| Net increase/(decrease) in cash and cash equivalents | |
| 1,387 | | |
| (9,359 | ) |
| Effect of exchange rate changes on cash and cash equivalents | |
| (59 | ) | |
| 286 | |
| Cash and cash equivalents at the beginning of the year | |
| 5,779 | | |
| 14,852 | |
| Cash and cash equivalents at the end of the year | |
| 7,107 | | |
| 5,779 | |
| **FVTPL | (fair value through profit or loss) |
DR. REDDY'S LABORATORIES LIMITED
| 9 | During the quarter ended 31 March 2023, Company considered a total impairment of Rs. 540 million towards: |
a. The Company assessed performance of
business acquired from Nimbus Health GmbH against the initial estimates and performance of the products. Basis the assessment, the Company
has recorded an impairment charge of the carrying values amounting to Rs. 375 million (Goodwill- Rs. 272 million and Other intangibles-
Rs. 103 million). The said impairment charge pertains to the Company’s Global Generics segment.
b. Consequent to adverse market conditions
with respect to certain of the Company’s products related intangibles forming part of the Company’s Global Generics and Pharmaceutical
Services and Active Ingredients segments, the Company assessed the recoverable amount of these products and recognised an amount of Rs.
165 million as impairment charge.
| 10 | Included in “Other expenses” for the year ended 31 March 2023, is an amount of Rs. 991 million
representing the Loss on sale of Assets recognised in December 2022, pursuant to agreement with Delpharm Development Leiden B.V (Delpharm)
for transfer of its certain assets, liabilities and employees at its site at Leiden, Netherlands.This transaction pertains to Company’s
Global Generics segment. |
| 11 | The Company received an anonymous complaint in September 2020, alleging that healthcare professionals
in Ukraine and potentially in other countries were provided with improper payments by or on behalf of the Company in violation of U.S.
anti-corruption laws, specifically the U.S. Foreign Corrupt Practices Act. The Company disclosed the matter to the U.S. Department of
Justice (“DOJ”), Securities and Exchange Commission (“SEC”) and Securities Exchange Board of India. The Company
engaged a U.S. law firm to conduct the investigation at the instruction of a committee of the Company’s Board of Directors. On July
6, 2021, the Company received a subpoena from the SEC for the production of related documents, which were provided to the SEC. |
During the previous years, the Company
made presentations to the SEC and the DOJ in relation to the investigation in the aforementioned countries, and in relation to its Global
Compliance Framework, which includes enhancement initiatives undertaken by the Company. The Company continues to respond to the requests
made by the SEC and the DOJ and is complying with its listing obligations as it relates to updating the regulatory agencies. While the
findings from the aforesaid investigations could result in government or regulatory enforcement actions against the Company in the United
States and/or foreign jurisdictions and can also lead to civil and criminal sanctions under relevant laws, the outcomes, including liabilities,
are not reasonably ascertainable at this time.
| 12 | The Company considered the uncertainties relating to the escalation of conflict in the middle east, and
duration of military conflict between Russia and Ukraine, in assessing the recoverability of receivables, goodwill, intangible assets,
investments and other assets. For this purpose, the Company considered internal and external sources of information up to the date of
approval of these financial results. Based on its judgments, estimates and assumptions, including sensitivity analysis, the Company expects
to fully recover the carrying amount of receivables, goodwill, intangible assets, investments and other assets. The Company will continue
to closely monitor any material changes to future economic conditions. |
| 13 | The Board of Directors, at their meeting held on 7 May 2024, have recommended a final dividend of Rs.40
per share subject to approval of shareholders. |
| 14 | The figures of the fourth quarter are the balancing figures between audited figures in respect of the
full financial year and the published year to date figures upto the third quarter of the relevant financial year. Also the figures upto
the end of third quarter were only reviewed and not subjected to audit. |
By order of the Board
For Dr. Reddy's Laboratories Limited
| |
 |
| Place: Hyderabad |
G V Prasad |
| Date: 7 May 2024 |
Co-Chairman & Managing Director |

Exhibit 99.5

Chartered Accountants |
THE SKYVIEW 10 |
| 18th
Floor, “NORTH LOBBY” |
| Survey No. 83/1, Raidurgam |
| Hyderabad - 500 032, India |
| |
| Tel : +91 40 6141 6000 |
Independent
Auditor’s Report on the Quarterly and Year to Date Audited Standalone Financial Results of the Company Pursuant to the Regulation
33 of the SEBI (Listing Obligations and Disclosure Requirements) Regulations, 2015, as amended
To
The
Board of Directors of
Dr.
Reddy’s Laboratories Limited
Report
on the audit of the Standalone Financial Results
Opinion
We
have audited the accompanying Statement of Audited Standalone Financial Results for the quarter and year ended 31 March 2024 (“Statement”)
of Dr. Reddy’s Laboratories Limited (the “Company”) for the quarter and year ended March 31, 2024, attached herewith,
being submitted by the Company pursuant to the requirement of Regulation 33 of the SEBI (Listing Obligations and Disclosure Requirements)
Regulations, 2015, as amended (the “Listing Regulations”).
In
our opinion and to the best of our information and according to the explanations given to us, the Statement:
| i. | is
presented in accordance with the requirements of the Listing Regulations in this regard;
and |
| ii. | gives
a true and fair view in conformity with the applicable accounting standards and other accounting
principles generally accepted in India, of the net profit and other comprehensive loss and
other financial information of the Company for the quarter and year ended March 31, 2024. |
Basis
for Opinion
We
conducted our audit in accordance with the Standards on Auditing (SAs) specified under section 143(10) of the Companies Act, 2013,
as amended (“the Act”). Our responsibilities under those Standards are further described in the “Auditor’s Responsibilities
for the Audit of the Standalone Financial Results” section of our report. We are independent of the Company in accordance with
the Code of Ethics issued by the Institute of Chartered Accountants of India together with the ethical requirements that are relevant
to our audit of the financial statements under the provisions of the Act and the Rules thereunder, and we have fulfilled our other ethical
responsibilities in accordance with these requirements and the Code of Ethics. We believe that the audit evidence obtained by us is sufficient
and appropriate to provide a basis for our opinion.
Management’s
Responsibilities for the Standalone Financial Results
The
Statement has been prepared on the basis of the standalone annual financial statements. The Board of Directors of the Company are responsible
for the preparation and presentation of the Statement that gives a true and fair view of the net profit and other comprehensive income
of the Company and other financial information in accordance with the applicable accounting standards prescribed under Section 133 of
the Act read with relevant rules issued thereunder and other accounting principles generally accepted in India and in compliance with
Regulation 33 of the Listing Regulations. This responsibility also includes maintenance of adequate accounting records in accordance
with the provisions of the Act for safeguarding of the assets of the Company and for preventing and detecting frauds and other irregularities;
selection and application of appropriate accounting policies; making judgments and estimates that are reasonable and prudent; and the
design, implementation and maintenance of adequate internal financial controls, that were operating effectively for ensuring the accuracy
and completeness of the accounting records, relevant to the preparation and presentation of the Statement that give a true and fair view
and are free from material misstatement, whether due to fraud or error.
In
preparing the Statement, the Board of Directors are responsible for assessing the Company’s ability to continue as a going concern,
disclosing, as applicable, matters related to going concern and using the going concern basis of accounting unless the Board of Directors
either intends to liquidate the Company or to cease operations, or has no realistic alternative but to do so.

S.R.
Batliboi & Associates LLP, a Limited Liability Partnership with LLP Identity No. AAB-4295
Regd.
Office : 22, Camac Street, Block ‘B’, 3rd Floor, Kolkata-700 016
Chartered Accountants
The
Board of Directors are also responsible for overseeing the Company’s financial reporting process.
Auditor’s
Responsibilities for the Audit of the Standalone Financial Results
Our
objectives are to obtain reasonable assurance about whether the Statement as a whole is free from material misstatement, whether due
to fraud or error, and to issue an auditor’s report that includes our opinion. Reasonable assurance is a high level of assurance
but is not a guarantee that an audit conducted in accordance with SAs will always detect a material misstatement when it exists. Misstatements
can arise from fraud or error and are considered material if, individually or in the aggregate, they could reasonably be expected to
influence the economic decisions of users taken on the basis of the Statement.
As
part of an audit in accordance with SAs, we exercise professional judgment and maintain professional skepticism throughout the audit.
We also:
| · | Identify
and assess the risks of material misstatement of the Statement, whether due to fraud or error,
design and perform audit procedures responsive to those risks, and obtain audit evidence
that is sufficient and appropriate to provide a basis for our opinion. The risk of not detecting
a material misstatement resulting from fraud is higher than for one resulting from error,
as fraud may involve collusion, forgery, intentional omissions, misrepresentations, or the
override of internal control. |
| · | Obtain
an understanding of internal control relevant to the audit in order to design audit procedures
that are appropriate in the circumstances. Under Section 143(3)(i) of the Act, we are also
responsible for expressing our opinion on whether the company has adequate internal financial
controls with reference to financial statements in place and the operating effectiveness
of such controls. |
| · | Evaluate
the appropriateness of accounting policies used and the reasonableness of accounting estimates
and related disclosures made by the Board of Directors. |
| · | Conclude
on the appropriateness of the Board of Directors’ use of the going concern basis of
accounting and, based on the audit evidence obtained, whether a material uncertainty exists
related to events or conditions that may cast significant doubt on the Company’s ability
to continue as a going concern. If we conclude that a material uncertainty exists, we are
required to draw attention in our auditor’s report to the related disclosures in the
financial results or, if such disclosures are inadequate, to modify our opinion. Our conclusions
are based on the audit evidence obtained up to the date of our auditor’s report. However,
future events or conditions may cause the Company to cease to continue as a going concern. |
| · | Evaluate
the overall presentation, structure and content of the Statement, including the disclosures,
and whether the Statement represents the underlying transactions and events in a manner that
achieves fair presentation. |
We
communicate with those charged with governance regarding, among other matters, the planned scope and timing of the audit and significant
audit findings, including any significant deficiencies in internal control that we identify during our audit.
We
also provide those charged with governance with a statement that we have complied with relevant ethical requirements regarding independence,
and to communicate with them all relationships and other matters that may reasonably be thought to bear on our independence, and where
applicable, related safeguards.

Chartered Accountants
Other
Matter
The
Statement includes the results for the quarter ended March 31,2024 being the balancing figure between the audited figures in respect
of the full financial year ended March 31, 2024 and the published unaudited year-to-date figures up to the third quarter of the current
financial year, which were subjected to a limited review by us, as required under the Listing Regulations.
For
S.R. BATLIBOI & ASSOCIATES LLP
Chartered
Accountants
ICAI
Firm Registration Number: 101049W/E300004
per
Shankar Srinivasan
Partner
Membership
No.: 213271
UDIN:24213271BKELCJ6463
Place:
Hyderabad
Date:
May 07, 2024
 |
Dr. Reddy’s Laboratories Ltd.
8-2-337, Road No. 3, Banjara Hills,
Hyderabad - 500 034, Telangana,
India.
CIN : L85195TG1984PLC004507
Tel : +91 40 4900 2900
Fax : +91 40 4900 2999
Email : mail@drreddys.com
www.drreddys.com |
DR.
REDDY’S LABORATORIES LIMITED
STATEMENT
OF AUDITED STANDALONE FINANCIAL RESULTS FOR THE QUARTER AND YEAR ENDED 31 MARCH 2024
| | |
| |
All amounts in Indian Rupees millions | |
| |
| |
Quarter ended | | |
Year ended | |
| |
| |
31.03.2024 | | |
31.12.2023 | | |
31.03.2023 | | |
31.03.2024 | | |
31.03.2023 | |
| Sl.
No. | |
Particulars | |
(Audited) | | |
(Unaudited) | | |
(Audited) | | |
(Audited) | | |
(Audited) | |
| | |
| |
| | |
| | |
| | |
| | |
| |
| 1 | |
Revenue from operations | |
| | | |
| | | |
| | | |
| | | |
| | |
| | |
a) Sales | |
| 50,304 | | |
| 40,389 | | |
| 42,491 | | |
| 192,764 | | |
| 162,989 | |
| | |
b) License fees and service income | |
| 514 | | |
| 442 | | |
| 2,887 | | |
| 1,277 | | |
| 6,002 | |
| | |
c) Other operating income | |
| 230 | | |
| 199 | | |
| 162 | | |
| 797 | | |
| 634 | |
| | |
Total revenue from operations | |
| 51,048 | | |
| 41,030 | | |
| 45,540 | | |
| 194,838 | | |
| 169,625 | |
| | |
| |
| | | |
| | | |
| | | |
| | | |
| | |
| 2 | |
Other income | |
| 2,127 | | |
| 2,276 | | |
| 1,148 | | |
| 8,623 | | |
| 5,913 | |
| | |
| |
| | | |
| | | |
| | | |
| | | |
| | |
| | |
Total income (1 + 2) | |
| 53,175 | | |
| 43,306 | | |
| 46,688 | | |
| 203,461 | | |
| 175,538 | |
| | |
| |
| | | |
| | | |
| | | |
| | | |
| | |
| 3 | |
Expenses | |
| | | |
| | | |
| | | |
| | | |
| | |
| | |
a) Cost of materials consumed | |
| 9,077 | | |
| 8,187 | | |
| 8,541 | | |
| 32,915 | | |
| 31,614 | |
| | |
b) Purchase of stock-in-trade | |
| 5,463 | | |
| 5,569 | | |
| 3,692 | | |
| 19,866 | | |
| 17,793 | |
| | |
c) Changes in inventories of finished goods, work-in-progress
and stock-in-trade | |
| (520 | ) | |
| (651 | ) | |
| 1,068 | | |
| (2,388 | ) | |
| 1,295 | |
| | |
d) Employee benefits expense | |
| 7,795 | | |
| 7,823 | | |
| 7,651 | | |
| 30,857 | | |
| 28,326 | |
| | |
e) Depreciation and amortisation expense | |
| 2,462 | | |
| 2,464 | | |
| 2,367 | | |
| 9,756 | | |
| 9,232 | |
| | |
f) Impairment of non current assets, net | |
| 260 | | |
| - | | |
| 41 | | |
| 260 | | |
| 51 | |
| | |
g) Finance costs | |
| 59 | | |
| 56 | | |
| 26 | | |
| 218 | | |
| 169 | |
| | |
h) Other expenses | |
| 15,187 | | |
| 13,539 | | |
| 13,936 | | |
| 54,064 | | |
| 48,398 | |
| | |
| |
| | | |
| | | |
| | | |
| | | |
| | |
| | |
Total expenses | |
| 39,783 | | |
| 36,987 | | |
| 37,322 | | |
| 145,548 | | |
| 136,878 | |
| | |
| |
| | | |
| | | |
| | | |
| | | |
| | |
| 4 | |
Profit before tax (1 + 2 - 3) | |
| 13,392 | | |
| 6,319 | | |
| 9,366 | | |
| 57,913 | | |
| 38,660 | |
| | |
| |
| | | |
| | | |
| | | |
| | | |
| | |
| 5 | |
Tax expense/ (benefit) | |
| | | |
| | | |
| | | |
| | | |
| | |
| | |
a) Current tax | |
| 2,702 | | |
| 1,569 | | |
| 2,319 | | |
| 13,618 | | |
| 8,641 | |
| | |
b) Deferred tax | |
| 342 | | |
| (2 | ) | |
| 323 | | |
| 875 | | |
| 3,891 | |
| | |
| |
| | | |
| | | |
| | | |
| | | |
| | |
| 6 | |
Net profit for the period / year (4 - 5) | |
| 10,348 | | |
| 4,752 | | |
| 6,724 | | |
| 43,420 | | |
| 26,128 | |
| | |
| |
| | | |
| | | |
| | | |
| | | |
| | |
| 7 | |
Other comprehensive income/(loss) | |
| | | |
| | | |
| | | |
| | | |
| | |
| | |
a) (i) Items that will not be reclassified to profit or loss | |
| 27 | | |
| (8 | ) | |
| 86 | | |
| 21 | | |
| 89 | |
| | |
(ii) Income tax relating to items that will not be reclassified
to profit or loss | |
| (7 | ) | |
| - | | |
| (22 | ) | |
| (7 | ) | |
| (53 | ) |
| | |
b) (i) Items that will be reclassified subsequently to profit or loss | |
| (189 | ) | |
| 24 | | |
| 1,350 | | |
| (446 | ) | |
| (928 | ) |
| | |
(ii) Income tax relating to items that will be reclassified to
profit or loss | |
| 49 | | |
| (6 | ) | |
| (339 | ) | |
| 114 | | |
| 358 | |
| | |
Total other comprehensive income / (loss) | |
| (120 | ) | |
| 10 | | |
| 1,075 | | |
| (318 | ) | |
| (534 | ) |
| 8 | |
Total comprehensive income (6 + 7) | |
| 10,228 | | |
| 4,762 | | |
| 7,799 | | |
| 43,102 | | |
| 25,594 | |
| | |
| |
| | | |
| | | |
| | | |
| | | |
| | |
| 9 | |
Paid-up equity share capital (face value Rs. 5/- each) | |
| 834 | | |
| 834 | | |
| 833 | | |
| 834 | | |
| 833 | |
| | |
| |
| | | |
| | | |
| | | |
| | | |
| | |
| 10 | |
Other equity | |
| | | |
| | | |
| | | |
| 241,574 | | |
| 203,909 | |
| | |
| |
| | | |
| | | |
| | | |
| | | |
| | |
| 11 | |
Earnings per equity share (face value Rs. 5/- each) | |
| | | |
| | | |
| | | |
| | | |
| | |
| | |
| |
| | | |
| | | |
| | | |
| | | |
| | |
| | |
Basic | |
| 62.14 | | |
| 28.55 | | |
| 40.49 | | |
| 260.95 | | |
| 157.37 | |
| | |
Diluted | |
| 62.04 | | |
| 28.50 | | |
| 40.41 | | |
| 260.46 | | |
| 157.03 | |
| | |
| |
| (Not annualised) | | |
| (Not annualised) | | |
| (Not annualised) | | |
| | | |
| | |
See
accompanying notes to the financial results.
DR. REDDY’S LABORATORIES LIMITED
| Segment information | |
All amounts in Indian Rupees millions | |
| | |
| |
Quarter ended | | |
Year ended | |
| |
| |
31.03.2024 | | |
31.12.2023 | | |
31.03.2023 | | |
31.03.2024 | | |
31.03.2023 | |
| Sl.
No. | |
Particulars | |
(Audited) | | |
(Unaudited) | | |
(Audited) | | |
(Audited) | | |
(Audited) | |
| | |
Segment wise revenue and results | |
| | | |
| | | |
| | | |
| | | |
| | |
| 1 | |
Segment revenue | |
| | | |
| | | |
| | | |
| | | |
| | |
| | |
a) Pharmaceutical Services and Active Ingredients | |
| 9,842 | | |
| 7,658 | | |
| 9,111 | | |
| 30,742 | | |
| 27,896 | |
| | |
b) Global Generics | |
| 44,006 | | |
| 35,726 | | |
| 38,651 | | |
| 173,405 | | |
| 147,999 | |
| | |
c) Others | |
| 353 | | |
| 66 | | |
| 129 | | |
| 678 | | |
| 497 | |
| | |
Total | |
| 54,201 | | |
| 43,450 | | |
| 47,891 | | |
| 204,825 | | |
| 176,392 | |
| | |
| |
| | | |
| | | |
| | | |
| | | |
| | |
| | |
Less: Inter-segment revenue | |
| 3,153 | | |
| 2,420 | | |
| 2,351 | | |
| 9,987 | | |
| 6,767 | |
| | |
Total revenue from operations | |
| 51,048 | | |
| 41,030 | | |
| 45,540 | | |
| 194,838 | | |
| 169,625 | |
| | |
| |
| | | |
| | | |
| | | |
| | | |
| | |
| 2 | |
Segment results | |
| | | |
| | | |
| | | |
| | | |
| | |
| | |
Profit / (loss) before tax and interest from each segment | |
| | | |
| | | |
| | | |
| | | |
| | |
| | |
a) Pharmaceutical Services and Active Ingredients | |
| 1,246 | | |
| (397 | ) | |
| 486 | | |
| (287 | ) | |
| (1,336 | ) |
| | |
b) Global Generics | |
| 12,172 | | |
| 6,832 | | |
| 9,054 | | |
| 57,670 | | |
| 46,716 | |
| | |
c) Others | |
| 239 | | |
| 198 | | |
| (51 | ) | |
| 536 | | |
| (154 | ) |
| | |
Total | |
| 13,657 | | |
| 6,633 | | |
| 9,489 | | |
| 57,919 | | |
| 45,226 | |
| | |
| |
| | | |
| | | |
| | | |
| | | |
| | |
| | |
Less: (i) Finance costs | |
| 59 | | |
| 56 | | |
| 26 | | |
| 218 | | |
| 169 | |
| | |
(ii) Other un-allocable expenditure / (income), net | |
| 206 | | |
| 258 | | |
| 97 | | |
| (212 | ) | |
| 6,397 | |
| | |
Total profit before tax | |
| 13,392 | | |
| 6,319 | | |
| 9,366 | | |
| 57,913 | | |
| 38,660 | |
Global
Generics includes operations of Biologics business. Inter-segment revenue represents sale from Pharmaceutical Services and Active Ingredients
to Global Generics at cost.
Segmental
capital employed
As
certain assets of the Company including manufacturing facilities, development facilities and treasury assets and liabilities are often
deployed interchangeably across segments, it is impractical to allocate these assets and liabilities to each segment. Hence, the details
for capital employed have not been disclosed in the above table.
Notes:
| 1 | The
above statement of audited standalone financial results of Dr. Reddy’s Laboratories
Limited (“the Company”), which have been prepared in accordance with the Indian
Accounting Standards (‘‘Ind AS’’) prescribed under Section 133 of
the Companies Act, 2013 (“the Act’’) read with relevant rules issued thereunder,
other accounting principles generally accepted in India and guidelines issued by the Securities
and Exchange Board of India (“SEBI’’) were reviewed and recommended by
the Audit Committee and approved by the Board of Directors at their meetings held on 07 May
2024. The Statutory Auditors have issued an unqualified report thereon. |
| 2 | License
fee and service income for the year ended 31 March 2023 includes: |
a.
Rs. 2,640 million from sale of certain non-core dermatology brands in India to Eris Lifesciences Limited for the quarter ended 31 March
2023;
b.
Rs. 1,399 million from sale of brands Styptovit-E, Finast, Finast-T and Dynapres to Torrent Pharmaceuticals Limited;
c.
Rs. 902 million from sale of brands Z&D, Pedicloryl, Pecef and Ezinapi to J B Chemicals and Pharmaceuticals Limited;
The
amounts recognised above are adjusted for expected sales returns. These transactions pertain to the Company’s Global Generics segment.
| 3 | “Other
income” for the year ended 31 March 2024 includes Rs.540 million recognised in April
2023, pursuant to settlement agreement with Janssen Group, in settlement of the claim brought
in the Federal Court of Canada by the Company and its affiliates for damages under section
8 of the Canadian Patented Medicines (Notice of Compliance) Regulations in regard to the
Company’s ANDS for a generic version of Zytiga®(Abiraterone).This transaction pertains
to the Company’s Global Generics segment. |
| 4 | “Other
income” for the year ended 31 March 2024 includes dividend income of Rs. 445 million
declared by Kunshan Rotan Reddy Pharmaceutical Company Limited, joint venture of the company. |
| 5 | During
the quarter and year ended 31 March 2024, an amount of Rs. 806 million and Rs. 4,211 million
respectively and during the quarter and year ended 31 March 2023, an amount of Rs. 305 million
and Rs. 3,111 million respectively, representing government grants has been accounted as
a reduction from cost of material consumed. |
| 6 | “Impairment
of non-current assets, net” for the year ended 31 March 2024 primarily includes: |
a.
The Company assessed the recoverable amount of investment in equity shares of its subsidiary, Svaas Wellness Limited, India and recognized
impairment loss of Rs. 288 million as the recoverable value is below the carrying value of the investment held by the Company. This impairment
loss pertains to the Company’s Others segment.
b.
Consequent to adverse market conditions with respect to certain products related intangibles, the Company assessed the recoverable amount
of certain products and recognized impairment loss of Rs. 7 million pertaining to products forming part of the Company’s Global
Generics segment.
c.
Reversal of impairment loss of Rs. 35 million in March 2024, with respect to enalaprilat (generic version of Vasotec®) pursuant to
launch of the product during the year. The company re-assessed the recoverable amount pursuant to favorable market conditions and change
in circumstances that led to initial impairment during year ended 31 March 2021, by revisiting the market volumes, share and price assumptions
of this product and accordingly capitalized under Product related intangibles with corresponding reversal of impairment loss of Rs. 35
million. This pertains to the Company’s Global Generics segment.
| 7 | The
Company received an anonymous complaint in September 2020, alleging that healthcare professionals
in Ukraine and potentially in other countries were provided with improper payments by or
on behalf of the Company in violation of U.S. anti-corruption laws, specifically the U.S.
Foreign Corrupt Practices Act. The Company disclosed the matter to the U.S. Department of
Justice (“DOJ”), Securities and Exchange Commission (“SEC”) and Securities
Exchange Board of India. The Company engaged a U.S. law firm to conduct the investigation
at the instruction of a committee of the Company’s Board of Directors. On July 6, 2021,
the Company received a subpoena from the SEC for the production of related documents, which
were provided to the SEC. |
During
the previous years, the Company made presentations to the SEC and the DOJ in relation to the investigation in the aforementioned countries,
and in relation to its Global Compliance Framework, which includes enhancement initiatives undertaken by the Company. The Company continues
to respond to the requests made by the SEC and the DOJ and is complying with its listing obligations as it relates to updating the regulatory
agencies. While the findings from the aforesaid investigations could result in government or regulatory enforcement actions against the
Company in the United States and/or foreign jurisdictions and can also lead to civil and criminal sanctions under relevant laws, the
outcomes, including liabilities, are not reasonably ascertainable at this time.
DR. REDDY’S LABORATORIES
LIMITED
| 8 | The
Company considered the uncertainties relating to the escalation of conflict in the middle
east, and duration of military conflict between Russia and Ukraine, in assessing the recoverability
of receivables, goodwill, intangible assets, investments and other assets. For this purpose,
the Company considered internal and external sources of information up to the date of approval
of these financial results. Based on its judgments, estimates and assumptions, including
sensitivity analysis, the Company expects to fully recover the carrying amount of receivables,
goodwill, intangible assets, investments and other assets. The Company will continue to closely
monitor any material changes to future economic conditions. |
| |
All amounts in Indian Rupees millions | |
| | |
As at | | |
As at | |
| Particulars | |
31.03.2024 | | |
31.03.2023 | |
| | |
(Audited) | | |
(Audited) | |
| ASSETS | |
| | |
| |
| Non-current assets | |
| | | |
| | |
| Property, plant and equipment | |
| 51,094 | | |
| 47,379 | |
| Capital work-in-progress | |
| 11,719 | | |
| 8,991 | |
| Goodwill | |
| 853 | | |
| 853 | |
| Other intangible assets | |
| 23,944 | | |
| 23,721 | |
| Intangible assets under development | |
| 391 | | |
| 253 | |
| Financial assets | |
| | | |
| | |
| Investments | |
| 32,027 | | |
| 31,422 | |
| Loans | |
| 617 | | |
| 11 | |
| Other financial assets | |
| 919 | | |
| 533 | |
| Tax assets, net | |
| 3,161 | | |
| 2,546 | |
| Other non-current assets | |
| 709 | | |
| 156 | |
| Total non-current assets | |
| 125,434 | | |
| 115,865 | |
| | |
| | | |
| | |
| Current assets | |
| | | |
| | |
| Inventories | |
| 40,189 | | |
| 30,430 | |
| Financial assets | |
| | | |
| | |
| Investments | |
| 41,179 | | |
| 42,978 | |
| Trade receivables | |
| 46,239 | | |
| 42,889 | |
| Derivative financial instruments | |
| 165 | | |
| 715 | |
| Cash and cash equivalents | |
| 2,014 | | |
| 1,123 | |
| Other bank balances | |
| 10,155 | | |
| 5,335 | |
| Other financial assets | |
| 22,078 | | |
| 2,224 | |
| Other current assets | |
| 16,140 | | |
| 12,189 | |
| Total current assets | |
| 178,159 | | |
| 137,883 | |
| | |
| | | |
| | |
| TOTAL ASSETS | |
| 303,593 | | |
| 253,748 | |
| | |
| | | |
| | |
| EQUITY AND LIABILITIES | |
| | | |
| | |
| Equity | |
| | | |
| | |
| Equity share capital | |
| 834 | | |
| 833 | |
| Other equity | |
| 241,574 | | |
| 203,909 | |
| Total Equity | |
| 242,408 | | |
| 204,742 | |
| | |
| | | |
| | |
| Liabilities | |
| | | |
| | |
| Non-current liabilities | |
| | | |
| | |
| Financial liabilities | |
| | | |
| | |
| Lease liabilities | |
| 495 | | |
| 286 | |
| Provisions | |
| 93 | | |
| 79 | |
| Deferred tax liabilities, net | |
| 4,161 | | |
| 3,392 | |
| Other non-current liabilities | |
| 1,055 | | |
| 852 | |
| Total non-current liabilities | |
| 5,804 | | |
| 4,609 | |
| | |
| | | |
| | |
| Current liabilities | |
| | | |
| | |
| Financial liabilities | |
| | | |
| | |
| Borrowings | |
| 7,100 | | |
| 6 | |
| Lease liabilities | |
| 334 | | |
| 216 | |
| Trade payables | |
| | | |
| | |
| Total outstanding dues of micro enterprises and small enterprises | |
| 268 | | |
| 72 | |
| Total outstanding dues of creditors other than micro enterprises and small enterprises | |
| 20,180 | | |
| 17,573 | |
| Derivative financial instruments | |
| 290 | | |
| 135 | |
| Other financial liabilities | |
| 17,023 | | |
| 15,369 | |
| Liabilities for current tax, net | |
| 670 | | |
| - | |
| Provisions | |
| 3,283 | | |
| 3,052 | |
| Other current liabilities | |
| 6,233 | | |
| 7,974 | |
| Total current liabilities | |
| 55,381 | | |
| 44,397 | |
| | |
| | | |
| | |
| TOTAL EQUITY AND LIABILITIES | |
| 303,593 | | |
| 253,748 | |
 |
 |
DR. REDDY’S LABORATORIES
LIMITED
| |
All amounts in Indian Rupees millions | |
| | |
Year ended | | |
Year ended | |
| Particulars | |
31.03.2024 | | |
31.03.2023 | |
| | |
(Audited) | | |
(Audited) | |
| Cash flows from/(used in) operating activities : | |
| | | |
| | |
| Profit before taxation | |
| 57,913 | | |
| 38,660 | |
| Adjustments for: | |
| | | |
| | |
| Fair value changes and profit on sale of financial instruments measured at FVTPL**, net | |
| (2,961 | ) | |
| (798 | ) |
| Depreciation and amortisation expense | |
| 9,756 | | |
| 9,232 | |
| Impairment of non-current assets | |
| 260 | | |
| 51 | |
| Allowance for credit losses (on trade receivables and other advances) | |
| 177 | | |
| 161 | |
| (Profit)/Loss on sale or de-recognition of non-current assets, net | |
| (771 | ) | |
| 233 | |
| Unrealized exchange loss / (gain), net | |
| 76 | | |
| (1,656 | ) |
| Interest income | |
| (3,046 | ) | |
| (1,300 | ) |
| Finance costs | |
| 218 | | |
| 169 | |
| Equity settled share-based payment expense | |
| 346 | | |
| 318 | |
| Inventories write-down | |
| 2,411 | | |
| 4,048 | |
| Dividend income | |
| (446 | ) | |
| - | * |
| Changes in operating assets and liabilities: | |
| | | |
| | |
| Trade receivables | |
| (3,410 | ) | |
| 6,568 | |
| Inventories | |
| (12,170 | ) | |
| (1,000 | ) |
| Trade payables | |
| 2,803 | | |
| 983 | |
| Other assets and other liabilities, net | |
| (3,464 | ) | |
| 2,687 | |
| Cash generated from operations | |
| 47,692 | | |
| 58,356 | |
| Income taxes paid, net | |
| (13,195 | ) | |
| (7,827 | ) |
| Net cash generated from operating activities | |
| 34,497 | | |
| 50,529 | |
| | |
| | | |
| | |
| Cash flows from/(used in) investing activities | |
| | | |
| | |
| Purchase of property, plant and equipment | |
| (13,611 | ) | |
| (10,002 | ) |
| Proceeds from sale of property, plant and equipment | |
| 882 | | |
| 247 | |
| Purchase of other intangible assets | |
| (2,325 | ) | |
| (5,711 | ) |
| Purchase of investments (including bank deposits) | |
| (137,578 | ) | |
| (120,320 | ) |
| Proceeds from sale of investments (including bank deposits) | |
| 117,468 | | |
| 100,769 | |
| Equity investments in subsidiary/associates | |
| (802 | ) | |
| (459 | ) |
| Dividend received | |
| 446 | | |
| - | |
| Interest income received | |
| 1,823 | | |
| 1,000 | |
| Loans and advances given to subsidiaries | |
| (606 | ) | |
| - | |
| Net cash used in investing activities | |
| (34,303 | ) | |
| (34,476 | ) |
| | |
| | | |
| | |
| Cash flows from/(used in) financing activities | |
| | | |
| | |
| Proceeds from issuance of equity shares (including treasury shares) | |
| 805 | | |
| 157 | |
| Proceeds from sale of treasury shares | |
| - | | |
| 211 | |
| Proceeds/(Repayment of) from short-term loans and borrowings, net | |
| 7,094 | | |
| (21,705 | ) |
| Payment of principal portion of lease liabilities | |
| (237 | ) | |
| (195 | ) |
| Dividend paid | |
| (6,648 | ) | |
| (4,979 | ) |
| Interest paid | |
| (333 | ) | |
| (458 | ) |
| Net cash from/(used in) financing activities | |
| 681 | | |
| (26,969 | ) |
| | |
| | | |
| | |
| Net increase / (decrease) in cash and cash equivalents | |
| 875 | | |
| (10,916 | ) |
| Effect of exchange rate changes on cash and cash equivalents | |
| 16 | | |
| 445 | |
| Cash and cash equivalents at the beginning of the year | |
| 1,123 | | |
| 11,594 | |
| Cash and cash equivalents at the end of the year | |
| 2,014 | | |
| 1,123 | |
| |
*Rounded
off to million. |
| |
**FVTPL (fair value
through profit or loss) |
| |
11 |
The
Board of Directors, at their meeting held on 07 May 2024, have recommended a final dividend of Rs.40 per share subject to the approval
of shareholders. |
| |
|
|
| |
12 |
The figures of the fourth
quarter are the balancing figures between audited figures in respect of the full financial year and published year to date figures
upto the third quarter of the relevant financial year. Also the figures upto the end of third quarter were only reviewed and not
subjected to audit. |
By order of the Board
For Dr. Reddy's Laboratories Limited
| |
 |
| Place: Hyderabad |
G V Prasad |
| Date: 07 May 2024 |
Co-Chairman & Managing Director |

Dr Reddys Laboratories (NYSE:RDY)
Historical Stock Chart
From Apr 2024 to May 2024

Dr Reddys Laboratories (NYSE:RDY)
Historical Stock Chart
From May 2023 to May 2024
