| Company name: | FTSE techMARK Mediscience |
| EPIC: | TMS1 | Trading Currency: | GBP |
| Market Sector: | | ISIN: | |
| Market Segment: | | Share Type: | IX |
| WWW Address: | | Description: | |
| Industry Sector: | |
| Price | Price Change [%] | Bid | Ask | Open | High | Low | Volume |
| 7,619.39 |  261.96 [3.56] 261.96 [3.56] | - | - | 7,357.43 | 7,630.58 | 7,357.43 | - |
| Market Cap. [m] | Shares In Issue [m] | Beta | EPS | DPS | PE Ratio | Yield | 52-Wks-Range |
| - | - | - | - | - | - | - | 8,764.48 - 6,304.03 |

FTSE techMARK Mediscience Key Figures
|
FTSE techMARK Mediscience Balance Sheet| %1$s Balance Sheet | | Sorry No Data Available |
|
Share Price Performance| Share Price Performance | | Sample Period † | High | Low | | 1 week | 7,630.58 | 7,288.25 |
| 4 weeks | 7,861.87 | 6,966.95 |
| 12 weeks | 8,124.91 | 6,304.03 |
| 1 year | 8,764.48 | 6,304.03 |
Share Price Chart (5 years)| Share Price Chart (5 years) | 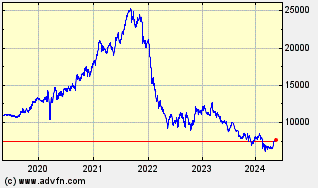 |
|
FTSE techMARK Mediscience Historic Returns| %1$s Historic Returns | | Giorni da oggi † | Open | Change | % | Open Avg. | Avg. Daily Vol [m] | Total Vol [m] | VWAP | | 1 week | 7,522.30 | 97.09 | 1.29 | 7,288.25 | - | | - |
| 4 weeks | 7,849.66 | -230.27 | -2.93 | 6,966.95 | - | | - |
| 12 weeks | 6,740.53 | 878.86 | 13.04 | 6,304.03 | - | | - |
| 26 weeks | 7,937.13 | -317.74 | -4.00 | 6,304.03 | - | | - |
| 1 year | 6,713.03 | 906.36 | 13.50 | 6,304.03 | - | | - |
| 3 years | 12,619.40 | -5,000.01 | -39.62 | 5,554.09 | - | | - |
| 5 years | 11,432.21 | -3,812.82 | -33.35 | 5,554.09 | - | | - |
| † periods calculated are whole weeks rather than calendar months | |
|
FTSE techMARK Mediscience Key Management Ratios
|
FTSE techMARK Mediscience Investment Ratios
|
FTSE techMARK Mediscience Financial Ratios
| Beta coefficients | | Beta (60-Mnth) | Beta (36-Mnth) | | Sorry No Data Available | Sorry No Data Available |
|
FTSE techMARK Mediscience Operating Ratios
|
FTSE techMARK Mediscience Dividends
|
|
FTSE techMARK Mediscience Fundamentals |
|
|
FTSE techMARK Mediscience Balance Sheet
|
FTSE techMARK Mediscience Cash Flow Statement
| FTSE techMARK Mediscience Brokers| Broker infomation is not available for this class of share. |
| | | | | | | | |
|
|
|