Try SCHX for Cheap Large Cap ETF Exposure - ETF News And Commentary
April 12 2013 - 7:15AM
Zacks
For American investors focused on the U.S. market, events went
quite well in the first quarter. Stocks broadly moved higher thanks
to solid data and minimal clouds on the horizon, while many are
expecting strong returns ahead as well.
Now that we are in Q2 though, data hasn’t been quite as
favorable, with some key figures like retail sales and jobs, giving
underwhelming reports. Still, the market has been able to largely
shrug these items off and broadly move higher.
The focus now is on large caps, as the added risks and the big
run up in Q1 have dulled the appeal of riskier small cap shares.
This has left many focusing in on large cap ETFs which offer up
solid dividends and a great level of safety.
While many investors zero in on ETFs like IVV and SPY, there is
also another great choice out there the Schwab U.S.
Large-Cap ETF (SCHX).
While this fund is quite similar to others in the space, it does
beat out others in the field on cost (read ETFs for 3 of the
Cheapest Markets in the World)
When compared to other broad based large cap equity ETFs, this
fund has a major advantage in terms of expenses. The largest and
the most popular large cap ETF, the SPDR S&P 500 ETF (SPY) has
an expense ratio of 9 basis points and the iShares Core S&P 500
(IVV) charges 7 basis points.
Compared to these broad based large cap ETFs, SCHX charges a
paltry 4 basis points in fees and expenses making it one of the
most cost effective ways to gain a basket exposure in the large cap
space.
SCHX in Focus
The ETF was launched in November of 2009 and tracks the
performance and yield of the Dow Jones U.S. Large-Cap Total Stock
Market Index before fees and expenses. The index is a float
adjusted market capitalization weighted benchmark and measures the
performance of the large cap space in the U.S. equity markets. It
is comprised of a universe of 750 stocks in all.
SCHX has a fairly large sample size of 750 stocks which is
comprised of predominantly large cap stocks with some mid caps
filling out the rest of the portfolio. Considering this fact, most
investors would give SPY a higher rank over SCHX in terms of a pure
play in the large cap U.S. equity space (see 3 Ways to Play the
S&P 500 Rally with ETFs).
However, this is clearly not the case. SCHX has a beta value of
0.99 and an R-Squared value of 99.56% versus the S&P 500 making
the ETF almost perfectly (positive) correlated with the large cap
U.S. equities. The reason is that mid caps which are included in
the ETF receive relatively smaller weight due to the market
capitalization weighting technique of the ETF.
SCHX has a maximum exposure in Information Technology (18.40%),
Financials (16.60%), Consumer Discretionary (12.10%), Healthcare
(11.70%) and Energy (10.70%). From an individual holdings point of
view Apple Inc., Exxon Mobile, General Electric, Chevron, IBM and
Microsoft Corp are among some of its biggest holdings (see ETF
Option Strategy: Bull Call Spread).
The ETF returned 16.09% for the fiscal year 2012. SCHX currently
has a Zacks Rank of 3 or Hold with a Medium risk
outlook.
Bottom Line
While it is true that the outlook for U.S equities certainly
remains on the positive side, concerns are still present over an
earnings slowdown on the corporate front. Nevertheless, with lack
of clarity over sector specific performances in the near term,
broad market ETFs might still be the darling of investors for the
time being as they were in the previous quarter (read Q4 ETF Asset
Report: Broad Market ETFs Reign).
Given this, investors may want to look at this cheaper fund for
exposure. A few basis points might not seem like a lot, but over
time, this can really add up, suggesting that at least a few
investors should make a closer inspection of this
somewhat-overlooked ETF in the large cap space.
Want the latest recommendations from Zacks Investment Research?
Today, you can download 7 Best Stocks for the Next 30
Days. Click to get this free report >>
ISHARS-SP500 (IVV): ETF Research Reports
SCHWAB-US LC (SCHX): ETF Research Reports
SPDR-SP 500 TR (SPY): ETF Research Reports
To read this article on Zacks.com click here.
Zacks Investment Research
Want the latest recommendations from Zacks Investment Research?
Today, you can download 7 Best Stocks for the Next 30 Days. Click
to get this free report
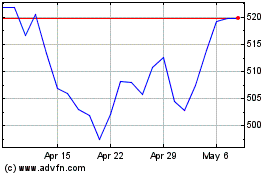
S&P 500 (AMEX:IVV)
Historical Stock Chart
From Nov 2024 to Dec 2024

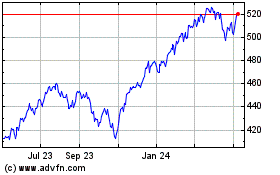
S&P 500 (AMEX:IVV)
Historical Stock Chart
From Dec 2023 to Dec 2024
