Asure Software (NASDAQ: ASUR), a leading provider of workforce
management software, today announced financial results for the 2009
fiscal second quarter, ended January 31, 2009.
Highlights included:
--  Meeting Room Manager (MRM) Software-as-a-Service (SaaS) bookings
    increased 119% over Q1 2009.
--  Overall gross margins increased to 81% in Q2 2009 from 80% in Q1 2009,
    and from 78% in Q4 2008.
--  Overall operating expenses decreased by 5% in Q2 2009 versus Q1 2009.
--  Previously announced plans to privatize the company remain on track.
"Although revenue declined, strong growth in MRM SaaS business
in the second quarter convinces us of our continued revenue growth
potential," commented Richard Snyder, Chairman and Chief Executive
Officer of Asure Software. "In particular, new MRM SaaS bookings
were up 119% over the first quarter, and up 126% year over year. In
addition, during Q2 2009, we added nine Fortune 500 customers,
processed our ten-millionth paystub with our iEmployee business and
consummated our largest SaaS deal to date."
"Our plans for going private remain on track, with our
preliminary proxy filing currently under standard review by the
SEC. Completing this process is expected to contribute
approximately $1 million annually to the bottom line," Mr. Snyder
concluded.
Additional First-Quarter Highlights
On a sequential basis, Asure's total revenues declined
approximately 13% in Q2 2009, to $2.4 million, from the $2.8
million recorded in Q1 2009. Compared to Q2 2008 revenues of $2.7
million, the year-over-year decline in quarterly revenues totaled
approximately 11%.
Operating expenses declined in Q2 2009 versus Q1 2009 by 5% due
to reduced legal expenses relating to the company's building
assignment. By implementing a 10% salary reduction through the
balance of the fiscal year and other cost-cutting measures, Asure
management expects to reduce Q3 2009 quarterly operating expenses
by approximately $300,000.
As of January 31, 2009, the Company had working capital of $7.3
million, and cash, cash equivalents and short-term investments
totaling $12.1 million on its balance sheet.
Conference Call Details
Asure Software has scheduled a conference call for today,
Thursday, March 12, 2009 at 11:00 a.m. ET (10:00 a.m. CT) to
discuss its most recent financial results and outlook.
Participating in the call will be Richard Snyder, Chairman and
Chief Executive Officer; Jay Peterson, Chief Financial Officer; and
Nancy Harris, Chief Operating Officer.
To take part, please dial 866-700-7173 ten minutes before the
conference call begins, ask for the Asure Software event and use
passcode 16647848. International callers should dial 617-213-8838
and reference the same passcode, 16647848.
Investors, analysts, media and the general public will also have
the opportunity to listen to the conference call in listen-only
mode via the Internet by visiting the investor relations page of
Asure's web site at www.asuresoftware.com. To monitor the live
call, please visit the web site at least 15 minutes early to
register, download and install any necessary audio software. For
those who cannot listen to the live broadcast, an archived replay
will be available shortly after the call on the investor relations
page of the Company's web site at www.asuresoftware.com.
About Asure Software
Headquartered in Austin, Texas, Asure Software (ASUR), (a d/b/a
of Forgent Networks, Inc.), empowers small to mid-size
organizations and divisions of large enterprises to operate more
efficiently, increase worker productivity and reduce costs through
a comprehensive suite of on-demand workforce management software
and services. Asure's market-leading suite includes products that
optimize workforce time and attendance tracking, benefits
enrollment and tracking, pay stubs and W2 documentation, expense
management, and meeting and event management. With additional
offices in Warwick, Rhode Island, Vancouver, British Columbia, and
Mumbai, India, Asure serves 3,500 customers around the world. For
more information, please visit www.asuresoftware.com.
"Safe Harbor" Statement under the Private Securities Litigation
Reform Act of 1995:
Statements in this press release regarding Forgent's business
which are not historical facts are "forward-looking statements"
that involve risks and uncertainties. Such risks and uncertainties
could cause actual results to differ from those contained in the
forward-looking statements.
                              FORGENT NETWORKS, INC.
                           CONSOLIDATED BALANCE SHEETS
                   (Amounts in thousands, except per share data)

                                                  JANUARY 31,   JULY 31,
                                                     2009         2008
                                                  -----------  -----------
                                                  (UNAUDITED)

ASSETS
Current Assets:
  Cash and cash equivalents                       $     9,056  $    12,062
  Short-term investments                                3,074        2,627
  Accounts receivable, net of allowance for
   doubtful accounts of $56 and $41 at January
   31, 2009 and July 31, 2008, respectively             1,528        1,718
  Inventory                                                31           74
  Prepaid expenses and other current assets               222          191
                                                  -----------  -----------
     Total Current Assets                              13,911       16,672

Property and equipment, net                               775          907
Intangible assets, net                                  4,338        4,729
                                                  -----------  -----------
                                                  $    19,024  $    22,308
                                                  ===========  ===========


LIABILITIES AND STOCKHOLDERS' EQUITY
Current Liabilities:
  Accounts payable                                $     3,779  $     3,778
  Accrued compensation and benefits                       157          203
  Lease impairment and advance                            336          373
  Other accrued liabilities                               455          384
  Deferred revenue                                      1,901        1,844
                                                  -----------  -----------
     Total Current Liabilities                          6,628        6,582

Long-Term Liabilities:
  Deferred revenue                                         53           25
  Lease impairment and advance                            375          564
  Other long-term obligations                             170          217
                                                  -----------  -----------
     Total Long-Term Liabilities                          598          806

Stockholders' Equity:
  Preferred stock, $.01 par value; 10,000 shares
   authorized; none issued or outstanding                  --           --
  Common stock, $.01 par value; 40,000 shares
   authorized; 32,901 and 32,892 shares issued;
   31,111 and 31,102 shares outstanding at
   January 31, 2009 and July 31, 2008, respectively       329          329
  Treasury stock at cost, 1,790 shares at
   January 31, 2009 and July 31, 2008                  (4,815)      (4,815)
  Additional paid-in capital                          270,712      270,657
  Accumulated deficit                                (254,292)    (251,214)
  Accumulated other comprehensive income                 (136)         (37)
                                                  -----------  -----------
     Total Stockholders' Equity                        11,798       14,920
                                                  -----------  -----------
                                                  $    19,024  $    22,308
                                                  ===========  ===========


                              FORGENT NETWORKS, INC.
                      CONSOLIDATED STATEMENTS OF OPERATIONS
                  (Amounts in thousands, except per share data)

                                         FOR THE             FOR THE
                                    THREE MONTHS ENDED   SIX MONTHS ENDED
                                        JANUARY 31,         JANUARY 31,
                                      2009      2008      2009      2008
                                    --------  --------  --------  --------
                                       (UNAUDITED)         (UNAUDITED)

Revenues                            $  2,421  $  2,734  $  5,213  $  4,608
Cost of Sales                           (469)     (629)   (1,033)     (958)
                                    --------  --------  --------  --------
    Gross Margin                       1,952     2,105     4,180     3,650

OPERATING EXPENSES:
    Selling, general and
     administrative                    3,034     2,962     6,231     5,402
    Research and development             525       640     1,086       931
    Amortization of intangible
     assets                              149       155       298       191
                                    --------  --------  --------  --------
      Total Operating Expenses         3,708     3,757     7,615     6,524

LOSS FROM OPERATIONS                  (1,756)   (1,652)   (3,435)   (2,874)

OTHER INCOME AND (EXPENSES):
    Interest income                       35       195        89       533
    Foreign currency translation         (22)       (4)       99       (11)
    Gain on sale of assets               250        --       250        --
    Interest expense and other           (23)      (16)      (33)      (29)
                                    --------  --------  --------  --------
      Total Other Income                 240       175       405       493

LOSS FROM OPERATIONS, BEFORE
 INCOME TAXES                         (1,516)   (1,477)   (3,030)   (2,381)
Provision for income taxes               (23)       (7)      (48)      (21)
                                    --------  --------  --------  --------
NET LOSS                            $ (1,539) $ (1,484) $ (3,078) $ (2,402)
                                    ========  ========  ========  ========

BASIC AND DILUTED LOSS PER SHARE:
    Net loss per share - basic and
     diluted                        $  (0.05) $  (0.05) $  (0.10) $  (0.08)
                                    ========  ========  ========  ========

WEIGHTED AVERAGE SHARES OUTSTANDING:
    Basic                             31,110    30,940    31,107    29,017
    Diluted                           31,110    30,940    31,107    29,017
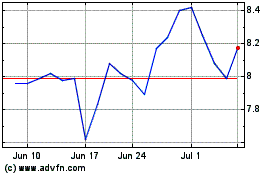
Asure Software (NASDAQ:ASUR)
Historical Stock Chart
From May 2024 to Jun 2024

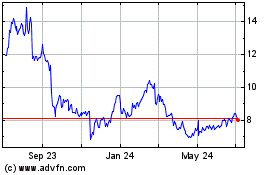
Asure Software (NASDAQ:ASUR)
Historical Stock Chart
From Jun 2023 to Jun 2024
