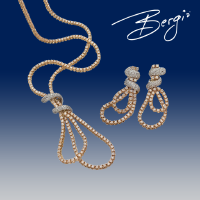

The current BRGO market cap is 289.83k. The company's latest EPS is USD -0.0014 and P/E is 0.00.
| Year End December 30 2023 | 2019 | 2020 | 2021 | 2022 | 2023 |
|---|---|---|---|---|---|
| USD ($) | USD ($) | USD ($) | USD ($) | USD ($) | |
| Total Revenue | 601k | 585k | 11M | 9.82M | 4.09M |
| Operating Income | -146k | -264k | -1.48M | -2.37M | -1.09M |
| Net Income | -3.04M | -148k | -2.64M | -5.12M | -4.09M |
| Year End December 30 2023 | 2019 | 2020 | 2021 | 2022 | 2023 |
|---|---|---|---|---|---|
| USD ($) | USD ($) | USD ($) | USD ($) | USD ($) | |
| Total Assets | 1.49M | 1.48M | 10.78M | 9.47M | 4.58M |
| Total Liabilities | 2.1M | 1.65M | 7.04M | 4.52M | 6.36M |
| Total Equity | -613k | -171k | 3.74M | 4.95M | -1.78M |
| Year End December 30 2023 | 2019 | 2020 | 2021 | 2022 | 2023 |
|---|---|---|---|---|---|
| USD ($) | USD ($) | USD ($) | USD ($) | USD ($) | |
| Operating | -84k | -180k | -2.18M | -1.92M | -705k |
| Investing | -8k | N/A | -886k | N/A | -5k |
| Financing | 115k | 227k | 4.09M | 1.29M | 488k |
| Market Cap | 289.83k |
| Price to Earnings Ratio | 0.00 |
| Price to Sales Ratio | 0 |
| Price to Cash Ratio | 0 |
| Price to Book Ratio | 0 |
| Dividend Yield | - |
| Shares Outstanding | 2.9B |
| Average Volume (1 week) | 1.03M |
| Average Volume (1 Month) | 1.38M |
| 52 Week Change | -50.00% |
| 52 Week High | 0.0002 |
| 52 Week Low | 0.000001 |
| Spread (Intraday) | 0 (0%) |
| Company Name | Bergio International Inc (PK) |
| Address |
108 west 13th st wilmington, delaware 19801 |
| Website | https://www.bergio.com |
| Industry | jewelry,silverwr,plated ware (3910) |

It looks like you are not logged in. Click the button below to log in and keep track of your recent history.