000085042912/312022Q3FALSE00008504292023-01-012023-06-3000008504292023-08-04xbrli:shares00008504292023-06-30iso4217:USD00008504292022-12-3100008504292023-04-012023-06-3000008504292022-04-012022-06-3000008504292022-01-012022-06-300000850429us-gaap:ProductMember2023-04-012023-06-300000850429us-gaap:ProductMember2022-04-012022-06-300000850429us-gaap:ProductMember2023-01-012023-06-300000850429us-gaap:ProductMember2022-01-012022-06-300000850429us-gaap:ShippingAndHandlingMember2023-04-012023-06-300000850429us-gaap:ShippingAndHandlingMember2022-04-012022-06-300000850429us-gaap:ShippingAndHandlingMember2023-01-012023-06-300000850429us-gaap:ShippingAndHandlingMember2022-01-012022-06-30iso4217:USDxbrli:shares0000850429us-gaap:RetainedEarningsMember2023-04-012023-06-3000008504292021-12-3100008504292022-06-300000850429us-gaap:CommonStockMember2023-03-310000850429us-gaap:RetainedEarningsMember2023-03-310000850429tg:TrustForSavingRestorationPlanMember2023-03-310000850429us-gaap:AccumulatedOtherComprehensiveIncomeMember2023-03-3100008504292023-03-310000850429us-gaap:AccumulatedOtherComprehensiveIncomeMember2023-04-012023-06-300000850429us-gaap:CommonStockMember2023-04-012023-06-300000850429tg:TrustForSavingRestorationPlanMember2023-04-012023-06-300000850429us-gaap:CommonStockMember2023-06-300000850429us-gaap:RetainedEarningsMember2023-06-300000850429tg:TrustForSavingRestorationPlanMember2023-06-300000850429us-gaap:AccumulatedOtherComprehensiveIncomeMember2023-06-300000850429us-gaap:CommonStockMember2022-12-310000850429us-gaap:RetainedEarningsMember2022-12-310000850429tg:TrustForSavingRestorationPlanMember2022-12-310000850429us-gaap:AccumulatedOtherComprehensiveIncomeMember2022-12-310000850429us-gaap:RetainedEarningsMember2023-01-012023-06-300000850429us-gaap:AccumulatedOtherComprehensiveIncomeMember2023-01-012023-06-300000850429us-gaap:CommonStockMember2023-01-012023-06-300000850429tg:TrustForSavingRestorationPlanMember2023-01-012023-06-300000850429us-gaap:CommonStockMember2022-03-310000850429us-gaap:RetainedEarningsMember2022-03-310000850429tg:TrustForSavingRestorationPlanMember2022-03-310000850429us-gaap:AccumulatedOtherComprehensiveIncomeMember2022-03-3100008504292022-03-310000850429us-gaap:AccumulatedOtherComprehensiveIncomeMember2022-04-012022-06-300000850429us-gaap:RetainedEarningsMember2022-04-012022-06-300000850429us-gaap:CommonStockMember2022-04-012022-06-300000850429tg:TrustForSavingRestorationPlanMember2022-04-012022-06-300000850429us-gaap:CommonStockMember2022-06-300000850429us-gaap:RetainedEarningsMember2022-06-300000850429tg:TrustForSavingRestorationPlanMember2022-06-300000850429us-gaap:AccumulatedOtherComprehensiveIncomeMember2022-06-300000850429us-gaap:CommonStockMember2021-12-310000850429us-gaap:RetainedEarningsMember2021-12-310000850429tg:TrustForSavingRestorationPlanMember2021-12-310000850429us-gaap:AccumulatedOtherComprehensiveIncomeMember2021-12-310000850429us-gaap:AccumulatedOtherComprehensiveIncomeMember2022-01-012022-06-300000850429us-gaap:RetainedEarningsMember2022-01-012022-06-300000850429us-gaap:CommonStockMember2022-01-012022-06-300000850429tg:TrustForSavingRestorationPlanMember2022-01-012022-06-300000850429tg:SurfaceProtectionFilmsMember2023-04-012023-06-300000850429tg:SurfaceProtectionFilmsMember2023-06-300000850429tg:SurfaceProtectionFilmsMember2022-12-310000850429us-gaap:PensionPlansDefinedBenefitMember2022-02-092022-02-090000850429us-gaap:PensionPlansDefinedBenefitMember2023-04-012023-06-300000850429us-gaap:PensionPlansDefinedBenefitMember2022-04-012022-06-300000850429us-gaap:OtherPostretirementBenefitPlansDefinedBenefitMember2023-04-012023-06-300000850429us-gaap:OtherPostretirementBenefitPlansDefinedBenefitMember2022-04-012022-06-300000850429us-gaap:PensionPlansDefinedBenefitMember2023-01-012023-06-300000850429us-gaap:PensionPlansDefinedBenefitMember2022-01-012022-06-300000850429us-gaap:OtherPostretirementBenefitPlansDefinedBenefitMember2023-01-012023-06-300000850429us-gaap:OtherPostretirementBenefitPlansDefinedBenefitMember2022-01-012022-06-300000850429tg:AccruedExpensesMember2023-06-300000850429tg:KaleoMember2022-04-012022-06-300000850429tg:KaleoMember2023-01-012023-06-300000850429tg:KaleoMember2022-01-012022-06-300000850429tg:KaleoMember2023-01-012023-03-310000850429us-gaap:AccumulatedTranslationAdjustmentMember2023-03-310000850429us-gaap:AccumulatedGainLossNetCashFlowHedgeParentMember2023-03-310000850429us-gaap:AccumulatedDefinedBenefitPlansAdjustmentMember2023-03-310000850429us-gaap:AccumulatedTranslationAdjustmentMember2023-04-012023-06-300000850429us-gaap:AccumulatedGainLossNetCashFlowHedgeParentMember2023-04-012023-06-300000850429us-gaap:AccumulatedDefinedBenefitPlansAdjustmentMember2023-04-012023-06-300000850429us-gaap:AccumulatedTranslationAdjustmentMember2023-06-300000850429us-gaap:AccumulatedGainLossNetCashFlowHedgeParentMember2023-06-300000850429us-gaap:AccumulatedDefinedBenefitPlansAdjustmentMember2023-06-300000850429us-gaap:AccumulatedTranslationAdjustmentMember2022-12-310000850429us-gaap:AccumulatedGainLossNetCashFlowHedgeParentMember2022-12-310000850429us-gaap:AccumulatedDefinedBenefitPlansAdjustmentMember2022-12-310000850429us-gaap:AccumulatedTranslationAdjustmentMember2023-01-012023-06-300000850429us-gaap:AccumulatedGainLossNetCashFlowHedgeParentMember2023-01-012023-06-300000850429us-gaap:AccumulatedDefinedBenefitPlansAdjustmentMember2023-01-012023-06-300000850429us-gaap:AccumulatedTranslationAdjustmentMember2022-03-310000850429us-gaap:AccumulatedGainLossNetCashFlowHedgeParentMember2022-03-310000850429us-gaap:AccumulatedDefinedBenefitPlansAdjustmentMember2022-03-310000850429us-gaap:AccumulatedTranslationAdjustmentMember2022-04-012022-06-300000850429us-gaap:AccumulatedGainLossNetCashFlowHedgeParentMember2022-04-012022-06-300000850429us-gaap:AccumulatedDefinedBenefitPlansAdjustmentMember2022-04-012022-06-300000850429us-gaap:AccumulatedTranslationAdjustmentMember2022-06-300000850429us-gaap:AccumulatedGainLossNetCashFlowHedgeParentMember2022-06-300000850429us-gaap:AccumulatedDefinedBenefitPlansAdjustmentMember2022-06-300000850429us-gaap:AccumulatedTranslationAdjustmentMember2021-12-310000850429us-gaap:AccumulatedGainLossNetCashFlowHedgeParentMember2021-12-310000850429us-gaap:AccumulatedDefinedBenefitPlansAdjustmentMember2021-12-310000850429us-gaap:AccumulatedTranslationAdjustmentMember2022-01-012022-06-300000850429us-gaap:AccumulatedGainLossNetCashFlowHedgeParentMember2022-01-012022-06-300000850429us-gaap:AccumulatedDefinedBenefitPlansAdjustmentMember2022-01-012022-06-300000850429tg:AluminumFuturesContractsMember2023-06-30tg:lbs0000850429tg:AluminumFuturesContractsMember2022-12-310000850429tg:AluminumFuturesContractsMemberus-gaap:PrepaidExpensesAndOtherCurrentAssetsMemberus-gaap:DesignatedAsHedgingInstrumentMember2023-06-300000850429tg:AluminumFuturesContractsMemberus-gaap:PrepaidExpensesAndOtherCurrentAssetsMemberus-gaap:DesignatedAsHedgingInstrumentMember2022-12-310000850429tg:AluminumFuturesContractsMembertg:AccruedExpensesMemberus-gaap:DesignatedAsHedgingInstrumentMember2023-06-300000850429tg:AluminumFuturesContractsMembertg:AccruedExpensesMemberus-gaap:DesignatedAsHedgingInstrumentMember2022-12-310000850429tg:AluminumFuturesContractsMemberus-gaap:OtherNoncurrentLiabilitiesMemberus-gaap:DesignatedAsHedgingInstrumentMember2023-06-300000850429tg:AluminumFuturesContractsMemberus-gaap:OtherNoncurrentLiabilitiesMemberus-gaap:DesignatedAsHedgingInstrumentMember2022-12-310000850429tg:Oct2018Membertg:TerphaneLtdaMember2023-01-012023-06-30iso4217:BRL0000850429tg:TerphaneLtdaMembertg:Jul23Member2023-06-30xbrli:pure0000850429tg:TerphaneLtdaMembertg:Aug23Member2023-06-300000850429tg:TerphaneLtdaMembertg:Sep23Member2023-06-300000850429tg:Oct23Membertg:TerphaneLtdaMember2023-06-300000850429tg:TerphaneLtdaMembertg:Nov23Member2023-06-300000850429tg:TerphaneLtdaMembertg:Dec23Member2023-06-300000850429tg:TerphaneLtdaMembertg:Jan24Member2023-06-300000850429tg:TerphaneLtdaMembertg:Feb24Member2023-06-300000850429tg:Mar24Membertg:TerphaneLtdaMember2023-06-300000850429tg:Apr24Membertg:TerphaneLtdaMember2023-06-300000850429tg:May24Membertg:TerphaneLtdaMember2023-06-300000850429tg:TerphaneLtdaMembertg:Jun24Member2023-06-300000850429tg:TerphaneLtdaMembertg:Jul24Member2023-06-300000850429tg:Aug24Membertg:TerphaneLtdaMember2023-06-300000850429tg:Sep24Membertg:TerphaneLtdaMember2023-06-300000850429tg:TerphaneLtdaMembertg:Oct24Member2023-06-300000850429tg:TerphaneLtdaMembertg:Nov24Member2023-06-300000850429tg:Dec24Membertg:TerphaneLtdaMember2023-06-300000850429tg:TerphaneLtdaMember2023-06-300000850429us-gaap:PrepaidExpensesAndOtherCurrentAssetsMemberus-gaap:DesignatedAsHedgingInstrumentMember2023-06-300000850429us-gaap:PrepaidExpensesAndOtherCurrentAssetsMemberus-gaap:DesignatedAsHedgingInstrumentMember2022-12-310000850429us-gaap:OtherNoncurrentAssetsMemberus-gaap:DesignatedAsHedgingInstrumentMember2023-06-300000850429us-gaap:OtherNoncurrentAssetsMemberus-gaap:DesignatedAsHedgingInstrumentMember2022-12-310000850429tg:AccruedExpensesMemberus-gaap:DesignatedAsHedgingInstrumentMember2023-06-300000850429tg:AccruedExpensesMemberus-gaap:DesignatedAsHedgingInstrumentMember2022-12-310000850429tg:AluminumFuturesContractsMemberus-gaap:CostOfSalesMemberus-gaap:CashFlowHedgingMember2023-04-012023-06-300000850429tg:AluminumFuturesContractsMemberus-gaap:CostOfSalesMemberus-gaap:CashFlowHedgingMember2022-04-012022-06-300000850429tg:ForeignCurrencyForwardsAndOptionsMemberus-gaap:CostOfSalesMemberus-gaap:CashFlowHedgingMember2023-04-012023-06-300000850429tg:ForeignCurrencyForwardsAndOptionsMemberus-gaap:SellingGeneralAndAdministrativeExpensesMemberus-gaap:CashFlowHedgingMember2023-04-012023-06-300000850429tg:ForeignCurrencyForwardsAndOptionsMemberus-gaap:CostOfSalesMemberus-gaap:CashFlowHedgingMember2022-04-012022-06-300000850429tg:ForeignCurrencyForwardsAndOptionsMemberus-gaap:SellingGeneralAndAdministrativeExpensesMemberus-gaap:CashFlowHedgingMember2022-04-012022-06-300000850429tg:AluminumFuturesContractsMemberus-gaap:CostOfSalesMemberus-gaap:CashFlowHedgingMember2023-01-012023-06-300000850429tg:AluminumFuturesContractsMemberus-gaap:CostOfSalesMemberus-gaap:CashFlowHedgingMember2022-01-012022-06-300000850429tg:ForeignCurrencyForwardsAndOptionsMemberus-gaap:CostOfSalesMemberus-gaap:CashFlowHedgingMember2023-01-012023-06-300000850429tg:ForeignCurrencyForwardsAndOptionsMemberus-gaap:SellingGeneralAndAdministrativeExpensesMemberus-gaap:CashFlowHedgingMember2023-01-012023-06-300000850429tg:ForeignCurrencyForwardsAndOptionsMemberus-gaap:CostOfSalesMemberus-gaap:CashFlowHedgingMember2022-01-012022-06-300000850429tg:ForeignCurrencyForwardsAndOptionsMemberus-gaap:SellingGeneralAndAdministrativeExpensesMemberus-gaap:CashFlowHedgingMember2022-01-012022-06-300000850429tg:BrazilianMember2023-01-012023-06-300000850429tg:TerphaneLtdaMember2023-01-012023-06-300000850429tg:AluminumExtrusionsMember2023-04-012023-06-300000850429tg:AluminumExtrusionsMember2022-04-012022-06-300000850429tg:AluminumExtrusionsMember2023-01-012023-06-300000850429tg:AluminumExtrusionsMember2022-01-012022-06-300000850429tg:PEFilmsMember2023-04-012023-06-300000850429tg:PEFilmsMember2022-04-012022-06-300000850429tg:PEFilmsMember2023-01-012023-06-300000850429tg:PEFilmsMember2022-01-012022-06-300000850429tg:FlexiblePackagingFilmsMemberDomain2023-04-012023-06-300000850429tg:FlexiblePackagingFilmsMemberDomain2022-04-012022-06-300000850429tg:FlexiblePackagingFilmsMemberDomain2023-01-012023-06-300000850429tg:FlexiblePackagingFilmsMemberDomain2022-01-012022-06-300000850429tg:FlexiblePackagingFilmsMember2023-04-012023-06-300000850429tg:FlexiblePackagingFilmsMember2022-04-012022-06-300000850429tg:FlexiblePackagingFilmsMember2023-01-012023-06-300000850429tg:FlexiblePackagingFilmsMember2022-01-012022-06-300000850429tg:KaleoMember2023-01-012023-01-310000850429tg:AluminumExtrusionsMember2023-06-300000850429tg:AluminumExtrusionsMember2022-12-310000850429tg:PEFilmsMember2023-06-300000850429tg:PEFilmsMember2022-12-310000850429tg:FlexiblePackagingFilmsMember2023-06-300000850429tg:FlexiblePackagingFilmsMember2022-12-310000850429tg:SubtotalMember2023-06-300000850429tg:SubtotalMember2022-12-310000850429tg:GeneralCorporateMember2023-06-300000850429tg:GeneralCorporateMember2022-12-310000850429country:US2023-04-012023-06-300000850429country:US2022-04-012022-06-300000850429country:US2023-01-012023-06-300000850429country:US2022-01-012022-06-300000850429srt:AsiaMembertg:ExportsFromUnitedStatesMember2023-04-012023-06-300000850429srt:AsiaMembertg:ExportsFromUnitedStatesMember2022-04-012022-06-300000850429srt:AsiaMembertg:ExportsFromUnitedStatesMember2023-01-012023-06-300000850429srt:AsiaMembertg:ExportsFromUnitedStatesMember2022-01-012022-06-300000850429srt:LatinAmericaMembertg:ExportsFromUnitedStatesMember2023-04-012023-06-300000850429srt:LatinAmericaMembertg:ExportsFromUnitedStatesMember2022-04-012022-06-300000850429srt:LatinAmericaMembertg:ExportsFromUnitedStatesMember2023-01-012023-06-300000850429srt:LatinAmericaMembertg:ExportsFromUnitedStatesMember2022-01-012022-06-300000850429country:CAtg:ExportsFromUnitedStatesMember2023-04-012023-06-300000850429country:CAtg:ExportsFromUnitedStatesMember2022-04-012022-06-300000850429country:CAtg:ExportsFromUnitedStatesMember2023-01-012023-06-300000850429country:CAtg:ExportsFromUnitedStatesMember2022-01-012022-06-300000850429srt:EuropeMembertg:ExportsFromUnitedStatesMember2023-04-012023-06-300000850429srt:EuropeMembertg:ExportsFromUnitedStatesMember2022-04-012022-06-300000850429srt:EuropeMembertg:ExportsFromUnitedStatesMember2023-01-012023-06-300000850429srt:EuropeMembertg:ExportsFromUnitedStatesMember2022-01-012022-06-300000850429country:BRtg:OperationsOutsideUnitedStatesMember2023-04-012023-06-300000850429country:BRtg:OperationsOutsideUnitedStatesMember2022-04-012022-06-300000850429country:BRtg:OperationsOutsideUnitedStatesMember2023-01-012023-06-300000850429country:BRtg:OperationsOutsideUnitedStatesMember2022-01-012022-06-300000850429srt:AsiaMembertg:OperationsOutsideUnitedStatesMember2023-04-012023-06-300000850429srt:AsiaMembertg:OperationsOutsideUnitedStatesMember2022-04-012022-06-300000850429srt:AsiaMembertg:OperationsOutsideUnitedStatesMember2023-01-012023-06-300000850429srt:AsiaMembertg:OperationsOutsideUnitedStatesMember2022-01-012022-06-300000850429tg:NonresidentialBuildingAndConstructionMembertg:AluminumExtrusionsMember2023-04-012023-06-300000850429tg:NonresidentialBuildingAndConstructionMembertg:AluminumExtrusionsMember2022-04-012022-06-300000850429tg:NonresidentialBuildingAndConstructionMembertg:AluminumExtrusionsMember2023-01-012023-06-300000850429tg:NonresidentialBuildingAndConstructionMembertg:AluminumExtrusionsMember2022-01-012022-06-300000850429tg:ConsumerDurablesMembertg:AluminumExtrusionsMember2023-04-012023-06-300000850429tg:ConsumerDurablesMembertg:AluminumExtrusionsMember2022-04-012022-06-300000850429tg:ConsumerDurablesMembertg:AluminumExtrusionsMember2023-01-012023-06-300000850429tg:ConsumerDurablesMembertg:AluminumExtrusionsMember2022-01-012022-06-300000850429tg:AutomotiveMembertg:AluminumExtrusionsMember2023-04-012023-06-300000850429tg:AutomotiveMembertg:AluminumExtrusionsMember2022-04-012022-06-300000850429tg:AutomotiveMembertg:AluminumExtrusionsMember2023-01-012023-06-300000850429tg:AutomotiveMembertg:AluminumExtrusionsMember2022-01-012022-06-300000850429tg:ResidentialBuildingAndConstructionMembertg:AluminumExtrusionsMember2023-04-012023-06-300000850429tg:ResidentialBuildingAndConstructionMembertg:AluminumExtrusionsMember2022-04-012022-06-300000850429tg:ResidentialBuildingAndConstructionMembertg:AluminumExtrusionsMember2023-01-012023-06-300000850429tg:ResidentialBuildingAndConstructionMembertg:AluminumExtrusionsMember2022-01-012022-06-300000850429tg:AluminumExtrusionsMembertg:ElectricalMember2023-04-012023-06-300000850429tg:AluminumExtrusionsMembertg:ElectricalMember2022-04-012022-06-300000850429tg:AluminumExtrusionsMembertg:ElectricalMember2023-01-012023-06-300000850429tg:AluminumExtrusionsMembertg:ElectricalMember2022-01-012022-06-300000850429tg:AluminumExtrusionsMembertg:MachineryandEquipmentBNLDomain2023-04-012023-06-300000850429tg:AluminumExtrusionsMembertg:MachineryandEquipmentBNLDomain2022-04-012022-06-300000850429tg:AluminumExtrusionsMembertg:MachineryandEquipmentBNLDomain2023-01-012023-06-300000850429tg:AluminumExtrusionsMembertg:MachineryandEquipmentBNLDomain2022-01-012022-06-300000850429tg:DistributionMembertg:AluminumExtrusionsMember2023-04-012023-06-300000850429tg:DistributionMembertg:AluminumExtrusionsMember2022-04-012022-06-300000850429tg:DistributionMembertg:AluminumExtrusionsMember2023-01-012023-06-300000850429tg:DistributionMembertg:AluminumExtrusionsMember2022-01-012022-06-300000850429tg:AluminumExtrusionsMembertg:AluminumExtrusionsSubtotalMember2023-04-012023-06-300000850429tg:AluminumExtrusionsMembertg:AluminumExtrusionsSubtotalMember2022-04-012022-06-300000850429tg:AluminumExtrusionsMembertg:AluminumExtrusionsSubtotalMember2023-01-012023-06-300000850429tg:AluminumExtrusionsMembertg:AluminumExtrusionsSubtotalMember2022-01-012022-06-300000850429tg:SurfaceProtectionFilmsMembertg:PEFilmsMember2023-04-012023-06-300000850429tg:SurfaceProtectionFilmsMembertg:PEFilmsMember2022-04-012022-06-300000850429tg:SurfaceProtectionFilmsMembertg:PEFilmsMember2023-01-012023-06-300000850429tg:SurfaceProtectionFilmsMembertg:PEFilmsMember2022-01-012022-06-300000850429tg:OverwrapPackagingMembertg:PEFilmsMember2023-04-012023-06-300000850429tg:OverwrapPackagingMembertg:PEFilmsMember2022-04-012022-06-300000850429tg:OverwrapPackagingMembertg:PEFilmsMember2023-01-012023-06-300000850429tg:OverwrapPackagingMembertg:PEFilmsMember2022-01-012022-06-300000850429tg:PEFilmsMembertg:FilmProductsSubtotalMember2023-04-012023-06-300000850429tg:PEFilmsMembertg:FilmProductsSubtotalMember2022-04-012022-06-300000850429tg:PEFilmsMembertg:FilmProductsSubtotalMember2023-01-012023-06-300000850429tg:PEFilmsMembertg:FilmProductsSubtotalMember2022-01-012022-06-300000850429tg:ThirdPartyFinancialInstitutionsMember2023-06-300000850429tg:ThirdPartyFinancialInstitutionsMember2022-12-310000850429us-gaap:EmployeeSeveranceMember2023-01-012023-06-300000850429us-gaap:OperatingExpenseMember2023-01-012023-06-300000850429us-gaap:OtherExpenseMember2023-01-012023-06-300000850429tg:SecuredRevolvingCreditFacilityMember2023-04-012023-06-300000850429tg:SecuredRevolvingCreditFacilityMemberus-gaap:SubsequentEventMember2023-07-012024-03-310000850429tg:SecuredRevolvingCreditFacilityMemberus-gaap:SubsequentEventMember2024-04-012024-06-300000850429tg:SecuredRevolvingCreditFacilityMemberus-gaap:SubsequentEventMember2024-07-012024-09-300000850429tg:SecuredRevolvingCreditFacilityMemberus-gaap:SubsequentEventMember2024-10-012024-12-310000850429tg:SecuredRevolvingCreditFacilityMemberus-gaap:SubsequentEventMember2023-07-012024-06-300000850429tg:SecuredRevolvingCreditFacilityMemberus-gaap:SubsequentEventMember2023-07-012023-09-30
UNITED STATES
SECURITIES AND EXCHANGE COMMISSION
Washington, D.C. 20549
FORM 10-Q
(Mark One) | | | | | |
| x | QUARTERLY REPORT PURSUANT TO SECTION 13 OR 15(d) OF THE SECURITIES EXCHANGE ACT OF 1934 |
For the quarterly period ended June 30, 2023
OR | | | | | |
| ¨ | TRANSITION REPORT PURSUANT TO SECTION 13 OR 15(d) OF THE SECURITIES EXCHANGE ACT OF 1934 |
For the transition period from to
Commission file number 1-10258
Tredegar Corporation
(Exact Name of Registrant as Specified in Its Charter)
| | | | | | | | |
| Virginia | | 54-1497771 |
(State or Other Jurisdiction of
Incorporation or Organization) | | (I.R.S. Employer
Identification No.) |
| | | | | | | | | | | |
| 1100 Boulders Parkway | | |
| Richmond, | Virginia | | 23225 |
| (Address of Principal Executive Offices) | | (Zip Code) |
Registrant’s Telephone Number, Including Area Code: (804) 330-1000
Securities registered pursuant to Section 12(b) of the Act: | | | | | | | | |
| Title of each class | Trading Symbol(s) | Name of each exchange on which registered |
| Common stock, no par value | TG | New York Stock Exchange |
Indicate by check mark whether the registrant (1) has filed all reports required to be filed by Section 13 or 15(d) of the Securities Exchange Act of 1934 during the preceding 12 months (or for such shorter period that the registrant was required to file such reports), and (2) has been subject to such filing requirements for the past 90 days. Yes x No ¨
Indicate by check mark whether the registrant has submitted electronically every Interactive Data File required to be submitted pursuant to Rule 405 of Regulation S-T (232.405 of this chapter) during the preceding 12 months (or for such shorter period that the registrant was required to submit such files). Yes x No ¨
Indicate by check mark whether the registrant is a large accelerated filer, an accelerated filer, a non-accelerated filer, a smaller reporting company, or an emerging growth company. See the definitions of “large accelerated filer,” “accelerated filer,” “smaller reporting company,” and “emerging growth company” in Rule 12b-2 of the Exchange Act. | | | | | | | | | | | | | | | | | | | | | | | |
| Large accelerated filer | | ¨ | Accelerated filer | x | Smaller reporting company | | ☐ |
| | | | | |
| Non-accelerated filer | | ¨ | | Emerging growth company | | ☐ |
If an emerging growth company, indicate by check mark if the registrant has elected not to use the extended transition period for complying with any new or revised financial accounting standards provided pursuant to Section 13(a) of the Exchange Act. ¨
Indicate by check mark whether the registrant is a shell company (as defined in Rule 12b-2 of the Exchange Act). Yes ☐ No x
The number of shares of Common Stock, no par value, outstanding as of August 4, 2023: 34,384,677
Tredegar Corporation
Table of Contents
PART I - FINANCIAL INFORMATION
Item 1. Financial Statements.
Tredegar Corporation
Condensed Consolidated Balance Sheets
(In Thousands, Except Share Data)
(Unaudited) | | | | | | | | | | | |
| June 30, | | December 31, |
| 2023 | | 2022 |
| Assets | | | |
| Current assets: | | | |
| Cash and cash equivalents | $ | 21,193 | | | $ | 19,232 | |
| Accounts and other receivables, net | 79,139 | | | 84,544 | |
| Income taxes recoverable | 1,216 | | | 733 | |
| Inventories | 86,692 | | | 127,771 | |
| Prepaid expenses and other | 10,214 | | | 10,304 | |
| Total current assets | 198,454 | | | 242,584 | |
| Property, plant and equipment, at cost | 545,048 | | | 531,921 | |
| Less: accumulated depreciation | (355,156) | | | (345,510) | |
| Net property, plant and equipment | 189,892 | | | 186,411 | |
| Right-of-use leased assets | 12,794 | | | 14,021 | |
| Identifiable intangible assets, net | 10,785 | | | 11,690 | |
| Goodwill | 55,195 | | | 70,608 | |
| Deferred income taxes | 14,610 | | | 13,900 | |
| Other assets | 3,139 | | | 2,879 | |
| Total assets | $ | 484,869 | | | $ | 542,093 | |
| Liabilities and Shareholders’ Equity | | | |
| Current liabilities: | | | |
| Accounts payable | $ | 82,290 | | | $ | 114,938 | |
| Accrued expenses | 23,501 | | | 31,603 | |
| Lease liability, short-term | 2,163 | | | 2,035 | |
| Income taxes payable | 579 | | | 1,137 | |
| Total current liabilities | 108,533 | | | 149,713 | |
| Lease liability, long-term | 11,991 | | | 12,738 | |
| Long-term debt | 141,000 | | | 137,000 | |
| Pension and other postretirement benefit obligations, net | 35,747 | | | 35,046 | |
| | | |
| Other non-current liabilities | 4,449 | | | 5,834 | |
| Total liabilities | 301,720 | | | 340,331 | |
| Shareholders’ equity: | | | |
Common stock, no par value (authorized shares 150,000,000, issued and outstanding 34,363,845 shares at June 30, 2023 and 34,000,642 shares at December 31, 2022) | 60,078 | | | 58,824 | |
Common stock held in trust for savings restoration plan (116,336 shares at June 30, 2023 and 113,316 shares at December 31, 2022) | (2,218) | | | (2,188) | |
| Accumulated other comprehensive income (loss): | | | |
| Foreign currency translation adjustment | (83,338) | | | (86,079) | |
| Gain (loss) on derivative financial instruments | (843) | | | (2,480) | |
| Pension and other postretirement benefit adjustments | (54,463) | | | (59,036) | |
| Retained earnings | 263,933 | | | 292,721 | |
| Total shareholders’ equity | 183,149 | | | 201,762 | |
| Total liabilities and shareholders’ equity | $ | 484,869 | | | $ | 542,093 | |
See accompanying notes to the condensed consolidated financial statements.
Tredegar Corporation
Condensed Consolidated Statements of Income (Loss)
(In Thousands, Except Per Share Data)
(Unaudited)
| | | | | | | | | | | | | | | | | | | | | | | |
| Three Months Ended June 30, | | Six Months Ended June 30, |
| | 2023 | | 2022 | | 2023 | | 2022 |
| Revenues and other items: | | | | | | | |
| Sales | $ | 178,167 | | | $ | 274,363 | | | $ | 369,289 | | | $ | 510,929 | |
| Other income (expense), net | (20) | | | 1,342 | | | 260 | | | 1,041 | |
| 178,147 | | | 275,705 | | | 369,549 | | | 511,970 | |
| Costs and expenses: | | | | | | | |
| Cost of goods sold | 153,267 | | | 218,088 | | | 312,792 | | | 401,348 | |
| Freight | 7,199 | | | 11,036 | | | 13,243 | | | 19,118 | |
| Selling, general and administrative | 16,889 | | | 18,862 | | | 35,894 | | | 40,143 | |
| Research and development | 1,376 | | | 1,754 | | | 2,581 | | | 3,278 | |
| Amortization of identifiable intangibles | 464 | | | 666 | | | 968 | | | 1,329 | |
| Pension and postretirement benefits | 3,418 | | | 3,506 | | | 6,837 | | | 6,982 | |
| Interest expense | 2,374 | | | 1,234 | | | 4,686 | | | 2,020 | |
| Asset impairments and costs associated with exit and disposal activities, net of adjustments | — | | | 134 | | | 69 | | | 126 | |
| Goodwill impairment | 15,413 | | | — | | | 15,413 | | | — | |
| Total | 200,400 | | | 255,280 | | | 392,483 | | | 474,344 | |
| Income (loss) before income taxes | (22,253) | | | 20,425 | | | (22,934) | | | 37,626 | |
| Income tax expense (benefit) | (3,331) | | | 5,556 | | | (3,000) | | | 6,334 | |
| Net income (loss) | $ | (18,922) | | | $ | 14,869 | | | $ | (19,934) | | | $ | 31,292 | |
| | | | | | | |
| Earnings (loss) per share: | | | | | | | |
| Basic | $ | (0.56) | | | $ | 0.44 | | | $ | (0.59) | | | $ | 0.93 | |
| Diluted | $ | (0.56) | | | $ | 0.44 | | | $ | (0.59) | | | $ | 0.93 | |
| | | | | | | |
| Shares used to compute earnings (loss) per share: | | | | | | | |
| Basic | 34,079 | | | 33,814 | | | 33,988 | | | 33,734 | |
| Diluted | 34,079 | | | 33,854 | | | 33,988 | | | 33,776 | |
See accompanying notes to the condensed consolidated financial statements.
Tredegar Corporation
Condensed Consolidated Statements of Comprehensive Income (Loss)
(In Thousands)
(Unaudited)
| | | | | | | | | | | |
| Three Months Ended June 30, |
| | 2023 | | 2022 |
| Net income (loss) | $ | (18,922) | | | $ | 14,869 | |
| Other comprehensive income (loss): | | | |
Unrealized foreign currency translation adjustment (net of tax expense of $179 in 2023 and net of tax benefit of $482 in 2022) | 1,621 | | | (5,230) | |
Derivative financial instruments adjustment (net of tax expense of $500 in 2023 and net of tax benefit of $3,359 in 2022) | 368 | | | (9,161) | |
Amortization of prior service costs and net gains or losses (net of tax expense of $637 in 2023 and net of tax expense of $712 in 2022) | 2,286 | | | 2,556 | |
| Other comprehensive income (loss) | 4,275 | | | (11,835) | |
| Comprehensive income (loss) | $ | (14,647) | | | $ | 3,034 | |
| | | | | | | | | | | |
| Six Months Ended June 30, |
| | 2023 | | 2022 |
| Net income (loss) | $ | (19,934) | | | $ | 31,292 | |
| Other comprehensive income (loss): | | | |
Unrealized foreign currency translation adjustment (net of tax expense of $615 in 2023 and net of tax expense of $246 in 2022) | 2,741 | | | 306 | |
Derivative financial instruments adjustment (net of tax expense of $1,336 in 2023 and net of tax benefit of $443 in 2022) | 1,637 | | | (3,231) | |
Amortization of prior service costs and net gains or losses (net of tax expense of $1,274 in 2023 and net of tax expense of $1,424 in 2022) | 4,573 | | | 5,094 | |
| Other comprehensive income (loss) | 8,951 | | | 2,169 | |
| Comprehensive income (loss) | $ | (10,983) | | | $ | 33,461 | |
See accompanying notes to the condensed consolidated financial statements.
Tredegar Corporation
Condensed Consolidated Statements of Cash Flows
(In Thousands)
(Unaudited) | | | | | | | | | | | |
| Six Months Ended June 30, |
| 2023 | | 2022 |
| Cash flows from operating activities: | | | |
| Net income (loss) | $ | (19,934) | | | $ | 31,292 | |
| Adjustments for noncash items: | | | |
| Depreciation | 12,387 | | | 11,536 | |
| Amortization of identifiable intangibles | 968 | | | 1,329 | |
| Reduction of right-of-use lease asset | 1,075 | | | 1,072 | |
| Goodwill impairment | 15,413 | | | — | |
| Deferred income taxes | (3,731) | | | 2,516 | |
| Accrued pension and post-retirement benefits | 6,837 | | | 7,013 | |
| Stock-based compensation expense | 521 | | | 1,842 | |
| Gain on investment in kaléo | (262) | | | (1,406) | |
| Changes in assets and liabilities: | | | |
| Accounts and other receivables | 6,190 | | | (24,172) | |
| Inventories | 43,013 | | | (31,495) | |
| Income taxes recoverable/payable | (1,060) | | | (6,129) | |
| Prepaid expenses and other | 2,976 | | | (516) | |
| Accounts payable and accrued expenses | (39,629) | | | 47,388 | |
| Lease liability | (1,095) | | | (1,166) | |
| Pension and postretirement benefit plan contributions | (279) | | | (50,314) | |
| Other, net | (692) | | | 1,781 | |
| Net cash provided by (used in) operating activities | 22,698 | | | (9,429) | |
| Cash flows from investing activities: | | | |
| Capital expenditures | (15,907) | | | (13,514) | |
| Proceeds from the sale of kaléo | 262 | | | 1,406 | |
| | | |
| Net cash provided by (used in) investing activities | (15,645) | | | (12,108) | |
| Cash flows from financing activities: | | | |
| Borrowings | 41,250 | | | 221,250 | |
| Debt principal payments | (37,250) | | | (192,750) | |
| Dividends paid | (8,884) | | | (8,135) | |
| Debt financing costs | — | | | (1,245) | |
| Other | — | | | (396) | |
| Net cash provided by (used in) financing activities | (4,884) | | | 18,724 | |
| Effect of exchange rate changes on cash | (208) | | | (246) | |
| Increase (decrease) in cash & cash equivalents | 1,961 | | | (3,059) | |
| Cash and cash equivalents at beginning of period | 19,232 | | | 30,521 | |
| Cash and cash equivalents at end of period | $ | 21,193 | | | $ | 27,462 | |
See accompanying notes to the condensed consolidated financial statements.
Tredegar Corporation
Condensed Consolidated Statements of Shareholders’ Equity
(In Thousands, Except Share and Per Share Data)
(Unaudited)
The following summarizes the changes in shareholders’ equity for the three month period ended June 30, 2023:
| | | | | | | | | | | | | | | | | | | | | | | | | | | | | |
| Common Stock | | Retained Earnings | | Trust for Savings Restoration Plan | | Accumulated Other Comprehensive Income (Loss) | | Total Shareholders’ Equity |
Balance April 1, 2023 | $ | 59,423 | | | $ | 287,308 | | | $ | (2,203) | | | $ | (142,919) | | | $ | 201,609 | |
| Net income (loss) | — | | | (18,922) | | | — | | | — | | | (18,922) | |
| Foreign currency translation adjustment | — | | | — | | | — | | | 1,621 | | | 1,621 | |
| Derivative financial instruments adjustment | — | | | — | | | — | | | 368 | | | 368 | |
| Amortization of prior service costs and net gains or losses | — | | | — | | | — | | | 2,286 | | | 2,286 | |
Cash dividends declared ($0.13 per share) | — | | | (4,468) | | | — | | | — | | | (4,468) | |
| Stock-based compensation expense | 655 | | | — | | | — | | | — | | | 655 | |
| | | | | | | | | |
| Tredegar common stock purchased by trust for savings restoration plan | — | | | 15 | | | (15) | | | — | | | — | |
Balance June 30, 2023 | $ | 60,078 | | | $ | 263,933 | | | $ | (2,218) | | | $ | (138,644) | | | $ | 183,149 | |
The following summarizes the changes in shareholders’ equity for the six month period ended June 30, 2023:
| | | | | | | | | | | | | | | | | | | | | | | | | | | | | |
| Common Stock | | Retained Earnings | | Trust for Savings Restoration Plan | | Accumulated Other Comprehensive Income (Loss) | | Total Shareholders’ Equity |
Balance January 1, 2023 | $ | 58,824 | | | $ | 292,721 | | | $ | (2,188) | | | $ | (147,595) | | | $ | 201,762 | |
| Net income (loss) | — | | | (19,934) | | | — | | | — | | | (19,934) | |
| Foreign currency translation adjustment | — | | | — | | | — | | | 2,741 | | | 2,741 | |
| Derivative financial instruments adjustment | — | | | — | | | — | | | 1,637 | | | 1,637 | |
| Amortization of prior service costs and net gains or losses | — | | | — | | | — | | | 4,573 | | | 4,573 | |
Cash dividends declared ($0.26 per share) | — | | | (8,884) | | | — | | | — | | | (8,884) | |
| Stock-based compensation expense | 1,508 | | | — | | | — | | | — | | | 1,508 | |
Repurchase of employee common stock for tax
withholdings | (254) | | | — | | | — | | | — | | | (254) | |
| Tredegar common stock purchased by trust for savings restoration plan | — | | | 30 | | | (30) | | | — | | | — | |
Balance June 30, 2023 | $ | 60,078 | | | $ | 263,933 | | | $ | (2,218) | | | $ | (138,644) | | | $ | 183,149 | |
The following summarizes the changes in shareholders’ equity for the three month period ended June 30, 2022:
| | | | | | | | | | | | | | | | | | | | | | | | | | | | | |
| | Common
Stock | | Retained
Earnings | | Trust for
Savings
Restoration
Plan | | Accumulated Other
Comprehensive Income (Loss) | | Total
Shareholders’
Equity |
| Balance at April 1, 2022 | $ | 55,953 | | | $ | 293,563 | | | $ | (2,148) | | | $ | (135,500) | | | $ | 211,868 | |
| Net income (loss) | — | | | 14,869 | | | — | | | — | | | 14,869 | |
| Foreign currency translation adjustment | — | | | — | | | — | | | (5,230) | | | (5,230) | |
| Derivative financial instruments adjustment | — | | | — | | | — | | | (9,161) | | | (9,161) | |
| Amortization of prior service costs and net gains or losses | — | | | — | | | — | | | 2,556 | | | 2,556 | |
Cash dividends declared ($0.12 per share) | — | | | (4,075) | | | — | | | — | | | (4,075) | |
| Stock-based compensation expense | 958 | | | — | | | — | | | — | | | 958 | |
| Tredegar common stock purchased by trust for savings restoration plan | — | | | 13 | | | (13) | | | — | | | — | |
| Balance at June 30, 2022 | $ | 56,911 | | | $ | 304,370 | | | $ | (2,161) | | | $ | (147,335) | | | $ | 211,785 | |
The following summarizes the changes in shareholders’ equity for the six month period ended June 30, 2022: | | | | | | | | | | | | | | | | | | | | | | | | | | | | | |
| | Common
Stock | | Retained
Earnings | | Trust for
Savings
Restoration
Plan | | Accumulated Other
Comprehensive Income (Loss) | | Total
Shareholders’
Equity |
| Balance at January 1, 2022 | $ | 55,174 | | | $ | 281,187 | | | $ | (2,135) | | | $ | (149,504) | | | $ | 184,722 | |
| Net income (loss) | — | | | 31,292 | | | — | | | — | | | 31,292 | |
| Foreign currency translation adjustment | — | | | — | | | — | | | 306 | | | 306 | |
| Derivative financial instruments adjustment | — | | | — | | | — | | | (3,231) | | | (3,231) | |
| Amortization of prior service costs and net gains or losses | — | | | — | | | — | | | 5,094 | | | 5,094 | |
Cash dividends declared ($0.24 per share) | — | | | (8,135) | | | — | | | — | | | (8,135) | |
| Stock-based compensation expense | 2,133 | | | — | | | — | | | — | | | 2,133 | |
Repurchase of employee common stock for tax
withholdings | (396) | | | — | | | — | | | — | | | (396) | |
| Tredegar common stock purchased by trust for savings restoration plan | — | | | 26 | | | (26) | | | — | | | — | |
| Balance at June 30, 2022 | $ | 56,911 | | | $ | 304,370 | | | $ | (2,161) | | | $ | (147,335) | | | $ | 211,785 | |
See accompanying notes to the condensed consolidated financial statements.
TREDEGAR CORPORATION
NOTES TO THE CONDENSED CONSOLIDATED FINANCIAL STATEMENTS
(Unaudited)
1. BASIS OF PRESENTATION
In the opinion of management, the accompanying condensed consolidated financial statements of Tredegar Corporation and its subsidiaries (“Tredegar,” “the Company,” “we,” “us” or “our”) contain all adjustments necessary to state fairly, in all material respects, Tredegar’s condensed consolidated financial position as of June 30, 2023, the condensed consolidated results of operations for the three and six months ended June 30, 2023 and 2022, the condensed consolidated cash flows for the six months ended June 30, 2023 and 2022, and the condensed consolidated changes in shareholders’ equity for the six months ended June 30, 2023 and 2022, in accordance with U.S. generally accepted accounting principles (“GAAP”). All such adjustments, unless otherwise detailed in the notes to the condensed consolidated financial statements, are deemed to be of a normal, recurring nature.
The Company operates on a calendar fiscal year except for the Aluminum Extrusions segment, which operates on a 52/53-week fiscal year basis. As such, the fiscal second quarter for 2023 and 2022 for this segment references 13-week periods ended June 25, 2023 and June 26, 2022, respectively. The Company does not believe the impact of reporting the results of this segment as stated above is material to the consolidated financial results. The Company may fund or receive cash from the Aluminum Extrusions segment based on Aluminum Extrusion’s cash flows from operations during the intervening period from Aluminum Extrusion’s fiscal quarter end and the Company’s fiscal quarter end. There was no intercompany funding with Aluminum Extrusions between June 25, 2023 and June 30, 2023.
The condensed consolidated financial statements as of December 31, 2022 that is included herein was derived from the audited consolidated financial statements provided in the Company’s Annual Report on Form 10-K for the year ended December 31, 2022 (“2022 Form 10-K”) but does not include all disclosures required by GAAP. These financial statements should be read in conjunction with the audited consolidated financial statements and related notes included in the 2022 Form 10-K.
The results of operations for the three and six months ended June 30, 2023, are not necessarily indicative of the results to be expected for the full year.
Impairment of Goodwill
The Company assesses goodwill for impairment when events or circumstances indicate that the carrying value may not be recoverable, or, at a minimum, on an annual basis (December 1st of each year). As of June 30, 2023, the Company’s reporting units with goodwill were Surface Protection in PE Films ("Surface Protection") and Futura in Aluminum Extrusions (“Futura”). No events or circumstances were identified during the second quarter of 2023 that indicate that Futura’s fair value is more likely than not less than its carrying amount.
However, manufacturers in the supply chain for consumer electronics continue to experience reduced capacity utilization and inventory corrections. In light of the continued uncertainty about the timing of a recovery for this market and the expected adverse future impact to the Surface Protection business, the Company performed a Step 1 goodwill impairment analysis of the Surface Protection component of PE Films using projections that contemplate the expected market recovery and business conditions, as these events indicated Surface Protection’s fair value is more likely than not less than its carrying amount.
The Company estimated the fair value of Surface Protection at June 30, 2023 by: (i) computing an estimated enterprise value (“EV”) utilizing the discounted cash flow method (the “DCF Method”), (ii) applying adjustments for any surplus or deficient working capital, (iii) adding cash and cash equivalents, and (iv) subtracting interest-bearing debt. The DCF Method was used since Surface Protection’s projections reflect the expected recovery from the weak market demand, competitive pricing and cash flows associated with new surface protection products, applications, customers, production efficiencies, and cost savings.
The analysis concluded that the fair value of Surface Protection was less than its carrying value, thus a non-cash partial goodwill impairment of $15.4 million ($11.9 million after deferred income tax benefits) was recognized during the second quarter of 2023.
Given the uncertain demand for Surface Protections products, it is reasonably possible that the cash flow estimates used in deriving such fair value measurements may change in the future. The Surface Protection reporting unit had goodwill of $41.9 million and $57.3 million as of June 30, 2023 and December 31, 2022, respectively.
Accounting Standards Adopted
No Accounting Standard Updates issued by the Financial Accounting Standards Board were adopted during the second quarter of 2023.
2. ACCOUNTS AND OTHER RECEIVABLES
As of June 30, 2023 and December 31, 2022, accounts receivable and other receivables, net include the following: | | | | | | | | | | | |
| (In thousands) | June 30, 2023 | | December 31, 2022 |
| Customer receivables | $ | 79,112 | | | $ | 83,667 | |
| Other receivables | 2,233 | | | 3,874 | |
| Total accounts and other receivables | 81,345 | | | 87,541 | |
| Less: Allowance for bad debts | (2,206) | | | (2,997) | |
| Total accounts and other receivables, net | $ | 79,139 | | | $ | 84,544 | |
3. INVENTORIES
The components of inventories are as follows: | | | | | | | | | | | |
| (In thousands) | June 30, 2023 | | December 31, 2022 |
| Finished goods | $ | 29,677 | | | $ | 34,686 | |
| Work-in-process | 12,678 | | | 15,604 | |
| Raw materials | 23,897 | | | 58,262 | |
| Stores, supplies and other | 20,440 | | | 19,219 | |
| Total | $ | 86,692 | | | $ | 127,771 | |
4. PENSION AND OTHER POSTRETIREMENT BENEFITS
Tredegar sponsors a noncontributory defined benefit (pension) plan covering certain current and former U.S. employees. As of January 31, 2018, the plan no longer accrued benefits associated with crediting employees for service, thereby freezing all future benefits under the plan. On February 10, 2022, Tredegar announced the initiation of a process to terminate and settle its frozen defined benefit pension plan. In connection therewith, on February 9, 2022, the Company contributed $50 million to the pension plan (the “Special Contribution”). The Company estimates that, with the Special Contribution, there will be no required minimum contributions to the pension plan until final settlement.
Tredegar also has a non-qualified supplemental pension plan covering certain employees. Effective December 31, 2005, further participation in this plan was terminated and benefit accruals for existing participants were frozen. Pension expense recognized for this plan was immaterial in the three and six months ended June 30, 2023 and 2022. This information has been included in the pension benefit table below.
The components of net periodic benefit cost for the pension and other postretirement benefit programs reflected in the condensed consolidated statements of income for the three and six months ended June 30, 2023 and 2022, are shown below: | | | | | | | | | | | | | | | | | | | | | | | |
| Pension Benefits | | Other Post-Retirement Benefits |
| | Three Months Ended June 30, | | Three Months Ended June 30, |
| (In thousands) | 2023 | | 2022 | | 2023 | | 2022 |
| Service cost | $ | — | | | $ | — | | | $ | 3 | | | $ | 5 | |
| Interest cost | 3,028 | | | 2,225 | | | 71 | | | 51 | |
| Expected return on plan assets | (2,607) | | | (2,043) | | | — | | | — | |
| Amortization of prior service costs, (gains) losses and net transition asset | 2,982 | | | 3,302 | | | (59) | | | (34) | |
| Net periodic benefit cost | $ | 3,403 | | | $ | 3,484 | | | $ | 15 | | | $ | 22 | |
| | | | | | | |
| Pension Benefits | | Other Post-Retirement Benefits |
| | Six Months Ended June 30, | | Six Months Ended June 30, |
| (In thousands) | 2023 | | 2022 | | 2023 | | 2022 |
| Service cost | $ | — | | | $ | — | | | $ | 6 | | | $ | 10 | |
| Interest cost | 6,056 | | | 4,450 | | | 142 | | | 102 | |
| Expected return on plan assets | (5,214) | | | (4,098) | | | — | | | — | |
| Amortization of prior service costs, (gains) losses and net transition asset | 5,965 | | | 6,586 | | | (118) | | | (68) | |
| Net periodic benefit cost | $ | 6,807 | | | $ | 6,938 | | | $ | 30 | | | $ | 44 | |
Pension and other postretirement liabilities were $36.4 million and $35.7 million at June 30, 2023 and December 31, 2022, respectively ($0.7 million included in “Accrued expenses” at June 30, 2023 and December 31, 2022, respectively, with the remainder included in “Pension and other postretirement benefit obligations, net” in the condensed consolidated balance sheets).
Tredegar funds its other postretirement benefits on a claims-made basis; for 2023, the Company anticipates the amount will be consistent with amounts paid for the year ended December 31, 2022, or approximately $0.5 million.
5. OTHER INCOME (EXPENSE), NET
Other income (expense), net consists of the following: | | | | | | | | | | | | | | | | | | | | | | | |
| Three Months Ended June 30, | | Six Months Ended June 30, |
| (In thousands) | 2023 | | 2022 | | 2023 | | 2022 |
Gain on investment in kaléo(a) | $ | — | | | $ | 1,406 | | | $ | 262 | | | $ | 1,406 | |
COVID-19-related expenses, net of relief (b) | — | | | (96) | | | — | | | (308) | |
| | | | | | | |
| | | | | | | |
| | | | | | | |
| | | | | | | |
| Other | (20) | | | 32 | | | (2) | | | (57) | |
| Total | $ | (20) | | | $ | 1,342 | | | $ | 260 | | | $ | 1,041 | |
(a) In January 2023, additional cash consideration of $0.3 million was received related to the customary post-closing adjustments on the sale of the investment in kaleo, Inc ("kaléo"), which was sold in December 2021. (b) Costs associated with operating under COVID-19 conditions include employee overtime expenses associated with absenteeism, personal protective equipment supplies and facility maintenance. |
6. EARNINGS PER SHARE
Basic earnings per share is computed by dividing net income (loss) by the weighted average number of shares of common stock outstanding. Diluted earnings per share is computed by dividing net income (loss) by the weighted average common and potentially dilutive common equivalent shares outstanding, determined as follows: | | | | | | | | | | | | | | | | | | | | | | | |
| Three Months Ended | | Six Months Ended |
| | June 30, | | June 30, |
| (In thousands) | 2023 | | 2022 | | 2023 | | 2022 |
| Weighted average shares outstanding used to compute basic earnings per share | 34,079 | | | 33,814 | | | 33,988 | | | 33,734 | |
| Incremental dilutive shares attributable to stock options and restricted stock | — | | | 40 | | | — | | | 42 | |
| Shares used to compute diluted earnings per share | 34,079 | | | 33,854 | | | 33,988 | | | 33,776 | |
Incremental shares attributable to stock options and restricted stock are computed under the treasury stock method using the average market price during the related period. The Company had a net loss for the three and six months ended June 30, 2023, so there is no dilutive impact for such shares. If the Company had reported net income for the three and six months ended June 30, 2023, average out-of-the-money options to purchase shares that were excluded from the calculation of incremental shares attributable to stock options and restricted stock would have been 3,019,333 and 2,830,849, respectively. The average out-of-the-money options to purchase shares that were excluded from the calculation of incremental shares attributable to stock options and restricted stock were 2,525,104 and 2,501,406 for the three and six months ended June 30, 2022, respectively.
7. ACCUMULATED OTHER COMPREHENSIVE INCOME (LOSS)
The changes in accumulated other comprehensive income (loss) by component for the three months ended June 30, 2023.
| | | | | | | | | | | | | | | | | | | | | | | |
| (In thousands) | Foreign Currency Translation | | Gain (Loss) on Derivative Financial Instruments | | Pension & Other Postretirement Benefit Adjust | | Total Accumulated Other Comprehensive Income (Loss) |
| Balance at April 1, 2023 | $ | (84,959) | | | $ | (1,211) | | | $ | (56,749) | | | $ | (142,919) | |
| Other comprehensive income (loss) | 1,800 | | | 2,488 | | | — | | | 4,288 | |
| Income tax (expense) benefit | (179) | | | (945) | | | — | | | (1,124) | |
| Other comprehensive income (loss), net of tax | 1,621 | | | 1,543 | | | — | | | 3,164 | |
| Reclassification adjustment to net income (loss) | — | | | (1,621) | | | 2,923 | | | 1,302 | |
| Income tax (expense) benefit | — | | | 446 | | | (637) | | | (191) | |
| Reclassification adjustment to net income (loss), net of tax | — | | | (1,175) | | | 2,286 | | | 1,111 | |
| Other comprehensive income (loss), net of tax | 1,621 | | | 368 | | | 2,286 | | | 4,275 | |
Balance at June 30, 2023 | $ | (83,338) | | | $ | (843) | | | $ | (54,463) | | | $ | (138,644) | |
The changes in accumulated other comprehensive income (loss) by component for the six months ended June 30, 2023.
| | | | | | | | | | | | | | | | | | | | | | | |
| (In thousands) | Foreign Currency Translation | | Gain (Loss) on Derivative Financial Instruments | | Pension & Other Postretirement Benefit Adjust | | Total Accumulated Other Comprehensive Income (Loss) |
| Balance at January 1, 2023 | $ | (86,079) | | | $ | (2,480) | | | $ | (59,036) | | | $ | (147,595) | |
| Other comprehensive income (loss) | 3,356 | | | 5,565 | | | — | | | 8,921 | |
| Income tax (expense) benefit | (615) | | | (2,031) | | | — | | | (2,646) | |
| Other comprehensive income (loss), net of tax | 2,741 | | | 3,534 | | | — | | | 6,275 | |
| Reclassification adjustment to net income (loss) | — | | | (2,594) | | | 5,847 | | | 3,253 | |
| Income tax (expense) benefit | — | | | 697 | | | (1,274) | | | (577) | |
| Reclassification adjustment to net income (loss), net of tax | — | | | (1,897) | | | 4,573 | | | 2,676 | |
| Other comprehensive income (loss), net of tax | 2,741 | | | 1,637 | | | 4,573 | | | 8,951 | |
Balance at June 30, 2023 | $ | (83,338) | | | $ | (843) | | | $ | (54,463) | | | $ | (138,644) | |
The changes in accumulated other comprehensive income (loss) by component for the three months ended June 30, 2022.
| | | | | | | | | | | | | | | | | | | | | | | |
| (In thousands) | Foreign Currency Translation | | Gain (Loss) on Derivative Financial Instruments | | Pension & Other Postretirement Benefit Adjust | | Total Accumulated Other Comprehensive Income (Loss) |
| Balance at April 1, 2022 | $ | (80,256) | | | $ | 6,831 | | | $ | (62,075) | | | $ | (135,500) | |
| Other comprehensive income (loss) | (5,712) | | | (11,681) | | | — | | | (17,393) | |
| Income tax (expense) benefit | 482 | | | 3,110 | | | — | | | 3,592 | |
| Other comprehensive income (loss), net of tax | (5,230) | | | (8,571) | | | — | | | (13,801) | |
| Reclassification adjustment to net income (loss) | — | | | (840) | | | 3,268 | | | 2,428 | |
| Income tax (expense) benefit | — | | | 250 | | | (712) | | | (462) | |
| Reclassification adjustment to net income (loss), net of tax | — | | | (590) | | | 2,556 | | | 1,966 | |
| Other comprehensive income (loss), net of tax | (5,230) | | | (9,161) | | | 2,556 | | | (11,835) | |
Balance at June 30, 2022 | $ | (85,486) | | | $ | (2,330) | | | $ | (59,519) | | | $ | (147,335) | |
The changes in accumulated other comprehensive income (loss) by component for the six months ended June 30, 2022.
| | | | | | | | | | | | | | | | | | | | | | | |
| (In thousands) | Foreign Currency Translation | | Gain (Loss) on Derivative Financial Instruments | | Pension & Other Postretirement Benefit Adjust | | Total Accumulated Other Comprehensive Income (Loss) |
| Balance at January 1, 2022 | $ | (85,792) | | | $ | 901 | | | $ | (64,613) | | | $ | (149,504) | |
| Other comprehensive income (loss) | 552 | | | (1,678) | | | — | | | (1,126) | |
| Income tax (expense) benefit | (246) | | | (80) | | | — | | | (326) | |
| Other comprehensive income (loss), net of tax | 306 | | | (1,758) | | | — | | | (1,452) | |
| Reclassification adjustment to net income (loss) | — | | | (1,997) | | | 6,518 | | | 4,521 | |
| Income tax (expense) benefit | — | | | 524 | | | (1,424) | | | (900) | |
| Reclassification adjustment to net income (loss), net of tax | — | | | (1,473) | | | 5,094 | | | 3,621 | |
| Other comprehensive income (loss), net of tax | 306 | | | (3,231) | | | 5,094 | | | 2,169 | |
Balance at June 30, 2022 | $ | (85,486) | | | $ | (2,330) | | | $ | (59,519) | | | $ | (147,335) | |
The amounts reclassified out of accumulated other comprehensive income (loss) related to pension and other postretirement benefits is included in the computation of net periodic pension costs. See Note 4 for additional details.
8. DERIVATIVES
Tredegar uses derivative financial instruments for the purpose of hedging margin exposure from fixed-price forward sales contracts in Aluminum Extrusions and exposure from currency volatility that exists as part of ongoing business operations in Flexible Packaging Films. These derivative financial instruments are designated as and qualify as cash flow hedges and are recognized in the condensed consolidated balance sheet at fair value. If individual derivative instruments with the same counterparty can be settled on a net basis, the Company records the corresponding derivative fair values as a net asset or net liability.
In the normal course of business, Aluminum Extrusions enters into fixed-price forward sales contracts with certain customers for the future sale of fixed quantities of aluminum extrusions at scheduled intervals. In order to hedge margin exposure created from the fixing of future sales prices relative to volatile raw material (aluminum) costs, Aluminum Extrusions enters into a combination of forward purchase commitments and futures contracts to acquire or hedge aluminum, based on the scheduled purchases for the firm sales commitments. The fixed-price firm sales commitments and related hedging instruments have durations generally no longer than 12 months. The notional amount of aluminum futures contracts that hedged future purchases of aluminum to meet fixed-price forward sales contract obligations was $17.0 million (11.1 million pounds of aluminum) at June 30, 2023 and $30.7 million (20.3 million pounds of aluminum) at December 31, 2022.
The table below summarizes the location and gross amounts of aluminum futures contract fair values (Level 2) in the condensed consolidated balance sheets as of June 30, 2023 and December 31, 2022: | | | | | | | | | | | | | | | | | | | | | | | |
| | June 30, 2023 | | December 31, 2022 |
| (In thousands) | Balance Sheet
Account | | Fair
Value | | Balance Sheet
Account | | Fair
Value |
| Derivatives Designated as Hedging Instruments | | | | | | | |
Asset derivatives: Aluminum futures contracts | Prepaid expenses and other | | $ | — | | | Prepaid expenses and other | | $ | 48 | |
| | | | | | | |
Liability derivatives: Aluminum futures contracts | Accrued expenses | | (3,050) | | | Accrued expenses | | (3,260) | |
| Aluminum futures contracts | Other non-current liabilities | | (255) | | | Other non-current liabilities | | (369) | |
| Net asset (liability) | | | $ | (3,305) | | | | | $ | (3,581) | |
In the event that a counterparty to an aluminum fixed-price forward sales contract chooses not to take delivery of its aluminum extrusions, the customer is contractually obligated to compensate Aluminum Extrusions for any losses on the related aluminum futures and/or forward contracts through the date of cancellation.
The Company's earnings are exposed to foreign currency exchange risk primarily through the translation of the financial statements of subsidiaries that have a functional currency other than the U.S. Dollar. The Company estimates that the net mismatch translation exposure for the Flexible Packaging Film's business unit in Brazil (“Terphane Ltda.”) of its sales and raw materials quoted or priced in U.S. Dollars and its variable conversion, fixed conversion and sales, general and administrative costs (before depreciation and amortization) quoted or priced in Brazilian Real ("R$") will result in an annual net cost of R$177 million for the full year of 2023.
Terphane Ltda. had the following outstanding foreign exchange average forward rate contracts to purchase Brazilian Real and sell U.S. Dollars as of June 30, 2023: | | | | | | | | | | | | | | |
| USD Notional Amount (000s) | Average Forward Rate Contracted on USD/BRL | R$ Equivalent Amount (000s) | Applicable Month | Estimated % of Terphane Ltda. R$ Operating Cost Exposure Hedged |
| | | | |
| | | | |
| | | | |
| $2,154 | 5.6378 | R$12,144 | Jul-23 | 83% |
| $2,020 | 5.6831 | R$11,480 | Aug-23 | 78% |
| $2,071 | 5.7174 | R$11,841 | Sep-23 | 80% |
| $2,013 | 5.7556 | R$11,586 | Oct-23 | 79% |
| $2,018 | 5.7836 | R$11,671 | Nov-23 | 79% |
| $1,786 | 5.8312 | R$10,414 | Dec-23 | 71% |
| $659 | 5.7360 | R$3,780 | Jan-24 | 23% |
| $659 | 5.7562 | R$3,793 | Feb-24 | 23% |
| $659 | 5.7774 | R$3,807 | Mar-24 | 23% |
| $659 | 5.8000 | R$3,822 | Apr-24 | 23% |
| $659 | 5.8207 | R$3,836 | May-24 | 24% |
| $659 | 5.8419 | R$3,850 | Jun-24 | 24% |
| $659 | 5.8636 | R$3,864 | Jul-24 | 24% |
| $659 | 5.8872 | R$3,880 | Aug-24 | 24% |
| $659 | 5.9118 | R$3,896 | Sep-24 | 24% |
| $659 | 5.9350 | R$3,911 | Oct-24 | 24% |
| $659 | 5.9581 | R$3,926 | Nov-24 | 24% |
| $659 | 5.9813 | R$3,942 | Dec-24 | 24% |
| $19,970 | 5.7808 | R$115,443 | | 40% |
These foreign currency exchange contracts have been designated and qualify as cash flow hedges of Terphane Ltda.’s forecasted sales to customers quoted or priced in U.S. Dollars over that period. By changing the currency risk associated with these U.S. Dollar sales, the derivatives have the effect of offsetting operating costs quoted or priced in Brazilian Real and decreasing the net exposure to Brazilian Real in the condensed consolidated statements of income.
The table below summarizes the location and gross amounts of foreign currency forward contract fair values (Level 2) in the condensed consolidated balance sheets as of June 30, 2023 and December 31, 2022: | | | | | | | | | | | | | | | | | | | | | | | | |
| | June 30, 2023 | | December 31, 2022 |
| (In thousands) | Balance Sheet
Account | | Fair
Value | | Balance Sheet
Account | | | Fair
Value |
| Derivatives Designated as Hedging Instruments | | | | | | | | |
Asset derivatives: Foreign currency forward contracts | Prepaid expenses and other | | $ | 2,974 | | | Prepaid expenses and other | | | $ | 781 | |
| Foreign currency forward contracts | Other assets | | 723 | | | Other assets | | | 33 | |
Liability derivatives: Foreign currency forward contracts | Accrued expenses | | — | | | Other non-current liabilities | | | (3) | |
| Net asset (liability) | | | $ | 3,697 | | | | | | $ | 811 | |
These derivative contracts involve elements of market risk that are not reflected on the condensed consolidated balance sheet, including the risk of dealing with counterparties and their ability to meet the terms of the contracts. The counterparties to any forward purchase commitments are major aluminum brokers and suppliers, and the counterparties to any aluminum futures contracts are major financial institutions. Fixed-price forward sales contracts are only made available to the best and most credit-worthy customers. The counterparties to the Company’s foreign currency cash flow hedge contracts are major financial institutions.
The pre-tax effect on net income (loss) and other comprehensive income (loss) of derivative instruments classified as cash flow hedges and described in the previous paragraphs for the three and six month periods ended June 30, 2023 and 2022 is summarized in the table below: | | | | | | | | | | | | | | | | | | | | | | | | | | | | | | | | |
| Cash Flow Derivative Hedges |
| | Three Months Ended June 30, |
| | Aluminum Futures Contracts | | Foreign Currency Forwards |
| (In thousands) | 2023 | | 2022 | | 2023 | | 2022 |
| Amount of pre-tax gain (loss) recognized in other comprehensive income (loss) | $ | 557 | | | $ | (9,923) | | | $ | — | | $ | 1,931 | | | $ | — | | | $ | (1,758) | |
| Location of gain (loss) reclassified from accumulated other comprehensive income (loss) into net income (effective portion) | Cost of goods sold | | Cost of goods sold | | Cost of goods sold | Selling, general & admin | | Cost of goods sold | | Selling, general & admin |
| Amount of pre-tax gain (loss) reclassified from accumulated other comprehensive income (loss) to net income (effective portion) | $ | 885 | | | $ | 293 | | | $ | 15 | | $ | 721 | | | $ | 15 | | | $ | 532 | |
| | Six Months Ended June 30, |
| | Aluminum Futures Contracts | | Foreign Currency Forwards |
| | 2023 | | 2022 | | 2023 | | 2022 |
| Amount of pre-tax gain (loss) recognized in other comprehensive income (loss) | $ | 1,959 | | | $ | (3,741) | | | $ | — | | $ | 3,606 | | | $ | — | | | $ | 2,063 | |
| Location of gain (loss) reclassified from accumulated other comprehensive income (loss) into net income (effective portion) | Cost of goods sold | | Cost of goods sold | | Cost of goods sold | Selling, general & admin | | Cost of goods sold | | Selling, general & admin |
| Amount of pre-tax gain (loss) reclassified from accumulated other comprehensive income (loss) to net income (effective portion) | $ | 1,557 | | | $ | 1,298 | | | $ | 30 | | $ | 1,007 | | | $ | 30 | | | $ | 669 | |
As of June 30, 2023, the Company expects $1.8 million of unrealized after-tax losses on aluminum and foreign currency derivative instruments reported in accumulated other comprehensive income (loss) to be reclassified to earnings within the next 12 months. For the three and six month periods ended June 30, 2023 and 2022, net gains or losses realized, from previously unrealized net gains or losses on hedges that had been discontinued, were not material.
9. INCOME TAXES
Tredegar recorded tax benefit of $3.0 million on pre-tax loss of $22.9 million in the first six months of 2023. Therefore, the effective tax rate in the first six months of 2023 was 13.1%, compared to 16.9% in the first six months of 2022. The change in the effective tax rate is primarily due to a pre-tax loss in first six months of 2023 versus pre-tax income in first six months of 2022, lower Brazil tax incentives, a discrete charge in the second quarter of 2023 for a Brazil tax law change and a large discrete benefit recorded in the first quarter of 2022, resulting from the implementation of new U.S. tax regulations associated with foreign tax credits published by the U.S. Treasury and Internal Revenue Service on January 4, 2022. These regulations overhauled various components of the foreign tax credit regime including the determination of creditable foreign taxes and limit the amount of foreign taxes that are creditable against U.S. income taxes. As the result of these regulations, future Brazilian income tax under Brazil tax law in place at that time would have been deductible, but not creditable, in the U.S. The accounting rules require a reduction of the U.S. deferred tax liability previously established related to anticipated future income from Brazil. The tax effect of the reduction of the U.S. deferred tax liability resulted in the discrete tax benefit described above. In the second quarter of 2023, Brazil enacted new tax legislation which will likely cause the Brazil income tax to once again be creditable after 2023. This law change caused a partial reversal of the discrete tax benefit recognized in the first quarter of 2022 described above, which increased the deferred tax liability related to anticipated future income from Brazil. Total deferred tax assets increased during the second quarter of 2023 compared to December 31, 2022 primarily due to changes in other comprehensive income, increase in net operational loss and decrease in deferred tax liability related to the goodwill impairment that took place in second quarter of 2023.
Tredegar accrues U.S. federal income taxes on unremitted earnings of foreign subsidiaries where required. However, due to changes in the taxation of dividends under the U.S. Tax Cuts and Jobs Act of 2017, Tredegar will only record U.S. federal income taxes on unremitted earnings of its foreign subsidiaries where Tredegar cannot take steps to eliminate any potential tax on future distributions from its foreign subsidiaries.
The Brazilian federal statutory income tax rate is a composite of 34.0% (25.0% of income tax and 9.0% of social contribution on income). Terphane Ltda.’s manufacturing facility in Brazil is the beneficiary of certain income tax incentives that allow for a reduction in the statutory Brazilian federal income tax rate to 15.25% levied on the operating profit on certain of its products. The incentives have been granted for a 10-year period, from the commencement date of January 1, 2015 and expiring at the end of 2024. The benefit from the tax incentives was $0.4 million and $2.6 million in the first six months of 2023 and 2022, respectively.
Tredegar and its subsidiaries file income tax returns in the U.S., various states, and jurisdictions outside the U.S. With exceptions for some U.S. states and non-U.S. jurisdictions, Tredegar and its subsidiaries as of June 30, 2023 are no longer subject to U.S. federal, state or non-U.S. income tax examinations by tax authorities for years before 2018.
10. BUSINESS SEGMENTS
The Company’s business segments are Aluminum Extrusions, PE Films, and Flexible Packaging Films. Information by business segment is reported below. There are no accounting transactions between segments and no allocations to segments.
The Company’s reportable segments are based on its method of internal reporting, which is generally segregated by differences in products. Accounting standards for presentation of segments require an approach based on the way the Company organizes the segments for making operating decisions and how the chief operating decision maker (“CODM”) assesses performance. EBITDA from ongoing operations is the key profitability measure used by the CODM (Tredegar’s President and Chief Executive Officer) for purposes of assessing financial performance. The Company uses sales less freight (“net sales”) as its measure of revenues from external customers at the segment level. This measure is separately included in the financial information regularly provided to the CODM.
The following table presents net sales and EBITDA from ongoing operations by segment for the three and six months ended June 30, 2023 and 2022:
| | | | | | | | | | | | | | | | | | | | | | | |
| Three Months Ended June 30, | | Six Months Ended June 30, |
| (In thousands) | 2023 | | 2022 | | 2023 | | 2022 |
| Net Sales | | | | | | | |
| Aluminum Extrusions | $ | 121,827 | | | $ | 190,308 | | | $ | 255,197 | | | $ | 348,417 | |
| PE Films | 15,918 | | | 31,424 | | | 36,099 | | | 62,555 | |
| Flexible Packaging Films | 33,223 | | | 41,595 | | | 64,750 | | | 80,839 | |
| Total net sales | 170,968 | | | 263,327 | | | 356,046 | | | 491,811 | |
| Add back freight | 7,199 | | | 11,036 | | | 13,243 | | | 19,118 | |
| Sales as shown in the condensed consolidated statements of income (loss) | $ | 178,167 | | | $ | 274,363 | | | $ | 369,289 | | | $ | 510,929 | |
| EBITDA from Ongoing Operations | | | | | | | |
| Aluminum Extrusions: | | | | | | | |
| Ongoing operations: | | | | | | | |
| EBITDA | $ | 10,217 | | | $ | 21,895 | | | $ | 24,855 | | | $ | 45,814 | |
| Depreciation & amortization | (4,158) | | | (4,169) | | | (8,569) | | | (8,430) | |
| EBIT | 6,059 | | | 17,726 | | | 16,286 | | | 37,384 | |
| Plant shutdowns, asset impairments, restructurings and other | 155 | | | 16 | | | (339) | | | (89) | |
| PE Films: | | | | | | | |
| Ongoing operations: | | | | | | | |
| EBITDA | 814 | | | 7,065 | | | 2,663 | | | 14,112 | |
| Depreciation & amortization | (1,552) | | | (1,559) | | | (3,195) | | | (3,154) | |
| EBIT | (738) | | | 5,506 | | | (532) | | | 10,958 | |
| Plant shutdowns, asset impairments, restructurings and other | — | | | (50) | | | 2 | | | (153) | |
| Goodwill impairment | (15,413) | | | — | | | (15,413) | | | — | |
| Flexible Packaging Films: | | | | | | | |
| Ongoing operations: | | | | | | | |
| EBITDA | 249 | | | 7,631 | | | 1,599 | | | 12,665 | |
| Depreciation & amortization | (711) | | | (583) | | | (1,411) | | | (1,132) | |
| EBIT | (462) | | | 7,048 | | | 188 | | | 11,533 | |
| Plant shutdowns, asset impairments, restructurings and other | (1) | | | (37) | | | (79) | | | (80) | |
| Total | (10,400) | | | 30,209 | | | 113 | | | 59,553 | |
| Interest income | 30 | | | 3 | | | 74 | | | 32 | |
| Interest expense | 2,374 | | | 1,234 | | | 4,686 | | | 2,020 | |
| Gain on investment in kaléo | — | | | 1,406 | | | 262 | | | 1,406 | |
| Stock option-based compensation costs | — | | | 251 | | | 231 | | | 882 | |
| Corporate expenses, net | 9,509 | | | 9,708 | | | 18,466 | | | 20,463 | |
| Income (loss) before income taxes | (22,253) | | | 20,425 | | | (22,934) | | | 37,626 | |
| Income tax expense (benefit) | (3,331) | | | 5,556 | | | (3,000) | | | 6,334 | |
| Net income (loss) | $ | (18,922) | | | $ | 14,869 | | | $ | (19,934) | | | $ | 31,292 | |
The following table presents identifiable assets by segment at June 30, 2023 and December 31, 2022: | | | | | | | | | | | |
| (In thousands) | June 30, 2023 | | December 31, 2022 |
| Aluminum Extrusions | $ | 266,426 | | | $ | 293,308 | |
| PE Films | 82,191 | | | 102,431 | |
| Flexible Packaging Films | 91,568 | | | 103,448 | |
| Subtotal | 440,185 | | | 499,187 | |
| General corporate | 23,491 | | | 23,674 | |
| Cash and cash equivalents | 21,193 | | | 19,232 | |
| Total | $ | 484,869 | | | $ | 542,093 | |
The following tables disaggregate the Company’s revenue by geographic area and product group for the three and six months ended June 30, 2023 and 2022: | | | | | | | | | | | | | | | | | | | | | | | |
| Net Sales by Geographic Area (a) |
| Three Months Ended June 30, | | Six Months Ended June 30, |
| (In thousands) | 2023 | | 2022 | | 2023 | | 2022 |
| United States | $ | 133,417 | | | $ | 213,955 | | | $ | 284,027 | | | $ | 396,092 | |
| Exports from the United States to: | | | | | | | |
| Asia | 5,477 | | | 14,680 | | | 11,209 | | | 27,145 | |
| Latin America | 1,817 | | | 1,245 | | | 3,676 | | | 2,686 | |
| Canada | 4,955 | | | 4,173 | | | 9,239 | | | 8,366 | |
| Europe | 272 | | | 1,085 | | | 1,132 | | | 2,448 | |
| Operations outside the United States: | | | | | | | |
| Brazil | 24,975 | | | 28,189 | | | 46,603 | | | 55,074 | |
| Asia | 55 | | | — | | | 160 | | | — | |
| Total | $ | 170,968 | | | $ | 263,327 | | | $ | 356,046 | | | $ | 491,811 | |
(a) Export sales relate mostly to PE Films. Operations in Brazil relate to Flexible Packaging Films. |
The Company’s facilities in Pottsville, PA (“PV”) and Guangzhou, China (“GZ”) have a tolling arrangement whereby certain surface protection films are manufactured in GZ for a fee with raw materials supplied from PV that are then shipped by GZ directly to customers principally in the Asian market, but paid by customers directly to PV. Amounts associated with this intercompany tolling arrangement are reported in the table above as export sales from the U.S. to Asia, and include net sales of $3.4 million and $5.3 million in the second quarter of 2023 and 2022, respectively, and $6.8 million and $11.7 million in the first six months of 2023 and 2022, respectively.
| | | | | | | | | | | | | | | | | | | | | | | |
| Net Sales by Product Group |
| Three Months Ended June 30, | | Six Months Ended June 30, |
| (In thousands) | 2023 | | 2022 | | 2023 | | 2022 |
| Aluminum Extrusions: | | | | | | | |
| Nonresidential building & construction | $ | 65,784 | | | $ | 99,302 | | | $ | 144,413 | | | $ | 180,223 | |
| Consumer durables | 11,714 | | | 18,805 | | | 22,061 | | | 35,695 | |
| Automotive | 11,769 | | | 14,473 | | | 23,891 | | | 28,314 | |
| Residential building & construction | 10,056 | | | 20,948 | | | 21,659 | | | 37,413 | |
| Electrical | 6,078 | | | 9,687 | | | 14,207 | | | 16,974 | |
| Machinery & equipment | 11,082 | | | 15,929 | | | 21,806 | | | 28,874 | |
| Distribution | 5,344 | | | 11,164 | | | 7,160 | | | 20,924 | |
| Subtotal | 121,827 | | | 190,308 | | | 255,197 | | | 348,417 | |
| PE Films: | | | | | | | |
| Surface protection films | 8,643 | | | 23,674 | | | 21,497 | | | 45,822 | |
| Overwrap packaging | 7,275 | | | 7,750 | | | 14,602 | | | 16,733 | |
| Subtotal | 15,918 | | | 31,424 | | | 36,099 | | | 62,555 | |
| Flexible Packaging Films | 33,223 | | | 41,595 | | | 64,750 | | | 80,839 | |
| Total | $ | 170,968 | | | $ | 263,327 | | | $ | 356,046 | | | $ | 491,811 | |
11. SUPPLY CHAIN FINANCING
The Company has supply chain finance service agreements with third-party financial institutions to provide platforms that facilitate the ability of participating suppliers to finance payment obligations from the Company with the third-party financial institution. The Company’s obligations to its suppliers, including amounts due and scheduled payment dates, are not affected by suppliers’ decisions to finance amounts under the supply chain finance agreements. As of June 30, 2023 and December 31, 2022, $14.6 million and $25.9 million, respectively, of the Company’s accounts payable were financed by participating suppliers through third-party financial institutions.
12. SUBSEQUENT EVENTS
Closure of PE Films Technical Center
On August 3, 2023, the Company adopted a plan to close the PE Films technical center in Richmond, VA and reduce its efforts to develop and sell films supporting the semiconductor market. Future research & development activities for PE Films will be performed at the facility in Pottsville, PA. PE Films continues to have new business opportunities primarily relating to surface protection films that protect components of flat panel and flexible displays. The Company anticipates all activities to cease at the PE Films technical center in Richmond, VA, by the end of 2023. The Company expects to recognize cash costs associated with exit activities of $1.8 million for: (i) severance and related costs ($0.9 million), (ii) vacating the facility lease ($0.6 million payable through June 2025), and (iii) building closure costs ($0.3 million). In addition, the Company expects non-cash asset write-offs and accelerated depreciation of up to $4.5 million. Net annual cash savings of $3.4 million are anticipated, beginning in the fourth quarter of 2023.
Entry into an Amendment to the Credit Agreement and Suspension of Regular Quarterly Dividend
Subsequent to June 30, 2023, to reduce the risk of potential violations of the primary financial restrictive covenants in its five-year, revolving, secured credit facility that matures on June 29, 2027 (the "Credit Agreement"), the Company (i) suspended its regular quarterly dividend (which had an annual cash outlay of approximately $17.7 million) and (ii) amended the Credit Agreement, effective August 3, 2023, to:
a.Change the fiscal quarter maximum Total Net Leverage Ratio covenant from 4.0x to: (i) 5.0x for the quarters ending September 30, 2023 through March 31, 2024, (ii) 4.75x for the quarter ending June 30, 2024, (iii) 4.25 for the quarter ending September 30, 2024, and (iv) 4.0x for the quarter ending December 31, 2024 and thereafter.
b.Change the fiscal quarter minimum Interest Coverage Ratio covenant from 3.0x to: (i) 2.50x for the quarters ending September 30, 2023 through June 30, 2024, (ii) 2.75x for the quarter ending September 30, 2024, and (iii) 3.0x for the quarter ending December 31, 2024 and thereafter.
c.Reduce the maximum borrowing availability from $375 million to $200 million.
d.Increase the drawn spread by 25 basis points across all levels of the interest rate pricing grid, beginning the quarter ending September 30, 2023.
e.Amend the restricted payments covenant to prohibit dividends and share repurchases during fiscal quarters ending September 30, 2023 through December 31, 2024.
Item 2. Management’s Discussion and Analysis of Financial Condition and Results of Operations.
Forward-looking and Cautionary Statements
Some of the information contained in this Quarterly Report on Form 10-Q ("Form 10-Q") may constitute “forward-looking statements” within the meaning of the “safe harbor” provisions of the Private Securities Litigation Reform Act of 1995. When the Company uses the words “believe,” “estimate,” “anticipate,” “appear to,” “expect,” “project,” “plan,” “likely,” “may” and similar expressions, it does so to identify forward-looking statements. Such statements are based on the Company's then current expectations and are subject to a number of risks and uncertainties that could cause actual results to differ materially from those addressed in the forward-looking statements. It is possible that the Company's actual results and financial condition may differ, possibly materially, from the anticipated results and financial condition indicated in or implied by these forward-looking statements. Accordingly, you should not place undue reliance on these forward-looking statements. Factors that could cause actual results to differ materially from expectations include, without limitation, the following:
•loss or gain of sales to significant customers on which the Company’s business is highly dependent;
•inability to achieve sales to new customers to replace lost business;
•inability to develop, efficiently manufacture and deliver new products at competitive prices;
•failure of the Company’s customers to achieve success or maintain market share;
•failure to protect our intellectual property rights;
•risks of doing business in countries outside the U.S. that affect our international operations;
•political, economic, and regulatory factors concerning the Company’s products;
•uncertain economic conditions in countries in which the Company does business, including continued high inflation and the effects of the Russian invasion of Ukraine;
•competition from other manufacturers, including manufacturers in lower-cost countries and manufacturers benefiting from government subsidies;
•impact of fluctuations in foreign exchange rates;
•movement of pension plan assets and liabilities relating to differences between the ultimate settlement benefit obligation and the projected benefit obligation, census data, administrative costs, and the effectiveness of hedging activities;
•an increase in the operating costs incurred by the Company’s business units, including, for example, the cost of raw materials and energy;
•unanticipated problems or delays with the implementation of an enterprise resource planning and manufacturing executions systems, or security breaches and other disruptions to the Company's information technology infrastructure;
•inability to successfully identify, complete or integrate strategic acquisitions; failure to realize the expected benefits of such acquisitions and assumption of unanticipated risks in such acquisitions;
•disruptions to the Company’s manufacturing facilities, including those resulting from labor shortages;
•failure to continue to attract, develop and retain certain key officers or employees;
•noncompliance with any of the financial and other restrictive covenants in the Company's revolving credit facility;
•the impact of public health epidemics on employees, production and the global economy, such as the COVID-19 pandemic;
•an information technology system failure or breach;
•the impact of the imposition of tariffs and sanctions on imported aluminum ingot used by Bonnell Aluminum;
•the impact of new tariffs, duties or other trade restrictions imposed as a result of trade tensions between the U.S. and other countries;
•the termination of anti-dumping duties on products imported to Brazil that compete with products produced by Flexible Packaging;
•impairment of the Surface Protection reporting unit's goodwill;
•failure to establish and maintain effective internal control over financial reporting;
and the other factors discussed in the reports Tredegar files with or furnishes to the Securities and Exchange Commission (the “SEC”) from time to time, including the risks and important factors set forth in additional detail in Part I, Item 1A of Tredegar’s Annual Report on Form 10-K for the year ended December 31, 2022 (the “2022 Form 10-K”) and Part II, Item 1A of this Form 10-Q. Readers are urged to review and consider carefully the disclosures Tredegar makes in its filings with the SEC.
Tredegar does not undertake, and expressly disclaims any duty, to update any forward-looking statement to reflect any change in management’s expectations or any change in conditions, assumptions or circumstances on which such statements are based, except as required by applicable law.
References herein to “Tredegar,” “the Company,” “we,” “us” and “our” are to Tredegar Corporation and its subsidiaries, collectively, unless the context otherwise indicates or requires.
Unless otherwise stated or indicated, all comparisons are to the prior year period. References to "Notes" are to notes to our condensed consolidated financial statements found in Part I, Item 1 of this Form 10-Q.
Critical Accounting Policies and Estimates
In the ordinary course of business, the Company makes a number of estimates and assumptions relating to the reporting of results of operations and financial position in the preparation of financial statements in conformity with generally accepted accounting standards in the United States ("GAAP"). The Company believes the estimates, assumptions and judgments described in the section “Management’s Discussion and Analysis of Financial Condition and Results of Operations – Critical Accounting Policies and Estimates” in the 2022 Form 10-K have the greatest potential impact on our financial statements, so Tredegar considers these to be its critical accounting policies. Since December 31, 2022, there have been no changes in these policies or estimates that have had a material impact on our results of operations or financial position.
Business Overview
Tredegar Corporation is an industrial manufacturer with three primary businesses: custom aluminum extrusions for the North American building and construction ("B&C"), automotive and specialty end-use markets through its Aluminum Extrusions segment; surface protection films for high-technology applications in the global electronics industry through its PE Films segment; and specialized polyester films primarily for the Latin American flexible packaging market through its Flexible Packaging Films segment. With approximately 1,800 employees, the Company operates manufacturing facilities in North America, South America, and Asia.
Earnings before interest, taxes, depreciation and amortization ("EBITDA") from ongoing operations is the measure of segment profit and loss used by Tredegar’s chief operating decision maker ("CODM") for purposes of assessing financial performance. The Company uses sales less freight (“net sales”) as its measure of revenues from external customers at the segment level. This measure is separately included in the financial information regularly provided to the CODM.
Earnings before interest and taxes ("EBIT") from ongoing operations is a non-GAAP financial measure included in the reconciliation of segment financial information to consolidated results for the Company in Note 10. It is not intended to represent the stand-alone results for Tredegar's ongoing operations under GAAP and should not be considered as an alternative to net income as defined by GAAP. We believe that EBIT is a widely understood and utilized metric that is meaningful to certain investors and that including this financial metric in the reconciliation of management’s performance metric, EBITDA from ongoing operations, provides useful information to those investors that primarily utilize EBIT to analyze the Company’s core operations.
Second quarter 2023 net income (loss) was $(18.9) million ($(0.56) per diluted share) compared with net income (loss) of $14.9 million ($0.44 per diluted share) in the second quarter of 2022.
Second Quarter Financial Results Highlights
•EBITDA from ongoing operations for Aluminum Extrusions was $10.2 million in the second quarter of 2023 versus $21.9 million in the second quarter of last year. EBITDA from ongoing operations during the last four quarters has been weak, in a range of $8.9 to $14.6 million.
◦Sales volume of 35.5 million pounds in the second quarter of 2023 was relatively consistent with the first quarter of 2023 and the fourth quarter of 2022 but declined significantly versus 49.0 million pounds in the second quarter of last year.
◦Open orders at the end of the second quarter of 2023 were 20 million pounds (versus 27 million pounds at the end of the first quarter of 2023), which is below the quarterly range of 21 to 27 million pounds in 2019 before pandemic-related disruptions that resulted in excessive open orders, which peaked in the first quarter of 2022 at approximately 100 million pounds.
◦While open orders have declined over the past year, Aluminum Extrusions has realized three sequential quarters of net booking growth.
•EBITDA from ongoing operations for PE Films was $0.8 million in the second quarter of 2023 versus $7.1 million in the second quarter of 2022 as very weak conditions persisted in the consumer electronics market. EBITDA from ongoing operations during the last four quarters has been low with a range of negative $2.6 million to positive $1.8 million.
•EBITDA from ongoing operations for Flexible Packaging Films was $0.2 million during the second quarter of 2023 versus $7.6 million in the second quarter of 2022 primarily due to lower sales volume, which the Company believes is mainly due to customer inventory corrections, lower margins and unfavorable cost variances.
The Company recognized a net loss for the second quarter of 2023, with all business segments and their respective markets experiencing depressed conditions, which the Company believes can be traced to the residual impact of the pandemic.
The timing of recovery for our businesses remains uncertain and has been slow in occurring. Debt, net of cash, declined during the quarter as a result of improvements in working capital, with further improvements anticipated by year end.
Other losses related to asset impairments and costs associated with exit and disposal activities were not material for the three and six months ended June 30, 2023 and 2022, respectively. Gains and losses associated with plant shutdowns, asset impairments, restructurings and other items are described in Results of Operations below.
Results of Operations
Second Quarter of 2023 Compared with the Second Quarter of 2022
The following table presents a bridge of consolidated net income (loss) from the second quarter of 2022 to the second quarter of 2023 with management's related discussion and analysis below the table.
| | | | | | | | |
| (In thousands) | | |
Net income (loss) for the three months ended June 30, 2022 | | $ | 14,869 | |
| Income tax expense (benefit) | | 5,556 | |
Income (loss) before income taxes for the three months ended June 30, 2022 | | 20,425 | |
| Increase (decrease) in income from increases (decreases) in the following items: | | |
| Sales | | (96,196) | |
| Other income (expense), net | | (1,362) | |
| Total | | (97,558) | |
| Increase (decrease) in income from (increases) decreases in the following items: | | |
| Cost of goods sold | | 64,821 | |
| Freight | | 3,837 | |
| Selling, general and administrative | | 1,973 | |
| Goodwill impairment | | (15,413) | |
| Other | | (338) | |
| Total | | 54,880 | |
Income (loss) before income taxes for the three months ended June 30, 2023 | | (22,253) | |
| Income tax expense (benefit) | | (3,331) | |
Net income (loss) for the three months ended June 30, 2023 | | $ | (18,922) | |
Sales in the second quarter of 2023 decreased by $96.2 million compared with the second quarter of 2022. Net sales (sales less freight) in Aluminum Extrusions decreased $68.5 million, primarily due to lower sales volume and the pass-through of lower metal costs, partially offset by an increase in prices to cover higher operating costs. Net sales in PE Films decreased $15.5 million, primarily due to continuing weak market demand and unfavorable product mix. Net sales in Flexible Packaging Films decreased $8.4 million, primarily due to lower sales volume, lower selling prices from the pass-through of lower resin costs and unfavorable product mix. For more information on net sales and volume, see the Segment Operations Review below.
Other income (expense), net was $(20) thousand in the second quarter of 2023 compared to other income (expense), net of $1.3 million in the second quarter of 2022. The change in other income (expense), net is primarily due to cash consideration of $1.4 million received in May 2022 related to the customary post-closing adjustments on the sale of the investment in kaleo, Inc. ("kaléo"), which was sold in December 2021. See Note 5 for additional information.
Consolidated gross profit (sales minus cost of goods sold and freight) as a percentage of sales (gross profit margin) was 9.9% in the second quarter of 2023 compared to 16.5% in the second quarter of 2022. The gross profit margin in Aluminum Extrusions decreased primarily due to lower sales volume, higher labor and employee-related costs, lower labor productivity, lower pricing and higher supply expense associated with inflationary costs, partially offset by lower utility costs and lower freight rates. Additionally, the timing of the flow through under the first-in first-out method of aluminum raw material costs passed through to customers, previously acquired at higher prices in a quickly changing commodity pricing environment, resulted in a charge of $1.3 million in the second quarter of 2023 versus a charge of $1.6 million in the second quarter of 2022. The gross profit margin in PE Films decreased primarily due to a lower Surface Protection contribution margin associated with a market slowdown, customer inventory corrections and the pass-through lag associated with resin costs, partially offset by overwrap films favorable pricing and mix. The gross profit margin in Flexible Packaging Films decreased primarily due to lower selling prices from the pass-through of lower resin costs and margin pressures, lower sales volume, higher fixed costs, higher variable costs and unfavorable product mix, partially offset by lower raw material costs.
As a percentage of sales, selling, general and administrative (“SG&A”) and research and development ("R&D") expenses were 10.3% in the second quarter of 2023 compared with 7.5% in the second quarter of 2022. While second quarter SG&A expenses and sales decreased year-over-year, R&D expenses remained relatively consistent with the prior year period. Lower SG&A spending is primarily due to lower accruals for employee-related compensation and lower stock-based compensation, partially offset by higher professional fees associated with business development activities.
In the second quarter of 2023, a non-cash partial goodwill impairment of $15.4 million was recognized, see the PE Films section in Segment Operations Review below for more information.
The effective tax rate used to compute income taxes for the second quarter of 2023 was 15.0%, compared to 27.3% in the second quarter of 2022. The change in the effective tax rate is primarily due to a pre-tax loss in the three months ending June 30, 2023 versus pre-tax income in the three months ending June 30, 2022, lower Brazil tax incentives and a discrete charge in the second quarter of 2023 for a Brazil tax law change. See Note 9 for additional information.
Pre-tax gains and losses associated with plant shutdowns, asset impairments, restructurings and other items for the second quarters of 2023 and 2022 detailed below are shown in the statements of net sales and EBITDA from ongoing operations by segment table in Note 10 and are included in “Asset impairments and costs associated with exit and disposal activities, net of adjustments” in the condensed consolidated statements of income, unless otherwise noted. | | | | | | | | |
| Three Months Ended June 30, |
| (In millions) | 2023 | 2022 |
| Aluminum Extrusions: | | |
| (Gains) losses from sale of assets, investment writedowns and other items: | | |
Storm damage to the Newnan, Georgia plant2 | $ | (0.2) | | $ | — | |
| Total for Aluminum Extrusions | $ | (0.2) | | $ | — | |
| PE Films: | | |
| (Gains) losses from sale of assets, investment writedowns and other items: | | |
COVID-19-related expenses1 | $ | — | | $ | 0.1 | |
| Goodwill impairment | 15.4 | | — | |
| Total for PE Films | $ | 15.4 | | $ | 0.1 | |
| | |
| | |
| | |
| | |
| Corporate: | | |
| (Gains) losses associated with plant shutdowns, asset impairments and restructurings: | | |
| Other restructuring costs - severance | $ | — | | $ | 0.1 | |
| (Gains) losses from sale of assets, investment writedowns and other items: | | |
Professional fees associated with business development activities2 | 1.6 | | 0.1 | |
Professional fees associated with remediation activities related to internal control over financial reporting2 | 0.5 | | 0.8 | |
Write-down of investment in Harbinger Capital Partners Special Situations Fund1 | 0.2 | | — | |
Stock-based compensation expense associated with the fair value remeasurement of awards granted at the time of the 2020 special dividend2 | (0.1) | | (0.2) | |
Net periodic benefit cost for the frozen defined benefit pension plan in process of termination3 | 3.4 | | 3.5 | |
| Total for Corporate | $ | 5.6 | | $ | 4.3 | |
1. Included in “Other income (expense), net” in the condensed consolidated statements of income. 2. Included in “Selling, general and administrative expenses” in the condensed consolidated statements of income. 3. See “Corporate Expenses, Interest, & Other” below and Note 4 for additional information. |
Average debt outstanding and interest rates were as follows: | | | | | | | | | | | |
| Three Months Ended June 30, |
| (In millions, except percentages) | 2023 | | 2022 |
| Floating-rate debt with interest charged on a rollover basis plus a credit spread: | | | |
| Average outstanding debt balance | $ | 150.0 | | | $ | 109.9 | |
| Average interest rate | 6.9 | % | | 2.4 | % |
First Six Months of 2023 Compared with the First Six Months of 2022
The following table presents a bridge of consolidated net income (loss) from the first six months of 2022 to the first six months of 2023 with management's related discussion and analysis below the table.
| | | | | | | | |
| (In thousands) | | |
Net income (loss) for the six months ended June 30, 2022 | | $ | 31,292 | |
| Income tax expense (benefit) | | 6,334 | |
Income (loss) before income taxes for the six months ended June 30, 2022 | | 37,626 | |
| Increase (decrease) in income from increases (decreases) in the following items: | | |
| Sales | | (141,640) | |
| Other income (expense), net | | (781) | |
| Total | | (142,421) | |
| Increase (decrease) in income from (increases) decreases in the following items: | | |
| Cost of goods sold | | 88,556 | |
| Freight | | 5,875 | |
| Selling, general and administrative | | 4,249 | |
| Goodwill impairment | | (15,413) | |
| Other | | (1,406) | |
| Total | | 81,861 | |
Income (loss) before income taxes for the six months ended June 30, 2023 | | (22,934) | |
| Income tax expense (benefit) | | (3,000) | |
Net income (loss) for the six months ended June 30, 2023 | | $ | (19,934) | |
Sales in the first six months of 2023 decreased by $141.6 million compared with the first six months of 2022. Net sales (sales less freight) in Aluminum Extrusions decreased $93.2 million, primarily due to lower sales volume and the pass-through of lower metal costs, partially offset by an increase in prices to cover higher operating costs. Net sales in PE Films decreased $26.5 million, primarily due to continuing weak market demand and unfavorable product mix. Net sales in Flexible Packaging Films decreased $16.1 million, primarily due to lower sales volume and lower selling prices from the pass-through of lower resin costs, partially offset by favorable product mix. For more information on net sales and volume, see the Segment Operations Review below.
Other income (expense), net was $0.3 million in the first six months of 2023 compared to other income (expense), net of $1.0 million in the first six months of 2022. The change in other income (expense), net is primarily due to cash consideration of $0.3 million received in January 2023 compared to $1.4 million received in May 2022 related to the customary post-closing adjustments on the sale of the investment in kaléo, which was sold in December 2021. See Note 5 for additional information.
Consolidated gross profit (sales minus cost of goods sold and freight) as a percentage of sales (gross profit margin) was 11.7% in the first six months of 2023 compared to 17.7% in the first six months of 2022. The gross profit margin in Aluminum Extrusions decreased primarily due to lower sales volume, higher labor and employee-related costs, lower labor productivity and higher supply expense, including higher paint expense associated with a shift to more painted product in the first quarter of 2023 and inflationary costs for other supplies, partially offset by higher pricing and lower utility costs. Additionally, the timing of the flow through under the first-in first-out method of aluminum raw material costs passed through to customers, previously acquired at lower prices in a quickly changing commodity pricing environment, resulted in a benefit of $0.4 million in the first six months of 2023 versus a benefit of $5.5 million in the first six months of 2022. The gross profit margin in PE Films decreased primarily due to a lower Surface Protection contribution margin for previously disclosed customer product transitions and for non-transitioning products associated with a market slowdown and customer inventory corrections, partially offset by favorable pricing and mix for overwrap films. The gross profit margin in Flexible Packaging Films decreased primarily due to lower sales volume, lower selling prices from the pass-through of lower resin costs and margin pressures, higher fixed costs, higher variable costs and unfavorable product mix, partially offset by lower raw material costs.
As a percentage of sales, SG&A and R&D expenses were 10.4% in the first six months of 2023, compared with 8.5% in the first six months of 2022. While first half SG&A expenses and sales decreased year-over-year, R&D expenses remained relatively consistent with the prior year period. Lower SG&A spending was primarily due to lower accruals for employee-related compensation and lower stock-based compensation, partially offset by higher professional fees associated with business development activities.
In the first half of 2023, a non-cash partial goodwill impairment of $15.4 million was recognized, see the PE Films section in Segment Operations Review below for more information.
The effective tax rate used to compute income taxes for the first six months of 2023 was 13.1%, compared to 16.9% in the first six months of 2022. The change in the effective tax rate is primarily due to a pre-tax loss in first six months of 2023 versus pre-tax income in first six months of 2022, lower Brazil tax incentives, a discrete charge in the second quarter of 2023 for a Brazil tax law change and a large discrete benefit recorded in the first quarter of 2022, resulting from the implementation of new U.S. tax regulations associated with foreign tax credits published by the U.S. Treasury and Internal Revenue Service on January 4, 2022. See Note 9 for additional information.
Pre-tax gains and losses associated with plant shutdowns, asset impairments, restructurings and other items for the first six months of 2023 and 2022 detailed below are shown in the statements of net sales and EBITDA from ongoing operations by segment table in Note 10 and are included in “Asset impairments and costs associated with exit and disposal activities, net of adjustments” in the condensed consolidated statements of income, unless otherwise noted. | | | | | | | | |
| Six Months Ended June 30, |
| (In millions) | 2023 | 2022 |
| Aluminum Extrusions: | | |
| (Gains) losses from sale of assets, investment writedowns and other items: | | |
Storm damage to the Newnan, Georgia plant2 | $ | 0.4 | | $ | — | |
COVID-19-related expenses, net of relief1 | — | | 0.1 | |
| Total for Aluminum Extrusions | $ | 0.4 | | $ | 0.1 | |
| PE Films: | | |
| (Gains) losses from sale of assets, investment writedowns and other items: | | |
COVID-19-related expenses1 | $ | — | | $ | 0.2 | |
| Goodwill Impairment | 15.4 | | — | |
| Total for PE Films | $ | 15.4 | | $ | 0.2 | |
| Flexible Packaging Films: | | |
| (Gains) losses associated with plant shutdowns, asset impairments and restructurings: | | |
| Other restructuring costs - severance | $ | 0.1 | | $ | — | |
| Total for Flexible Packaging Films | $ | 0.1 | | $ | — | |
| Corporate: | | |
| (Gains) losses associated with plant shutdowns, asset impairments and restructurings: | | |
| Other restructuring costs - severance | $ | — | | $ | 0.1 | |
| (Gains) losses from sale of assets, investment writedowns and other items: | | |
Professional fees associated with business development activities2 | $ | 1.9 | | $ | 1.6 | |
Professional fees associated with remediation activities related to internal control over financial reporting2 | 1.0 | | 1.2 | |
Write-down of investment in Harbinger Capital Partners Special Situations Fund1 | 0.2 | | — | |
Stock-based compensation expense associated with the fair value remeasurement of awards granted at the time of the 2020 special dividend2 | (0.2) | | (0.2) | |
Net periodic benefit cost for the frozen defined benefit pension plan in process of termination3 | 6.8 | | 6.9 | |
| Total for Corporate | $ | 9.7 | | $ | 9.6 | |
1. Included in “Other income (expense), net” in the condensed consolidated statements of income. 2. Included in “Selling, general and administrative expenses” in the condensed consolidated statements of income. 3. See “Corporate Expenses, Interest, & Other” below and Note 4 for additional information. |
Average debt outstanding and interest rates were as follows: | | | | | | | | | | | |
| Six Months Ended June 30, |
| (In millions, except percentages) | 2023 | | 2022 |
| Floating-rate debt with interest charged on a rollover basis plus a credit spread: | | | |
| Average outstanding debt balance | $ | 148.5 | | | $ | 106.9 | |
| Average interest rate | 6.6 | % | | 2.1 | % |
Segment Operations Review
Aluminum Extrusions
A summary of results for Aluminum Extrusions is provided below: | | | | | | | | | | | | | | | | | | | | | | | | | | | | | | | | | | | |
| Three Months Ended | | Favorable/
(Unfavorable)
% Change | | Six Months Ended | | Favorable/
(Unfavorable)
% Change |
| (In thousands, except percentages) | June 30, | | June 30, | |
| 2023 | | 2022 | | 2023 | | 2022 | |
| Sales volume (lbs) | 35,492 | | | 48,960 | | | (27.5)% | | 73,054 | | | 91,970 | | | (20.6)% |
| Net sales | $ | 121,827 | | | $ | 190,308 | | | (36.0)% | | $ | 255,197 | | | $ | 348,417 | | | (26.8)% |
| Ongoing operations: | | | | | | | | | | | |
| EBITDA | $ | 10,217 | | | $ | 21,895 | | | (53.3)% | | $ | 24,855 | | | $ | 45,814 | | | (45.7)% |
| Depreciation & amortization | (4,158) | | | (4,169) | | | 0.3% | | (8,569) | | | (8,430) | | | (1.6)% |
| EBIT* | $ | 6,059 | | | $ | 17,726 | | | (65.8)% | | $ | 16,286 | | | $ | 37,384 | | | (56.4)% |
| Capital expenditures | $ | 5,631 | | | $ | 3,989 | | | | | $ | 13,373 | | | $ | 6,870 | | | |
*See the table in Note 10 for a reconciliation of this non-GAAP measure to the most comparable measure calculated in accordance with GAAP. |
Second Quarter 2023 Results vs. Second Quarter 2022 Results
Net sales (sales less freight) in the second quarter of 2023 decreased 36.0% versus the second quarter of 2022 primarily due to lower sales volume and the pass-through of lower metal costs, partially offset by an increase in prices to cover higher operating costs. Sales volume in the second quarter of 2023 declined 27.5% versus the second quarter of 2022. Nonresidential B&C sales volume, which represented 53% of 2022 volume, declined 23.8% in the second quarter of 2023 versus the second quarter of 2022. Sales volume in the specialty market, which represented 29% of total volume in 2022, decreased 32.7% in the second quarter of 2023 versus the second quarter of 2022. Sales volume in the automotive market, which represented 8% of total volume in 2022, decreased 7.8% in the second quarter of 2023 versus the second quarter of 2022.
Beginning in the third quarter of 2022, the Company observed slowing order input and order cancellations as customers continued to report high inventory levels, which carried into 2023. Open orders at the end of the second quarter of 2023 were 20 million pounds (versus 27 million pounds at the end of the first quarter of 2023 and 86 million pounds at the end of the second quarter 2022). This level is below the quarterly range of 21 to 27 million pounds in 2019 before pandemic-related disruptions that resulted in long lead times driving a peak in open orders of approximately 100 million pounds during the first quarter of 2022. In addition, data indicates that aluminum extrusion imports have increased significantly in recent years, and some of Bonnell Aluminum’s customers may have sourced, and continue to source, aluminum extrusions from producers outside of the United States. The Company is closely monitoring the situation and is prepared to work with the U.S. Government to ensure a fairly traded market. Nonetheless, Bonnell Aluminum has experienced three sequential quarters of net booking growth. Net bookings were 16.9, 19.0, 20.4 and 28.2 million pounds in the third quarter of 2022 through the second quarter of 2023, respectively.
EBITDA from ongoing operations in the second quarter of 2023 decreased $11.7 million or 53.3% versus the second quarter of 2022 primarily due to:
•Lower volume ($11.9 million), higher labor and employee-related costs ($0.7 million), lower labor productivity ($0.5 million), lower pricing ($1.0 million) and higher supply expense associated with inflationary costs ($0.8 million), partially offset by lower utility costs ($1.0 million), lower freight rates ($0.3 million) and lower SG&A expenses ($1.6 million); and
•The timing of the flow-through under the first-in first-out method of aluminum raw material costs passed through to customers, previously acquired at higher prices in a quickly changing commodity pricing environment, resulted in a charge of $1.3 million in the second quarter of 2023 versus a charge of $1.6 million in the second quarter of 2022.
First Six Months of 2023 Results v. First Six Months of 2022 Results
Net sales in the first six months of 2023 decreased 26.8% versus the first six months of 2022 primarily due to lower sales volume and the pass-through of lower metal costs, partially offset by an increase in prices to cover higher operating costs. Sales volume in the first six months of 2023 decreased by 20.6% versus the first six months of 2022.
EBITDA from ongoing operations in the first six months of 2023 decreased $21.0 million or 45.7% in comparison to the first six months of 2022 primarily due to:
•Lower volume ($16.1 million), higher labor and employee-related costs ($2.4 million), lower labor productivity ($1.0 million) and higher supply expense, including higher paint expense associated with a shift to more painted product in
the first six months of 2023, and inflationary costs for other supplies ($3.0 million), partially offset by higher pricing ($5.6 million), lower utility costs ($0.6 million) and lower SG&A expenses ($0.8 million); and
•The timing of the flow-through under the first-in first-out method of aluminum raw material costs passed through to customers, previously acquired at lower prices in a quickly changing commodity pricing environment, resulted in a benefit of $0.4 million in the first six months of 2023 versus a benefit of $5.5 million in the first six months of 2022.
Refer to Item 3. Quantitative and Qualitative Disclosures About Market Risk in this Form 10-Q for additional information on aluminum prices.
Projected Capital Expenditures and Depreciation & Amortization
Capital expenditures for Bonnell Aluminum are projected to be $19 million in 2023 versus the previously disclosed projection of $26 million. The Company has implemented stringent spending measures to control its financial leverage (see “Net Debt, Financial Leverage and Debt Covenants” section for more information). In this regard, Bonnell Aluminum has reduced projected capital expenditures in the second half of 2023 to $5 million to mainly support continuity of current operations versus broader spending of $14 million during the first half of the year. The most significant reduction relates to the multi-year implementation of new enterprise resource planning and manufacturing execution systems ("ERP/MES"). This project is being reorganized with an extended implementation period that increases the utilization of existing dedicated internal resources over a longer period in place of more costly external consultants. As a result, the earliest “go-live” date for the new ERP/MES is likely in 2025. The ERP/MES project commenced in 2022, with spending to-date of approximately $21 million. Depreciation expense is projected to be $15 million in 2023. Amortization expense is projected to be $2 million in 2023.
PE Films
A summary of results for PE Films is provided below: | | | | | | | | | | | | | | | | | | | | | | | | | | | | | | | | | | | |
| Three Months Ended | | Favorable/
(Unfavorable)
% Change | | Six Months Ended | | Favorable/
(Unfavorable)
% Change |
| (In thousands, except percentages) | June 30, | | June 30, | |
| 2023 | | 2022 | | 2023 | | 2022 | |
| Sales volume (lbs) | 6,245 | | | 9,639 | | | (35.2)% | | 13,613 | | | 20,192 | | | (32.6)% |
| Net sales | $ | 15,918 | | | $ | 31,424 | | | (49.3)% | | $ | 36,099 | | | $ | 62,555 | | | (42.3)% |
| Ongoing operations: | | | | | | | | | | | |
| EBITDA | $ | 814 | | | $ | 7,065 | | | (88.5)% | | $ | 2,663 | | | $ | 14,112 | | | (81.1)% |
| Depreciation & amortization | (1,552) | | | (1,559) | | | 0.4% | | (3,195) | | | (3,154) | | | (1.3)% |
| EBIT* | $ | (738) | | | $ | 5,506 | | | (113.4)% | | $ | (532) | | | $ | 10,958 | | | (104.9)% |
| Capital expenditures | $ | 360 | | | $ | 1,163 | | | | | $ | 1,075 | | | $ | 1,744 | | | |
* See the table in Note 10 for a reconciliation of this non-GAAP measure to the most comparable measure calculated in accordance with GAAP. |
Second Quarter 2023 Results vs. Second Quarter 2022 Results
Net sales in the second quarter of 2023 decreased 49.3% compared to the second quarter of 2022. Sales volume in the second quarter of 2023 decreased in both Surface Protection and overwrap films versus the second quarter of 2022. Surface Protection sales volume in the second quarter of 2023 declined 54.2% versus the second quarter of 2022 and 26.9% versus the first quarter of 2023. Surface Protection sales continue to be adversely impacted by weak market demand for consumer electronics which began in the third quarter of last year. Manufacturers in the supply chain are experiencing reduced capacity utilization and inventory corrections. In addition, these market conditions are adversely impacting mix through reduced sales to our highest value-added customers. The timing of a recovery in Surface Protection remains uncertain.
EBITDA from ongoing operations in the second quarter of 2023 decreased $6.3 million versus the second quarter of 2022, primarily due to:
•A $7.7 million decrease from Surface Protection:
◦Lower contribution margin associated with a market slowdown and customer inventory corrections ($8.6 million), partially offset by lower SG&A and operating efficiencies ($0.7 million); and
◦The pass-through lag associated with resin costs ($0.1 million charge in the second quarter of 2023 versus a charge of $0.3 million in the second quarter of 2022).
•A $1.4 million increase from overwrap films primarily due to cost improvements.
First Six Months of 2023 Results v. First Six Months of 2022 Results
Net sales in the first six months of 2023 decreased 42.3% compared to the first six months of 2022 primarily due to a decrease in sales volume in Surface Protection, as a result of the factors noted above. Sales volume declined 45.4% in Surface Protection in the first six months of 2023.
EBITDA from ongoing operations in the first six months of 2023 decreased by $11.4 million versus the first six months of 2022, primarily due to:
•A $12.6 million decrease from Surface Protection:
◦Lower contribution margin for non-transitioning products associated with a market slowdown and customer inventory corrections ($12.7 million) and for previously disclosed customer product transitions ($0.7 million), partially offset by lower SG&A and other employee-related expenses and operating efficiencies ($1.2 million); and
◦The pass-through lag associated with resin costs ($0.2 million charge in the second quarter of 2023 versus a benefit of $0.2 million in the second quarter of 2022).
•A $1.1 million increase from overwrap films primarily due to cost improvements ($1.5 million), partially offset by the pass-through lag associated with resin costs (a charge of $0.2 million in the first six months of 2023 versus a benefit of $0.2 million in the first six months of 2022).
Refer to Item 3. Quantitative and Qualitative Disclosures About Market Risk in this Form 10-Q for additional information on resin prices.
Closure of PE Films Technical Center
On August 3, 2023, the Company adopted a plan to close the PE Films technical center in Richmond, VA and reduce its efforts to develop and sell films supporting the semiconductor market. Future research & development activities for PE Films will be performed at the facility in Pottsville, PA. PE Films continues to have new business opportunities primarily relating to surface protection films that protect components of flat panel and flexible displays. The Company anticipates all activities to cease at the PE Films technical center in Richmond, VA, by the end of 2023. The Company expects to recognize cash costs associated with exit activities of $1.8 million for: (i) severance and related costs ($0.9 million), (ii) vacating the facility lease ($0.6 million payable through June 2025), and (iii) building closure costs ($0.3 million). In addition, the Company expects non-cash asset write-offs and accelerated depreciation of up to $4.5 million. Net annual cash savings of $3.4 million are anticipated, beginning in the fourth quarter of 2023.
Goodwill Impairment in Surface Protection
Manufacturers in the supply chain for consumer electronics continue to experience reduced capacity utilization and inventory corrections. In light of the continued uncertainty about the timing of a recovery for this market and the expected adverse future impact to the Surface Protection business, the Company performed a goodwill impairment analysis of the Surface Protection component of PE Films using projections that contemplate the expected market recovery and business conditions. The analysis concluded that the fair value of Surface Protection was less than its carrying value, thus a non-cash partial goodwill impairment of $15.4 million ($11.9 million after deferred income tax benefits) was recognized during the second quarter of 2023.
Projected Capital Expenditures and Depreciation & Amortization
Capital expenditures for PE Films are projected to be $3 million in 2023, including $1 million for productivity projects and $2 million for capital expenditures required to support continuity of current operations. Depreciation expense is projected to be $6 million in 2023. There is no amortization expense for PE Films.
Flexible Packaging Films
A summary of results for Flexible Packaging Films is provided below: | | | | | | | | | | | | | | | | | | | | | | | | | | | | | | | | | | | |
| Three Months Ended | | Favorable/
(Unfavorable)
% Change | | Six Months Ended | | Favorable/
(Unfavorable)
% Change |
| (In thousands, except percentages) | June 30, | | June 30, | |
| 2023 | | 2022 | | 2023 | | 2022 | |
| Sales volume (lbs) | 23,724 | | | 27,315 | | | (13.1)% | | 43,569 | | | 53,321 | | | (18.3)% |
| Net sales | $ | 33,223 | | | $ | 41,595 | | | (20.1)% | | $ | 64,750 | | | $ | 80,839 | | | (19.9)% |
| Ongoing operations: | | | | | | | | | | | |
| EBITDA | $ | 249 | | | $ | 7,631 | | | (96.7)% | | $ | 1,599 | | | $ | 12,665 | | | (87.4)% |
| Depreciation & amortization | (711) | | | (583) | | | (22.0)% | | (1,411) | | | (1,132) | | | (24.6)% |
| EBIT* | $ | (462) | | | $ | 7,048 | | | (106.6)% | | $ | 188 | | | $ | 11,533 | | | (98.4)% |
| Capital expenditures | $ | 878 | | | $ | 3,264 | | | | | $ | 1,483 | | | $ | 4,809 | | | |
* See the table in Note 10 for a reconciliation of this non-GAAP measure to the most comparable measure calculated in accordance with GAAP. |
Second Quarter 2023 Results vs. Second Quarter 2022 Results
Net sales in the second quarter of 2023 decreased 20.1% compared to the second quarter of 2022 primarily due to lower sales volume, lower selling prices from the pass-through of lower resin costs and unfavorable product mix. The Company believes that lower sales volume was primarily due to customer inventory corrections. While sales volume in the second quarter of 2023 was still below expected normalized levels, it improved 20% over the first quarter of the year.
EBITDA from ongoing operations in the second quarter of 2023 decreased $7.4 million versus the second quarter of 2022, primarily due to:
•Lower selling prices from the pass-through of lower resin costs and margin pressures ($2.9 million), lower sales volume ($1.9 million), higher fixed costs ($1.1 million, primarily due to under absorption from lower production volumes), higher variable costs ($1.8 million, including higher costs resulting from quality issues and other costs associated with the shutdown of production lines to adjust production volumes to sales levels) and unfavorable product mix ($0.6 million), partially offset by lower raw material costs ($1.3 million) and lower SG&A expenses ($0.1 million);
•Foreign currency transaction losses ($0.2 million) in the second quarter of 2023 compared to foreign currency transaction gains ($0.6 million) in the second quarter of 2022; and
•Net favorable foreign currency translation of Real-denominated operating costs ($0.2 million).
First Six Months of 2023 Results v. First Six Months of 2022 Results
Net sales in the first six months of 2023 decreased 19.9% compared to the first six months of 2022 primarily due to lower sales volume and lower selling prices from the pass-through of lower resin costs, partially offset by favorable product mix.
EBITDA from ongoing operations in the first six months of 2023 decreased $11.1 million versus the first six months of 2022 primarily due to:
•Lower sales volume ($4.9 million), lower selling prices from the pass-through of lower resin costs and margin pressures ($3.6 million), higher fixed costs ($2.1 million, primarily due to under absorption from lower production volumes), higher variable costs ($0.7 million, including higher costs resulting from quality issues) and unfavorable product mix ($1.3 million), partially offset by lower raw material costs ($1.6 million) and lower SG&A expenses ($0.1 million);
•Net unfavorable foreign currency translation of Real-denominated operating costs ($0.1 million); and
•Foreign currency transaction losses ($0.2 million) in the second quarter of 2023 compared to foreign currency transaction losses ($0.3 million) in the second quarter of 2022.
Refer to Item 3. Quantitative and Qualitative Disclosures About Market Risk in this Form 10-Q for additional information on polyester fiber and component price trends.
Projected Capital Expenditures and Depreciation & Amortization
Capital expenditures for Flexible Packaging Films are projected to be $6 million in 2023, including $2 million for new capacity for value-added products and productivity projects and $4 million for capital expenditures required to support continuity of current operations. Depreciation expense is projected to be $3 million in 2023. Amortization expense is projected to be $0.1 million in 2023.
Corporate Expenses, Interest & Other
Corporate expenses, net in the first six months of 2023 decreased $2.0 million compared to the first six months of 2022 primarily due to lower accruals for employee-related compensation ($2.1 million) and lower stock-based compensation ($0.4 million), partially offset by higher professional fees associated with business development activities ($0.6 million).
Interest expense of $4.7 million in the first six months of 2023 increased $2.7 million compared to the first six months of 2022 due to higher average debt levels and interest rates.
Pension expense under GAAP of $6.8 million in the first six months of 2023 remained consistent with the first six months of 2022. In February 2022, Tredegar announced the initiation of a process to terminate and settle its frozen defined benefit pension plan. In connection therewith, the Company borrowed funds under its revolving credit agreement ("Credit Agreement") and made a $50 million contribution to the pension plan (the “Special Contribution”) to reduce its underfunding and as part of a program within the pension plan to hedge or fix the expected future contributions that will be needed by the Company through the settlement process. The funds borrowed for the Special Contribution were effectively made available with proceeds received in December 2021 from the sale of the Company’s investment in kaléo. In addition, the Company realized income tax cash benefits on the Special Contribution of $11 million in the fourth quarter of 2022.
During the second quarter of 2023, the Company received a favorable IRS determination letter, and government agencies and the Company expect the completion of the settlement process on or about October 31, 2023. Administrative costs for the entire settlement process with respect to the pension plan are estimated at $4 to $5 million.
The estimated underfunding of Tredegar’s frozen defined benefit pension plan was approximately $30 million at June 30, 2023. As of December 31, 2022, the estimated underfunding of $28 million was comprised of investments at fair value of $218 million and a projected benefit obligation (“PBO”) of $246 million. GAAP accounting requires adjustment for changes in values of assets and the PBO only at the end of each year, even though these values change daily. The ultimate underfunded amount at settlement may differ from the current amounts, depending on changes in market factors, including with respect to buyers of pension obligations at the time of settlement.
Prior to the Special Contribution, GAAP pension expense was a reasonable proxy for the Company’s required minimum cash contribution to the pension plan. The Company estimates that, with the Special Contribution, there will be no required minimum cash contributions until final settlement. Pension expense under GAAP is projected to be approximately $14 million in 2023, which is mainly comprised of non-cash amortization of deferred net actuarial losses reflected in the Company’s shareholders’ equity as accumulated other comprehensive losses. Beginning in 2022, and consistent with no expected required minimum cash contributions, no pension expense is included in calculating earnings before interest, taxes, depreciation and amortization as defined in the Company’s revolving Credit Agreement ("Credit EBITDA").
Net capitalization and other credit measures are provided in Liquidity and Capital Resources below.
Liquidity and Capital Resources
The Company continues to focus on improving working capital management. Measures such as days sales outstanding (“DSO”), days inventory outstanding (“DIO”) and days payables outstanding (“DPO”) are used to evaluate changes in working capital. Changes in operating assets and liabilities from December 31, 2022 to June 30, 2023 are summarized below.
•Accounts and other receivables decreased $5.4 million (6.4%).
◦Accounts and other receivables in Aluminum Extrusions decreased $6.8 million primarily due to lower sales volume and the pass-through of lower metal costs. DSO (represents trailing 12 months net sales divided by a rolling 12-month average of accounts and other receivables balances) was approximately 48.9 days for the 12 months ended June 30, 2023 and 48.7 days for the 12 months ended December 31, 2022.
◦Accounts and other receivables in PE Films remained relatively flat. DSO was approximately 28.8 days for the 12 months ended June 30, 2023, which was lower compared to 30.3 days for the 12 months ended December 31, 2022 due to shorter customer repayment terms associated with sales of lower margin product during the second quarter of 2023.
◦Accounts and other receivables in Flexible Packaging Films increased $1.0 million primarily due to sales to customers in 2023 that contain unfavorable terms. DSO was approximately 39.0 days for the 12 months ended June 30, 2023 and 41.1 days for the 12 months ended December 31, 2022.
•Inventories decreased $41.1 million (32.2%).
◦Inventories in Aluminum Extrusions decreased $23.9 million due to decreased raw material levels as a result of slowing order input and order cancellations as customers continue to report high inventory levels. DIO (represents trailing 12 months costs of goods sold calculated on a first-in first-out basis divided by a rolling 12-month average of inventory balances calculated on the first-in first-out basis) was approximately 57.5 days for the 12 months ended June 30, 2023 and 53.6 days for the 12 months ended December 31, 2022.
◦Inventories in PE Films decreased $2.3 million due to lower raw materials and finished goods for overwrap films. DIO was approximately 68.3 days for the 12 months ended June 30, 2023 and 66.8 days for the 12 months ended December 31, 2022.
◦Inventories in Flexible Packaging Films decreased $14.8 million primarily due to lower raw material purchases and lower finished goods levels as a result of lower sales volume. DIO was approximately 122.8 days for the 12 months ended June 30, 2023 and 108.0 days for the 12 months ended December 31, 2022.
•Net property, plant and equipment increased $3.5 million primarily due to capital expenditures of $14.5 million and a $1.7 million favorable change in the value of the U.S. dollar relative to foreign currencies, partially offset by depreciation expense of $12.4 million.
•Identifiable intangible assets, net decreased $0.9 million (7.7%) due to amortization expense.
•Deferred income tax assets increased $0.7 million primarily due to changes in other comprehensive income, increase in net operational losses, and a decrease in the deferred tax liability related to the goodwill impairment. See Note 9 for additional information.
•Accounts payable decreased $32.6 million (28.4%).
◦Accounts payable in Aluminum Extrusions decreased $21.2 million primarily due to lower raw material purchases and favorable vendor terms. DPO (represents trailing 12 months costs of goods sold calculated on a first-in first-out basis divided by a rolling 12-month average of accounts payable balances) was approximately 56.8 days for the 12 months ended June 30, 2023 and 64.2 days for the 12 months ended December 31, 2022.
◦Accounts payable in PE Films remained relatively flat. DPO was approximately 43.9 days for the 12 months ended June 30, 2023 and 51.0 days for the 12 months ended December 31, 2022.
◦Accounts payable in Flexible Packaging Films decreased $11.4 million primarily due to lower raw material purchases. DPO was approximately 64.3 days for the 12 months ended June 30, 2023 and 72.4 days for the 12 months ended December 31, 2022.
Net cash provided by operating activities was $22.7 million in the first six months of 2023 compared to net cash used in operating activities of $9.4 million in the first six months of 2022. The change in operating activities is primarily due to the Special Contribution ($50 million) and improved working capital due to factors discussed earlier in this section relating to accounts and other receivables, inventories and accounts payable.
Net cash used in investing activities was $15.6 million in the first six months of 2023 compared to net cash used in investing activities of $12.1 million the first six months of 2022. The increase was due to higher capital expenditures ($2.4 million), partially offset by cash consideration of $0.3 million received in January 2023 compared to $1.4 million received in the May 2022 related to the customary post-closing adjustments on the sale of the investment in kaléo, which was sold in December 2021.
Net cash used in financing activities was $4.9 million in the first six months of 2023, compared to net cash provided by financing activities of $18.7 million in the first six months of 2022. The change in financing activities was primarily due to
lower net borrowings ($24.5 million) under the Credit Agreement during the first six months of 2023 as compared to the first six months of 2022 when the Company borrowed funds and made a $50 million Special Contribution to the pension plan in February 2022 and lower deferred financing costs ($1.2 million).
The Company believes that existing borrowing availability, current cash balances and cash flow from operations will be sufficient to satisfy short term material cash requirements related to working capital, capital expenditures and debt repayments for at least the next twelve months. In the longer term, liquidity will depend on many factors, including results of operations, the timing and extent of capital expenditures, changes in operating plans or other events that would cause the Company to seek additional financing in future periods.
At June 30, 2023, the Company had cash and cash equivalents of $21.2 million, including cash and cash equivalents held in locations outside the U.S. of $13.9 million.
As of June 30, 2023, Tredegar had a five-year, revolving, secured credit facility that permits aggregate borrowings of $375 million and matures on June 29, 2027.
Net capitalization and indebtedness as defined under the Credit Agreement as of June 30, 2023 were as follows: | | | | | |
| Net Capitalization and Indebtedness as of June 30, 2023 |
| (In thousands) |
| Net capitalization: | |
| Cash and cash equivalents | $ | 21,193 | |
| Debt: | |
| Credit Agreement | 141,000 | |
| Debt, net of cash and cash equivalents | 119,807 | |
| Shareholders’ equity | 183,149 | |
| Net capitalization | $ | 302,956 | |
| Indebtedness as defined in Credit Agreement: | |
| Total debt | $ | 141,000 | |
| Indebtedness | $ | 141,000 | |
Borrowings under the Credit Agreement bear an interest rate equal to SOFR plus a credit spread adjustment of 10 basis points ("Adjusted Term SOFR Rate") and an amount depending on the type of borrowing and commitment fees charged on the unused amount under the Credit Agreement at various Total Net Leverage Ratio levels as follows: | | | | | | | | |
| Pricing Under the Credit Agreement (Basis Points) |
| Total Net Leverage Ratio | Term Benchmark Spread | Commitment
Fee |
| <= 1.0x | 150.0 | | 20 | |
| >1.0x but <=2.0x | 162.5 | | 25 | |
| >2.0x but <=3.0x | 175.0 | | 30 | |
| >3.0x but <=3.5x | 187.5 | | 35 | |
| >3.5x | 200.0 | | 40 | |
At June 30, 2023, $141.0 million of the outstanding debt was principally priced at an interest rate equal to the Adjusted Term SOFR Rate plus the applicable credit spread of 175.0 basis points.
The primary financial restrictive covenants in the Credit Agreement include:
•Total Net Leverage Ratio of 4.00x;
•Interest Coverage Ratio of 3.00x; and
•Unlimited payments for dividends and stock repurchases during the term of the Credit Agreement so long as the Total Net Leverage Ratio is equal to or less than 2.00x, and otherwise restrictions on payments for dividends and stock repurchases for the term of the Credit Agreement at $75 million (provided that the $75 million basket will reset at the end of each fiscal quarter when the Total Net Leverage ratio is less than or equal to 2.00x).
Under the Credit Agreement:
•Total Net Leverage Ratio is defined as the ratio of (a)(i) total indebtedness minus (ii) liquidity (the lesser of $50,000,000 and the aggregate amount of cash and cash equivalents) to (b) Credit EBITDA; and
•Interest Coverage Ratio is defined as the ratio of Credit EBITDA to interest expense.
The Credit Agreement is secured by substantially all of the Company’s and its domestic subsidiaries’ assets, including equity in certain material first-tier foreign subsidiaries. At June 30, 2023, based upon the restrictive covenants within the Credit Agreement, available credit under the Credit Agreement was approximately $33 million. Total debt outstanding was $141.0 million and $137.0 million as of June 30, 2023 and December 31, 2022, respectively.
Credit EBITDA is not intended to represent net income (loss) or cash flow from operations as defined by GAAP and should not be considered as an alternative to either net income (loss) or to cash flow. The computations of Credit EBITDA, the Total Net Leverage Ratio and Interest Coverage Ratio as defined in the Credit Agreement are presented below.
| | | | | |
Computations of Credit EBITDA, Total Net Leverage Ratio and Interest Coverage Ratio (in each case, as Defined in the Credit Agreement) Along with Related Primary Restrictive Covenants as of and for the Twelve Months Ended June 30, 2023 |
Computation of Credit EBITDA for the twelve months ended June 30, 2023 (In Thousands): |
| Net income (loss) | $ | (22,772) | |
| Plus: | |
| After-tax losses related to discontinued operations | — | |
| Total income tax expense for continuing operations | — | |
| Interest expense | 7,656 | |
| Depreciation and amortization expense for continuing operations | 26,894 | |
| All non-cash losses and expenses, plus cash losses and expenses not to exceed $10,000, for continuing operations that are classified as unusual, extraordinary or which are related to plant shutdowns, asset impairments and/or restructurings (cash-related of $6,399) | 22,002 | |
| Charges related to stock option grants and awards accounted for under the fair value-based method | 773 | |
| Losses related to the application of the equity method of accounting | — | |
| Losses related to adjustments in the estimated fair value of assets accounted for under the fair value method of accounting | — | |
| Minus: | |
| After-tax income related to discontinued operations | (27) | |
| Total income tax benefits for continuing operations | (4,945) | |
| Interest income | (99) | |
| All non-cash gains and income, plus cash gains and income in excess of $10,000, for continuing operations that are classified as unusual, extraordinary or which are related to plant shutdowns, asset impairments and/or restructurings | — | |
| Income related to changes in estimates for stock option grants and awards accounted for under the fair value-based method | — | |
| Income related to the application of the equity method of accounting | — | |
| Income related to adjustments in the estimated fair value of assets accounted for under the fair value method of accounting | (262) | |
| Plus cash dividends declared on investments in an amount not to exceed $10,000 for such period | — | |
| Plus or minus, as applicable, pro forma EBITDA adjustments associated with acquisitions and asset dispositions | — | |
| Plus or minus, as applicable, pro forma EBITDA adjustments to pension expense associated with the early payment of pension obligations | 14,264 | |
| Credit EBITDA | $ | 43,484 | |
| Computations of Total Net Leverage Ratio and Interest Coverage Ratio at June 30, 2023: |
| Total Net Leverage Ratio | 2.76x |
| Interest Coverage Ratio | 5.68x |
| Primary restrictive covenants: | |
Unlimited payments for dividends and stock repurchases during the term of the Credit Agreement so long as the Total Net Leverage Ratio is equal to or less than 2.00x, and otherwise restrictions on payments for dividends and stock repurchases for the term of the Credit Agreement at $75 million | $ | 75,000 | |
| Maximum Total Net Leverage Ratio permitted | 4.00x |
| Minimum Interest Coverage Ratio permitted | 3.00x |
The Company had Credit EBITDA and a Total Net Leverage Ratio of $43.5 million and 2.76x, respectively, at June 30, 2023, which had significantly deteriorated from the Credit EBITDA and Total Net Leverage Ratio at December 31, 2022 of $84.4 million and 1.39x, respectively.
Tredegar was in compliance with all of its debt covenants as of June 30, 2023. Noncompliance with any of the debt covenants could have a material adverse effect on its financial condition or liquidity, in the event such noncompliance cannot be cured or should the Company be unable to obtain a waiver from the lenders. Renegotiation of the covenant through an amendment to the Credit Agreement could effectively cure the noncompliance, but could have an effect on its financial condition or liquidity depending upon how the covenant is renegotiated. In addition, the Company’s projections indicate further deterioration of the Total Net Leverage Ratio without paying dividends to between 4.0x and 5.0x through the quarter ending March 31, 2024.
Subsequent to June 30, 2023, the Company amended the Credit Agreement. To reduce the risk of potential violations of the primary financial restrictive covenants in the Credit Agreement while the Company's businesses and markets are experiencing a downturn, the Company (i) suspended its regular quarterly dividend (which had an annual cash outlay of approximately $17.7 million) and (ii) amended the Credit Agreement, effective August 3, 2023, to:
a.Change the fiscal quarter maximum Total Net Leverage Ratio covenant from 4.0x to: (i) 5.0x for the quarters ending September 30, 2023 through March 31, 2024, (ii) 4.75x for the quarter ending June 30, 2024, (iii) 4.25 for the quarter ending September 30, 2024, and (iv) 4.0x for the quarter ending December 31, 2024 and thereafter.
b.Change the fiscal quarter minimum Interest Coverage Ratio covenant from 3.0x to: (i) 2.50x for the quarters ending September 30, 2023 through June 30, 2024, (ii) 2.75x for the quarter ending September 30, 2024, and (iii) 3.0x for the quarter ending December 31, 2024 and thereafter.
c.Reduce the maximum borrowing availability from $375 million to $200 million.
d.Increase the drawn spread by 25 basis points across all levels of the interest rate pricing grid, beginning the quarter ending September 30, 2023.
e.Amend the restricted payments covenant to prohibit dividends and share repurchases during fiscal quarters ending September 30, 2023 through December 31, 2024.
To further decrease the risk of a debt covenant violation during a severe cyclical downturn, the Company is investigating the replacement of the existing EBITDA-based credit facility by the end of 2023 with other financing alternatives, including borrowings that would be permitted based on the level of secured receivables, inventories and machinery and equipment and sale and leaseback of existing Company-owned property.
Item 3. Quantitative and Qualitative Disclosures About Market Risk.
Tredegar has exposure to the volatility of interest rates, polyethylene and polypropylene resin prices, Terephthalic Acid (“PTA”) and Monoethylene Glycol (“MEG”) prices, aluminum ingot and scrap prices, energy prices, foreign currencies and emerging markets. See Liquidity and Capital Resources above regarding interest rate exposures related to borrowings under the Credit Agreement.
Profit margins in Aluminum Extrusions are sensitive to fluctuations in aluminum ingot and scrap prices as well as natural gas prices (natural gas is the principal energy source used to operate its casting furnaces). Changes in polyethylene resin prices and the timing of those changes could have a significant impact on profit margins in PE Films. Changes in polyester resin, PTA and MEG prices, and the timing of those changes, could have a significant impact on profit margins in Flexible Packaging Films. There is no assurance of the Company’s ability to pass through higher raw material and energy costs to its customers.
In the normal course of business, Aluminum Extrusions enters into fixed-price forward sales contracts with certain customers for the sale of fixed quantities of aluminum extrusions at scheduled intervals. In order to hedge its exposure to aluminum price volatility (see the chart below) under these fixed-price arrangements, which generally have a duration of not more than 12 months, the Company enters into a combination of forward purchase commitments and futures contracts to acquire or hedge aluminum, based on the scheduled deliveries. See Note 8 for additional information.
The volatility of quarterly average aluminum prices is shown in the chart below.
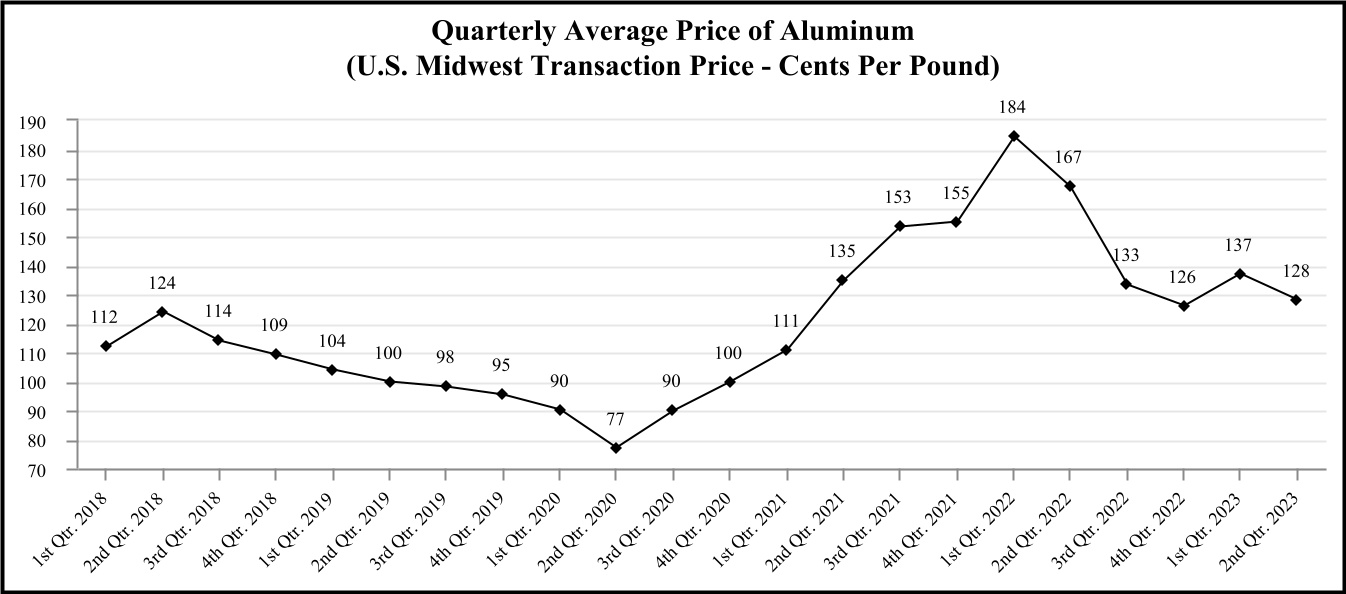
| | |
| Source: Quarterly averages computed by the Company using daily Midwest average prices provided by Platts. |
The volatility of quarterly average natural gas prices is shown in the chart below.
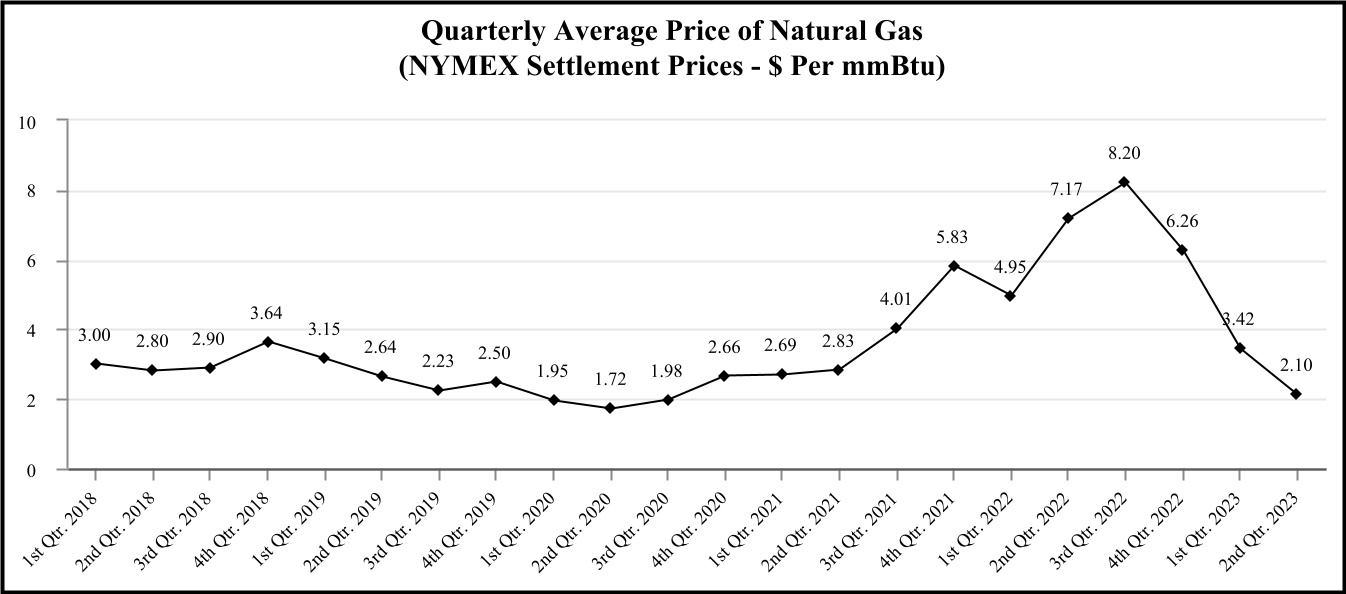
| | |
| Source: Quarterly averages computed by Tredegar using monthly NYMEX settlement prices. |
The volatility of average quarterly prices of polyethylene resin in the U.S. (a primary raw material for PE Films) is shown in the chart below.
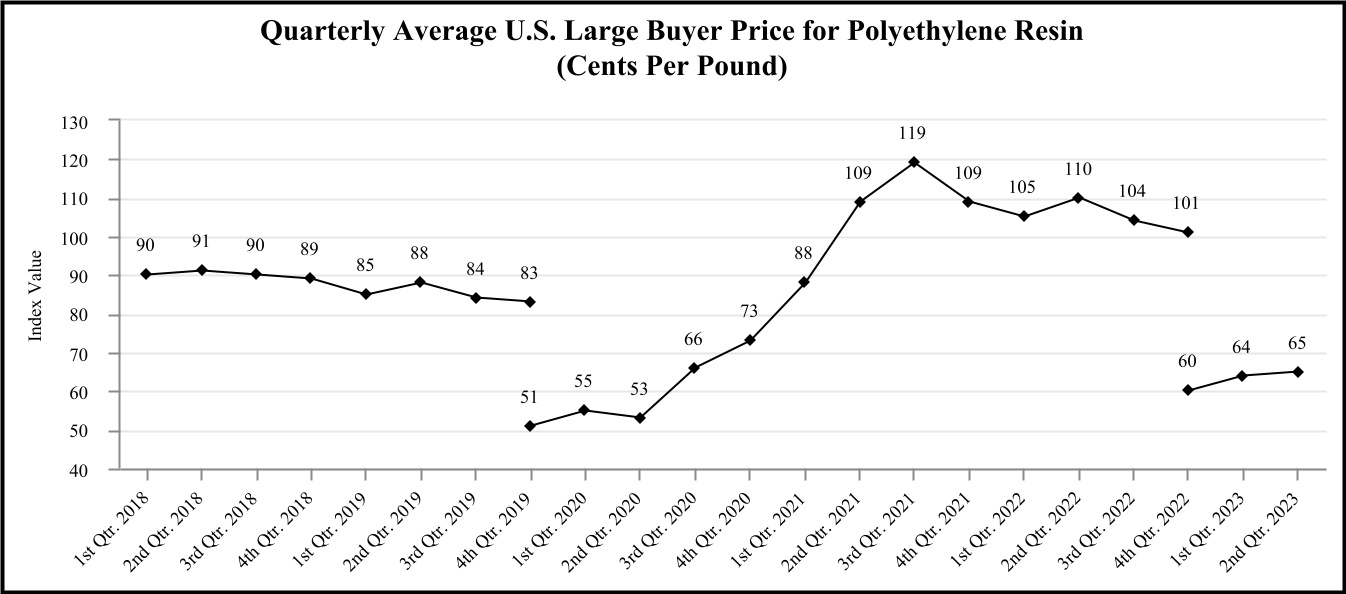
| | |
Source: Quarterly averages computed by Tredegar using monthly data provided by IHS, Inc. In February 2020, IHS reflected a 32 cents per pound non-market adjustment based on their estimate of the growth of discounts in prior periods. The 4th quarter 2019 average rate of $0.51 per pound is shown on a pro forma basis as if the non-market adjustment was made in the fourth quarter of 2019. In January 2023, IHS reflected a 41 cents per pound non-market adjustment based on their estimate of the growth of discounts in the prior periods. The 4th quarter 2022 average rate of $0.60 per pound is shown on a pro forma basis as if the non-market adjustment was made in the fourth quarter of 2022. |
The price of resin is driven by several factors, including supply and demand and the price of oil, ethylene and natural gas. Selling prices to customers are set considering numerous factors, including the expected volatility of resin prices. PE Films has index-based pass-through raw material cost arrangements with customers. However, under certain agreements, changes in resin prices are not passed through for a period of 90 days. In response to unprecedented cost increases and supply issues for polyethylene and polypropylene resin, Tredegar Surface Protection implemented a quarterly resin cost pass-through mechanism, effective July 1, 2021, for all products and customers not previously covered by such arrangements. Pricing on the remainder of the business is based upon raw material costs and supply/demand dynamics within the markets that the Company competes.
Polyester resins, MEG and PTA used in flexible packaging films produced in Brazil are primarily purchased domestically, with other sources available mostly from Asia and the U.S. Given the nature of these products as commodities, pricing is derived from Asian pricing indexes. The volatility of the average quarterly prices for polyester fibers in Asia, which is representative of polyester resin (a primary raw material for Flexible Packaging Films) pricing trends, is shown in the chart below:
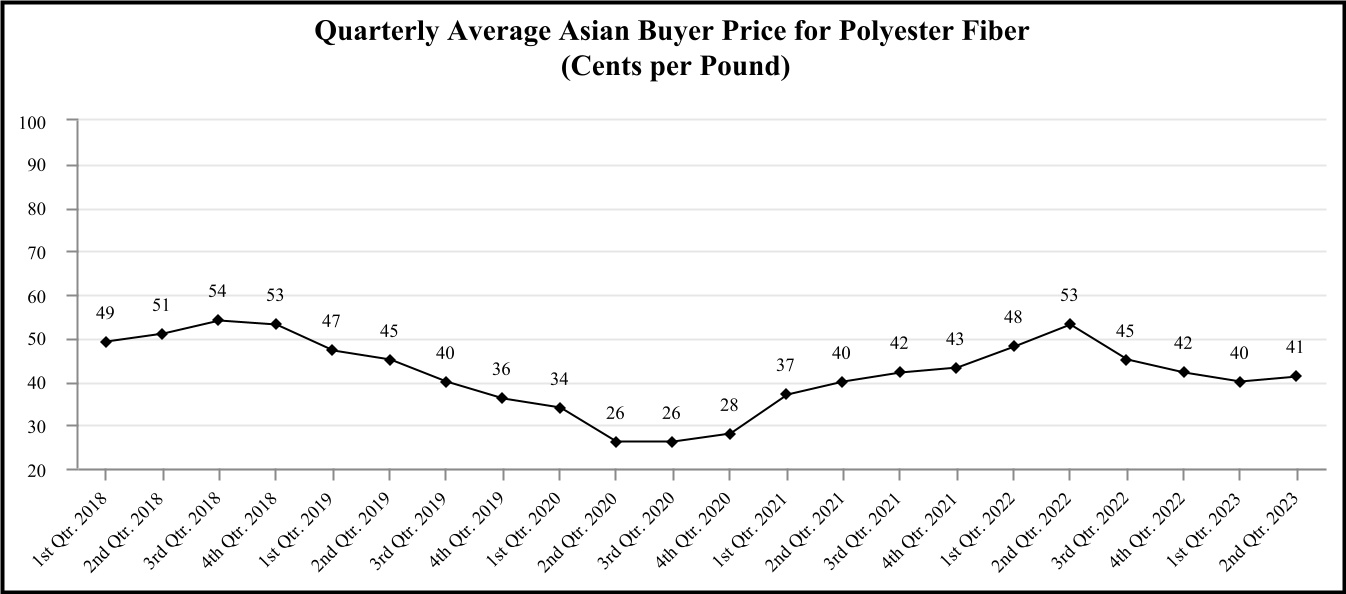
| | |
Source: Quarterly averages computed by Tredegar using monthly data from CMAI Global Index data.
|
The volatility of average quarterly prices of PTA and MEG in Asia (raw materials used in the production of polyester resins produced by Flexible Packaging Films) is shown in the chart below:
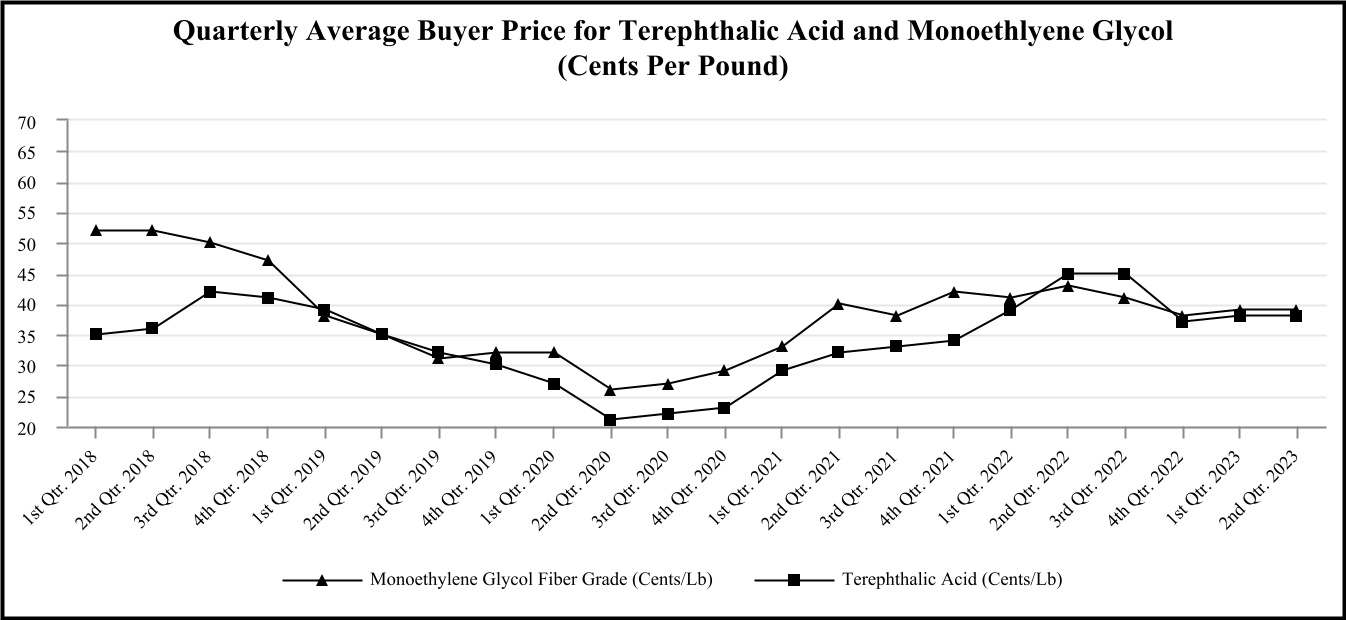
| | |
| Source: Quarterly averages computed by Tredegar using monthly data from CMAI Global Index data. |
Tredegar attempts to match the pricing and cost of its products in the same currency and generally views the volatility of foreign currencies and the corresponding impact on earnings and cash flow as part of the overall risk of operating in a global environment (for additional information, see trends for the Brazilian Real and Chinese Yuan in the charts on the following page). Exports from the U.S. are generally denominated in U.S. Dollars. The Company’s foreign currency exposure on income from foreign operations relates to the Chinese Yuan and the Brazilian Real.
PE Films is generally able to match the currency of its sales and costs for its product lines. For flexible packaging films produced in Brazil, selling prices and key raw material costs are principally determined in U.S. Dollars and are impacted by local economic conditions and local and global competitive dynamics. Flexible Packaging Films is exposed to foreign
exchange translation risk (its functional currency is the Brazilian Real) because almost 90% of the sales of Flexible Packaging Films business unit in Brazil (“Terphane Ltda.”) and substantially all of its related raw material costs are quoted or priced in U.S. Dollars while its variable conversion, fixed conversion and sales, general and administrative costs before depreciation & amortization (collectively “Terphane Ltda. Operating Costs”) are quoted or priced in Brazilian Real. This mismatch, together with a variety of economic variables impacting currency exchange rates, causes volatility that could negatively or positively impact EBITDA from ongoing operations for Flexible Packaging Films.
The Company estimates annual net costs of R$177 million for the net mismatch translation exposure between Terphane Ltda.’s U.S. Dollar quoted or priced sales and raw material costs and underlying Brazilian Real quoted or priced Terphane Ltda. Operating Costs. Terphane Ltda. has outstanding foreign exchange average forward rate contracts to purchase Brazilian Real and sell U.S. Dollars to hedge its exposure. See Note 8 for more information on outstanding hedging contracts and this hedging program.
Tredegar estimates that the change in the value of foreign currencies relative to the U.S. Dollar for PE Films had no impact on EBITDA from ongoing operations for the second quarter of 2023 and an unfavorable impact on EBITDA from ongoing operations of $0.1 million in the first half of 2023 compared with the same periods of 2022.
Trends for the Brazilian Real and Chinese Yuan exchange rates relative to the U.S. Dollar are shown in the chart below.
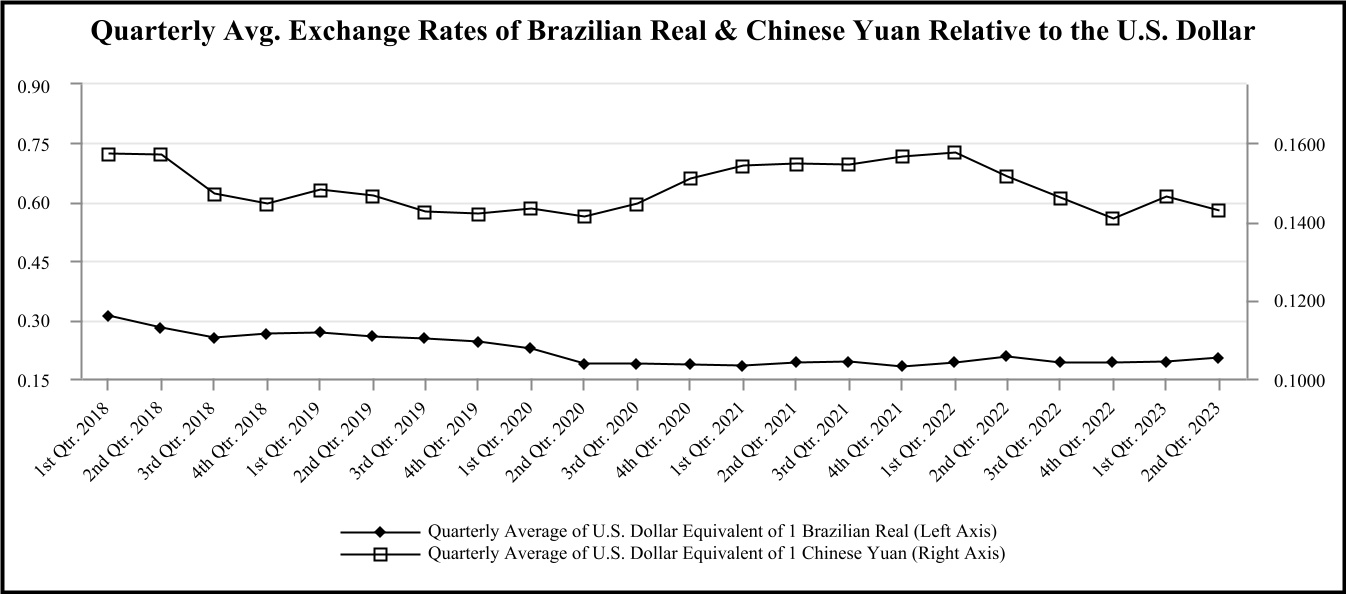
| | |
Source: Quarterly averages computed by Tredegar using daily closing data provided by Bloomberg.
|
Item 4. Controls and Procedures.
On November 1, 2018, the Company filed a Current Report on Form 8-K (the “November 2018 Form 8-K”) to disclose certain material weaknesses in internal control over financial reporting. For further information, see the November 2018 Form 8-K and Item 4. “Controls and Procedures” of the Company’s Quarterly Report on Form 10-Q for the quarterly period ended September 30, 2018.
As of December 31, 2022, the results of management’s testing of the design, implementation and operating effectiveness of controls identified that the Company continued to have material weaknesses in its internal control over financial reporting; however, the material weaknesses existing as of December 31, 2022 were limited to certain discrete items within the previously identified material weaknesses. As a result, management revised its original six step remediation plan that was designed with the assistance of management’s outside consultant, an internationally recognized accounting firm. As of June 30, 2023, the Company continues to execute its revised remediation plan, including the implementation of the new and revised internal controls over financial reporting.
Evaluation of Disclosure Controls and Procedures
In connection with the preparation of this Form 10-Q, pursuant to Rule 13a-15(b) under the Securities Exchange Act of 1934, as amended (the “Exchange Act”), the Company carried out an evaluation with the participation of its management, including its Chief Executive Officer (principal executive officer) and Chief Financial Officer (principal financial officer), of the effectiveness of the design and operation of the Company’s disclosure controls and procedures (as defined under Rule 13a-15(e) and 15d-15(e) under the Exchange Act) as of June 30, 2023.
Based on this evaluation, the Company’s Chief Executive Officer and Chief Financial Officer concluded that, because of the material weaknesses in internal control over financial reporting discussed below, the Company’s disclosure controls and procedures were not effective as of June 30, 2023, to ensure: (i) that information required to be disclosed by the Company in the reports that it files or submits under the Exchange Act, is recorded, processed, summarized and reported, within the time periods specified in the SEC’s rules and forms, and (ii) that such information is accumulated and communicated to management, including the Chief Executive Officer and Chief Financial Officer, as appropriate, to allow timely decisions regarding required disclosure.
Management’s Report on Internal Control Over Financial Reporting
The Company’s management is responsible for establishing and maintaining adequate internal control over financial reporting, as such term is defined in Rules 13a-15(f) and 15d-15(f) under the Exchange Act. The Company’s internal control over financial reporting is a process designed by or under the supervision of the Company’s Chief Executive Officer and Chief Financial Officer, and overseen by the Board of Directors, to provide reasonable assurance regarding the reliability of financial reporting and the preparation of financial statements for external purposes in accordance with GAAP and includes policies and procedures that:
a.Pertain to the maintenance of records that, in reasonable detail, accurately and fairly reflect the transactions and dispositions of the Company’s assets;
b.Provide reasonable assurance that transactions are recorded as necessary to permit preparation of financial statements in accordance with GAAP, and that the Company’s receipts and expenditures are being made only in accordance with the authorization of its management and directors; and
c.Provide reasonable assurance regarding prevention or timely detection of unauthorized acquisition, use or disposition of the Company’s assets that could have a material effect on the financial statements.
Because of its inherent limitations, internal control over financial reporting is not intended to provide absolute assurance that a misstatement of the Company’s consolidated financial statements would be prevented or detected. Also, projections of any evaluation of effectiveness to future periods are subject to the risk that controls may become inadequate because of changes in conditions, or that the degree of compliance with the policies or procedures may deteriorate.
A material weakness is a deficiency, or combination of deficiencies, in internal control over financial reporting, such that there is a reasonable possibility that a material misstatement of the annual or interim financial statements will not be prevented or detected on a timely basis.
Management conducted an evaluation of the effectiveness of the Company’s internal control over financial reporting using the criteria in Internal Control - Integrated Framework 2013 issued by the Committee of Sponsoring Organizations of the Treadway Commission (the “2013 COSO Framework”). Based on management’s assessment, the Company’s Chief Executive Officer and Chief Financial Officer concluded that the Company did not maintain effective internal control over financial reporting as of December 31, 2022. The Company did not sufficiently attract, develop, and retain competent resources to fulfill internal control responsibilities and did not have an effective information and communication process that identified and assessed the source of and controls necessary to ensure the reliability of information used in financial reporting. As a consequence of these material weaknesses, the Company did not effectively design, implement and operate process-level controls across its financial reporting processes.
While these material weaknesses did not result in material misstatements of the Company’s consolidated financial statements as of and for the year ended December 31, 2022, these material weaknesses create a reasonable possibility that a material misstatement of account balances or disclosures in annual or interim consolidated financial statements may not be prevented or detected in a timely manner. Accordingly, the Company concluded that the deficiencies represent material weaknesses in its internal control over financial reporting and its internal control over financial reporting was not effective as of December 31, 2022.
The Company’s independent registered public accounting firm, KPMG LLP, which audited the 2022 consolidated financial statements included in the 2022 Form 10-K, expressed an adverse opinion on the operating effectiveness of the Company's internal control over financial reporting.
Remediation Plan and Efforts to Address the Identified Material Weaknesses
To remediate the material weaknesses described above, the Company, with the oversight of the Audit Committee of the Board of Directors (the “Audit Committee”), has been pursuing the revised remediation plan to implement new and revised internal controls over financial reporting.
Through the second quarter of 2023, the Company has completed certain steps in its revised remediation plan, including:
a.Conducted interviews with relevant parties and confirmed management’s understanding of the internal control activities, including information used in the recording of transactions within the Company's financial reporting processes;
b.Completed a comprehensive review and update to the documentation of relevant processes with respect to the Company’s internal control over financial reporting;
c.Developed internal control remediation plans to enhance controls for deficiencies associated with the material weaknesses above, including an assessment of personnel skills and experience related to the design and operation of internal control activities;
d.Substantially implemented all new and revised internal controls to address the previously identified deficiencies associated with the material weaknesses above;
e.Expanded the internal control compliance department with personnel that have appropriate internal control experience and identified resources for positions relevant to internal controls that had previously experienced turnover; and
f.Executed a targeted training program to educate control owners on the requirements of internal control activities, including maintaining adequate documentary evidence for internal control activities.
The design and implementation of certain new and revised internal controls associated with expenditure and revenue processes for one remaining manufacturing location of the Aluminum Extrusion business is scheduled for completion in the third quarter of 2023.
The material weaknesses cannot be considered remediated until the applicable controls have operated for a sufficient period of time and management has concluded, through testing, that these controls are operating effectively. The Company is committed to the improvement of its internal control over financial reporting and management continues to work with its outside consultant to assist in those efforts, as necessary. The Company continues to monitor the impact of employee turnover and other external factors on its remediation plan and its assessment of internal control over financial reporting. The Company cannot assure you when it will remediate the identified material weaknesses, nor can it be certain whether additional actions will be required. Moreover, the Company cannot assure you that additional material weaknesses will not arise in the future.
Changes in Internal Control Over Financial Reporting
The Company is in the process of implementing certain changes in its internal controls to remediate the material weaknesses described above. Except as noted above, there has been no change in the Company’s internal control over financial reporting during the quarter ended June 30, 2023, that has materially affected, or is reasonably likely to materially affect, its internal control over financial reporting (as defined in Rules 13a-15(f) and 15d-15(f) under the Exchange Act).
PART II - OTHER INFORMATION
Item 1A. Risk Factors.
As disclosed in “Item 1A. Risk Factors” in the 2022 Form 10-K, there are a number of risks and uncertainties that can have a material effect on the operating results of our businesses and our financial condition. Except as set forth below, there are no material updates or changes to our risk factors previously disclosed in the 2022 Form 10-K.
Further impairment of the Surface Protection reporting unit’s goodwill could have a material non-cash adverse impact on our results of operations. The Company assesses goodwill for impairment when events or circumstances indicate that the carrying value may not be recoverable, or, at a minimum, on an annual basis (December 1st of each year). The valuation of goodwill depends on a variety of factors, including macroeconomic conditions, industry and market considerations, cost factors and overall financial performance, as well as Company and reporting unit factors, and goodwill impairment valuations can be sensitive to assumptions associated with such factors. Failure to successfully achieve projections could result in future impairments.
Manufacturers in the supply chain for consumer electronics continue to experience reduced capacity utilization and inventory corrections. In light of the continued uncertainty about the timing of a recovery for this market and the expected adverse future impact to the Surface Protection business, as of June 30, 2023 the Company performed a goodwill impairment analysis of the Surface Protection component of PE Films using projections that contemplate the expected market recovery and business conditions. The analysis concluded that the fair value of Surface Protection was less than its carrying value, thus a non-cash partial goodwill impairment of $15.4 million ($11.9 million after deferred income tax benefits) was recognized during the second quarter of 2023.
Further impairment to the Surface Protection reporting unit’s goodwill may be caused by factors outside the Company’s control, such as increasing competitive pricing pressures, continued weak consumer electronic market demand, lower than expected sales and profit growth rates, and various other factors. Significant and unanticipated changes could require an
additional non-cash charge for impairment in a future period, which may significantly affect the Company’s results of operations in the period of such charge.
Item 2. Unregistered Sales of Equity Securities and Use of Proceeds.
The Company’s Credit Agreement contains financial and other restrictive covenants, including a restriction on the Company’s ability to pay dividends to shareholders. For more information on the Credit Agreement, see “Item 2. Management’s Discussion and Analysis of Financial Condition and Results of Operations - Liquidity and Capital Resources.”
Item 5. Other Information.
Director and Officer Trading Arrangements
During the three months ended June 30, 2023, no director or officer of the Company adopted, terminated or modified a "Rule 10b5-1 trading arrangement" or "non-Rule 10b5-1 trading arrangement," as each term is defined in Item 408(a) of Regulation S-K.
Entry into a Material Definitive Agreement
On August 3, 2023, the Company, as borrower, entered into Amendment No. 2 (the “Second Amendment”) to the Second Amended and Restated Credit Agreement with the lenders named therein, JPMorgan Chase Bank, N.A., as administrative agent, Citizens Bank, N.A. and PNC Bank, National Association, as co-syndication agents, and Bank of America, N.A., U.S. Bank National Association and Wells Fargo Bank, National Association, as co-documentation agents, and the other lenders party thereto (collectively, the “Lenders”).
The following sets forth a description of the material terms of the Second Amendment:
a.Changed the fiscal quarter maximum Total Net Leverage Ratio covenant from 4.0x to: (i) 5.0x for the quarters ending September 30, 2023 through March 31, 2024, (ii) 4.75x for the quarter ending June 30, 2024, (iii) 4.25 for the quarter ending September 30, 2024, and (iv) 4.0x for the quarter ending December 31, 2024 and thereafter.
b.Changed the fiscal quarter minimum Interest Coverage Ratio covenant from 3.0x to: (i) 2.50x for the quarters ending September 30, 2023 through June 30, 2024, (ii) 2.75x for the quarter ending September 30, 2024, and (iii) 3.0x for the quarter ending December 31, 2024 and thereafter.
c.Reduced the maximum borrowing availability from $375 million to $200 million.
d.Increased the drawn spread by 25 basis points across all levels of the interest rate pricing grid, beginning the quarter ending September 30, 2023.
e.Amended the restricted payments covenant to prohibit dividends and share repurchases during fiscal quarters ending September 30, 2023 through December 31, 2024.
The Company and its affiliates regularly engage the Lenders to provide other banking services. All of these engagements are negotiated at arm’s length.
The foregoing description of the Second Amendment is not complete and is qualified in its entirety by reference to the entire Second Amendment, a copy of which is attached hereto as Exhibit 10.1 and incorporated herein by reference.
Closure of PE Films Technical Center
On August 3, 2023, the Company adopted a plan to close the PE Films technical center in Richmond, VA and reduce its efforts to develop and sell films supporting the semiconductor market. Future research & development activities for PE Films will be performed at the facility in Pottsville, PA. PE Films continues to have new business opportunities primarily relating to surface protection films that protect components of flat panel and flexible displays. The Company anticipates all activities to cease at the PE Films technical center in Richmond, VA, by the end of 2023. The Company expects to recognize cash costs associated with exit activities of $1.8 million for: (i) severance and related costs ($0.9 million), (ii) vacating the facility lease ($0.6 million payable through June 2025), and (iii) building closure costs ($0.3 million). In addition, the Company expects non-cash asset write-offs and accelerated depreciation of up to $4.5 million. Net annual cash savings of $3.4 million are anticipated, beginning in the fourth quarter of 2023.
Item 6. Exhibits. | | | | | | | | |
| 10.1 | | Amendment No. 1 to Second Amended and Restated Credit Agreement, dated as of November 29, 2022, among Tredegar Corporation, as borrower, the lenders named therein, JPMorgan Chase Bank, N.A., as administrative agent, Citizens Bank, N.A. and PNC Bank, National Association, as co-syndication agents, and Bank of America, N.A., U.S. Bank National Association and Wells Fargo Bank, National Association, as co-documentation agents, and the other lenders party thereto. |
| 10.2 | | Amendment No. 2 to Second Amended and Restated Credit Agreement, dated as of August 3, 2023, among Tredegar Corporation, as borrower, the lenders named therein, JPMorgan Chase Bank, N.A., as administrative agent, Citizens Bank, N.A. and PNC Bank, National Association, as co-syndication agents, and Bank of America, N.A., U.S. Bank National Association and Wells Fargo Bank, National Association, as co-documentation agents, and the other lenders party thereto. |
| 31.1 | | |
| 31.2 | | |
| 32.1 | | |
| 32.2 | | |
| 101 | | XBRL Instance Document and Related Items. |
| 104 | | Cover Page Interactive Data File (formatted in iXBRL and contained in Exhibit 101). |
SIGNATURES
Pursuant to the requirements of the Securities Exchange Act of 1934, the Registrant has duly caused this report to be signed on its behalf by the undersigned thereunto duly authorized. | | | | | | | | | | | | | | |
| | | | Tredegar Corporation |
| | | | (Registrant) |
| | |
| Date: | | August 9, 2023 | | /s/ John M. Steitz |
| | | | John M. Steitz |
| | | | President and Chief Executive Officer |
| | | | (Principal Executive Officer) |
| | | | |
| Date: | | August 9, 2023 | | /s/ D. Andrew Edwards |
| | | | D. Andrew Edwards |
| | | | Executive Vice President and Chief Financial Officer |
| | | | (Principal Financial Officer) |
| | | | |
| Date: | | August 9, 2023 | | /s/ Frasier W. Brickhouse, II |
| | | | Frasier W. Brickhouse, II |
| | | | Corporate Treasurer and Controller |
| | | | (Principal Accounting Officer) |
AMENDMENT NO. 1
Dated as of November 29, 2022
to
SECOND AMENDED AND RESTATED CREDIT AGREEMENT
Dated as of June 29, 2022
THIS AMENDMENT NO. 1 (this “Amendment”) is made as of November 29, 2022 by and among TREDEGAR CORPORATION, a Virginia corporation (the “Borrower”), the financial institutions listed on the signature pages hereof and JPMORGAN CHASE BANK, N.A., as Administrative Agent (the “Administrative Agent’), under that certain Second Amended and Restated Credit Agreement dated as of June 29, 2022 by and among the Borrower, the Lenders and the Administrative Agent (as amended, restated, supplemented or otherwise modified from time to time, the “Credit Agreement”). Capitalized terms used herein and not otherwise defined herein shall have the respective meanings given to them in the Credit Agreement.
WHEREAS, the Borrower has requested that the requisite Lenders and the Administrative Agent agree to make certain amendments to the Credit Agreement;
WHEREAS, the Borrower, the Lenders party hereto and the Administrative Agent have so agreed on the terms and conditions set forth herein;
NOW, THEREFORE, in consideration of the premises set forth above, the terms and conditions contained herein, and other good and valuable consideration, the receipt and sufficiency of which are hereby acknowledged, the Borrower, the Lenders party hereto and the Administrative Agent hereby agree to enter into this Amendment.
1.Amendment to the Credit Agreement. The parties hereto agree that, effective as of the date of satisfaction of the conditions precedent set forth in Section 2 below, the Credit Agreement is hereby amended as follows (the Credit Agreement as so amended, the “Amended Credit Agreement”):
a.Section 1.01 of the Credit Agreement is hereby amended to add the below language to the end of the definition of “Consolidated EBITDA” appearing therein:
“Notwithstanding the manner in which operations are classified under GAAP, no operations will be classified as discontinued due to the fact that they are subject to an agreement to dispose of such operations, and with respect to any calculation or determination for any period under Consolidated EBITDA, such operations will only be classified as discontinued when and to the extent such operations are actually disposed of.”
2.Conditions of Effectiveness. The effectiveness of this Amendment is subject to the satisfaction of the following conditions precedent:
a.The Administrative Agent (or its counsel) shall have received counterparts of (i) this Amendment duly executed by the Borrower, the Required Lenders and the Administrative Agent and (ii) the Consent and Reaffirmation attached hereto duly executed by the Subsidiary Guarantors.
b.The Administrative Agent shall have received payment of the Administrative Agent’s and its affiliates’ fees and reasonable and documented out-of-pocket expenses (including reasonable fees, charges and expenses of counsel for the Administrative Agent) in connection with this Amendment and the other Loan Documents to the extent provided for in Section 9.03 of the Amended Credit Agreement.
3.Representations and Warranties of the Borrower. The Borrower hereby represents and warrants as follows:
a.This Amendment and the Amended Credit Agreement have been duly authorized by all requisite organizational action and, if required, stockholder action, and this Amendment has been duly executed and delivered by the Borrower.
b.This Amendment and the Amended Credit Agreement constitute legal, valid and binding obligations of the Borrower, enforceable against the Borrower in accordance with its terms, except as enforceability may be limited by bankruptcy, insolvency or similar laws affecting the enforcement of creditor’s rights generally.
c.As of the date hereof and after giving effect to the terms of this Amendment, (i) no Default has occurred and is continuing and (ii) the representations and warranties of the Borrower set forth in the Amended Credit Agreement are true and correct in all material respects (or, in the case of any representation or warranty qualified by materiality or Material Adverse Effect, in all respects), except to the extent that such representations and warranties specifically refer to an earlier date, in which case they shall be true and correct
in all material respects (or, in the case of any representation or warranty qualified by materiality or Material Adverse Effect, in all respects) as of such earlier date.
4.Reference to and Effect on the Credit Agreement.
a.Upon the effectiveness hereof, each reference to the Credit Agreement in the Credit Agreement or any other Loan Document shall mean and be a reference to the Amended Credit Agreement.
b.Each Loan Document and all other documents, instruments and agreements executed and/or delivered in connection therewith shall remain in full force and effect and are hereby ratified and confirmed.
c.The execution, delivery and effectiveness of this Amendment shall not operate as a waiver of any right, power or remedy of the Administrative Agent or the Lenders, nor constitute a waiver of any provision of the Credit Agreement, the other Loan Documents or any other documents, instruments and agreements executed and/or delivered in connection therewith.
d.This Amendment is a Loan Document.
5.Governing Law. This Amendment shall be construed in accordance with and governed by the law of the State of New York.
6.Headings. Section headings used herein are for convenience of reference only, are not part of this Amendment and shall not affect the construction of, or be taken into consideration in interpreting, this Amendment.
7.Counterparts. This Amendment may be executed in counterparts (and by different parties hereto on different counterparts), each of which shall constitute an original, but all of which when taken together shall constitute a single contract. The words “execution,” “signed,” “signature,” “delivery,” and words of like import in or relating to this Amendment and/or any document to be signed in connection with this Amendment and the transactions contemplated hereby shall be deemed to include Electronic Signatures (as defined below), deliveries or the keeping of records in electronic form, each of which shall be of the same legal effect, validity or enforceability as a manually executed signature, physical delivery thereof or the use of a paper-based recordkeeping system, as the case may be. As used herein, “Electronic Signatures” means any electronic symbol or process attached to, or associated with, any contract or other record and adopted by a person with the intent to sign, authenticate or accept such contract or record.
[Signature Pages Follow]
IN WITNESS WHEREOF, this Amendment has been duly executed as of the day and year first above written.
TREDEGAR CORPORATION,
as the Borrower
By: /s/ Kevin C. Donnelly
Name: Kevin C. Donnelly
Title: Vice President and Secretary
JPMORGAN CHASE BANK, N.A.,
individually as a Lender and as Administrative Agent
By: /s/James Knight
Name: James Knight
Title: Executive Director
CITIZENS BANK, N.A.,
as a Lender
By: /s/A. Paul Dawley
Name: A. Paul Dawley
Title: Senior Vic President
PNC BANK, NATIONAL ASSOCIATION,
as a Lender
By: /s/ David Notaro
Name: David Notaro
Title: Senior Vice President
U.S. BANK NATIONAL ASSOCIATION,
as a Lender
By: /s/ Michael H Troutman
Name: Michael H Troutman
Title: Senior Vice President, Commercial Banking
BANK OF AMERICA, N.A.,
as a Lender
By: /s/ Nancy A. Old
Name: Nancy A. Old
Title: SVP
WELLS FARGO BANK, NATIONAL ASSOCIATION,
as a Lender
By: /s/ Timothy Favinger
Name: Timothy Favinger
Title: Director
CITIBANK, N.A.,
as a Lender
By: /s/Andrew Stella
Name: Andrew Stella
Title: Vice President
FIRST HORIZON BANK,
as a Lender
By: /s/Todd Warrick
Name: Todd Warrick
Title: EVP
THE HUNTINGTON NATIONAL BANK,
as a Lender
By: /s/ Greg Ryan
Name: Greg Ryan
Title: Managing Director
CONSENT AND REAFFIRMATION
Each of the undersigned hereby acknowledges receipt of a copy of the foregoing Amendment No. 1 to the Second Amended and Restated Credit Agreement dated as of June 29, 2022 (as amended, restated, supplemented or otherwise modified, the “Credit Agreement”) by and among Tredegar Corporation, a Virginia corporation, the financial institutions from time to time party thereto (the “Lenders”) and JPMorgan Chase Bank, N.A., as Administrative Agent (the “Administrative Agent”), which Amendment No. 1 is dated as of November 29, 2022 (the “Amendment”). Capitalized terms used in this Consent and Reaffirmation and not defined herein shall have the meanings given to them in the Credit Agreement. Without in any way establishing a course of dealing by the Administrative Agent or any Lender, each of the undersigned consents to the Amendment and reaffirms the terms and conditions of the Credit Agreement and any other Loan Document executed by it and acknowledges and agrees that such Credit Agreement and each and every such Loan Document executed by the undersigned in connection with the Credit Agreement remains in full force and effect and is hereby reaffirmed, ratified and confirmed. All references to the Credit Agreement contained in the above‑referenced documents shall be a reference to the Credit Agreement as so modified by the Amendment.
Dated: November 29, 2022
[Signature Page Follows]
IN WITNESS WHEREOF, this Consent and Reaffirmation has been duly executed as of the day and year first above written.
TREDEGAR PERFORMANCE FILMS INC.
By: /s/ Kevin C. Donnelly
Name: Kevin C. Donnelly
Title: Vice President and Secretary
TERPHANE HOLDINGS LLC
By: /s/ Kevin C. Donnelly
Name: Kevin C. Donnelly
Title: Vice President and Secretary
BONNELL ALUMINUM, INC.
By: /s/ Kevin C. Donnelly
Name: Kevin C. Donnelly
Title: Vice President and Secretary
BONNELL ALUMINUM (NILES), LLC
By: /s/ Kevin C. Donnelly
Name: Kevin C. Donnelly
Title: Vice President and Secretary
BONNELL ALUMINUM (CORPORATE), INC.
By: /s/ Kevin C. Donnelly
Name: Kevin C. Donnelly
Title: Vice President and Secretary
BONNELL ALUMINUM (CLEARFIELD), INC.
By: /s/ Kevin C. Donnelly
Name: Kevin C. Donnelly
Title: Vice President and Secretary
TREDEGAR SURFACE PROTECTION, LLC
By: /s/ Kevin C. Donnelly
Name: Kevin C. Donnelly
Title: Vice President and Secretary
TREDEGAR FAR EAST CORPORATION
By: /s/ Kevin C. Donnelly
Name: Kevin C. Donnelly
Title: Vice President and Secretary
TREDEGAR FILM PRODUCTS (LATIN AMERICA), INC.
By: /s/ Kevin C. Donnelly
Name: Kevin C. Donnelly
Title: Vice President and Secretary
TAC HOLDINGS, LLC
By: /s/ Kevin C. Donnelly
Name: Kevin C. Donnelly
Title: Vice President and Secretary
BONNELL ALUMINUM (ELKHART), INC.
By: /s/ Kevin C. Donnelly
Name: Kevin C. Donnelly
Title: Vice President and Secretary
AMENDMENT NO. 2
Dated as of August 3, 2023
to
SECOND AMENDED AND RESTATED CREDIT AGREEMENT
Dated as of June 29, 2022
THIS AMENDMENT NO. 2 (this “Amendment”) is made as of August 3, 2023 by and among TREDEGAR CORPORATION, a Virginia corporation (the “Borrower”), the financial institutions listed on the signature pages hereof and JPMORGAN CHASE BANK, N.A., as Administrative Agent (the “Administrative Agent’), under that certain Second Amended and Restated Credit Agreement dated as of June 29, 2022 by and among the Borrower, the Lenders and the Administrative Agent (as amended, restated, supplemented or otherwise modified from time to time, the “Credit Agreement”). Capitalized terms used herein and not otherwise defined herein shall have the respective meanings given to them in the Credit Agreement.
WHEREAS, the Borrower has requested that the requisite Lenders and the Administrative Agent agree to make certain amendments to the Credit Agreement; and
WHEREAS, the Borrower, the Lenders party hereto and the Administrative Agent have so agreed on the terms and conditions set forth herein.
NOW, THEREFORE, in consideration of the premises set forth above, the terms and conditions contained herein, and other good and valuable consideration, the receipt and sufficiency of which are hereby acknowledged, the Borrower, the Lenders party hereto and the Administrative Agent hereby agree to enter into this Amendment.
1.Amendment to the Credit Agreement. The parties hereto agree that, effective as of the date of satisfaction of the conditions precedent set forth in Section 2 below, the Credit Agreement (including Schedule 2.01A thereto, but excluding all other Exhibits and Schedules thereto) is hereby amended to delete the stricken text (indicated textually in the same manner as the following example: stricken text) and to add the double-underlined text (indicated textually in the same manner as the following example: double-underlined text) as set forth in the pages of the Credit Agreement (including Schedule 2.01A thereto, but excluding all other Exhibits and Schedules thereto) attached as Annex A hereto (the Credit Agreement as so amended, the “Amended Credit Agreement”).
2.Conditions of Effectiveness. The effectiveness of this Amendment is subject to the satisfaction of the following conditions precedent:
a.The Administrative Agent (or its counsel) shall have received counterparts of (i) this Amendment duly executed by the Borrower, the Required Lenders and the Administrative Agent and (ii) the Consent and Reaffirmation attached hereto duly executed by the Subsidiary Guarantors.
b.The Administrative Agent shall have received (i) for the account of each Lender that delivers its executed signature page to this Amendment by no later than the date and time specified by the Administrative Agent, a consent fee in an amount equal to the amount previously disclosed to the Lenders and (ii) payment of the Administrative Agent’s and its affiliates’ fees and reasonable and documented out-of-pocket expenses (including reasonable fees, charges and expenses of counsel for the Administrative Agent) in connection with this Amendment and the other Loan Documents to the extent provided for in Section 9.03 of the Amended Credit Agreement.
c.The Administrative Agent shall have made such reallocations of each Lender’s Applicable Percentage of the Revolving Credit Exposure under the Amended Credit Agreement as are necessary in order that the Revolving Credit Exposure with respect to such Lender reflects such Lender’s Applicable Percentage of the Revolving Credit Exposure and modified Revolving Commitment under the Amended Credit Agreement. It is understood and agreed that the Borrower will not be obligated to compensate any Lender for any and all losses, costs and expenses incurred by such Lender in connection with the sale and assignment of any Term Benchmark Loans and RFR Loans and the reallocation described in this clause (c) pursuant to Section 2.16 of the Amended Credit Agreement.
3.Representations and Warranties of the Borrower. The Borrower hereby represents and warrants as follows:
a.This Amendment and the Amended Credit Agreement have been duly authorized by all requisite organizational action and, if required, stockholder action, and this Amendment has been duly executed and delivered by the Borrower.
b.This Amendment and the Amended Credit Agreement constitute legal, valid and binding obligations of the Borrower, enforceable against the Borrower in accordance with its terms, except as enforceability may be limited by bankruptcy, insolvency or similar laws affecting the enforcement of creditor’s rights generally.
c.As of the date hereof and after giving effect to the terms of this Amendment, (i) no Default has occurred and is continuing and (ii) the representations and warranties of the Borrower set forth in the Amended Credit Agreement are true and correct in all material respects (or, in the case of any representation or warranty qualified by materiality or Material Adverse Effect, in all respects), except to the extent that such representations and warranties specifically refer to an earlier date, in which case they shall be true and correct in all material respects (or, in the case of any representation or warranty qualified by materiality or Material Adverse Effect, in all respects) as of such earlier date.
4.Reference to and Effect on the Credit Agreement.
a.Upon the effectiveness hereof, each reference to the Credit Agreement in the Credit Agreement or any other Loan Document shall mean and be a reference to the Amended Credit Agreement.
b.Each Loan Document and all other documents, instruments and agreements executed and/or delivered in connection therewith shall remain in full force and effect and are hereby ratified and confirmed.
c.The execution, delivery and effectiveness of this Amendment shall not operate as a waiver of any right, power or remedy of the Administrative Agent or the Lenders, nor constitute a waiver of any provision of the Credit Agreement, the other Loan Documents or any other documents, instruments and agreements executed and/or delivered in connection therewith.
d.This Amendment is a Loan Document.
5.Governing Law. This Amendment shall be construed in accordance with and governed by the law of the State of New York.
6.Headings. Section headings used herein are for convenience of reference only, are not part of this Amendment and shall not affect the construction of, or be taken into consideration in interpreting, this Amendment.
7.Counterparts. This Amendment may be executed in counterparts (and by different parties hereto on different counterparts), each of which shall constitute an original, but all of which when taken together shall constitute a single contract. The words “execution,” “signed,” “signature,” “delivery,” and words of like import in or relating to this Amendment and/or any document to be signed in connection with this Amendment and the transactions contemplated hereby shall be deemed to include Electronic Signatures (as defined below), deliveries or the keeping of records in electronic form, each of which shall be of the same legal effect, validity or enforceability as a manually executed signature, physical delivery thereof or the use of a paper-based recordkeeping system, as the case may be. As used herein, “Electronic Signatures” means any electronic symbol or process attached to, or associated with, any contract or other record and adopted by a person with the intent to sign, authenticate or accept such contract or record.
[Signature Pages Follow]
IN WITNESS WHEREOF, this Amendment has been duly executed as of the day and year first above written.
TREDEGAR CORPORATION,
as the Borrower
By: /s/ D. Andrew Edwards
Name: D. Andrew Edwards
Title: Executive Vice President and Chief Financial Officer
JPMORGAN CHASE BANK, N.A.,
individually as a Lender and as Administrative Agent
By: /s/ James A. Knight
Name: James A. Knight
Title: Executive Director
CITIZENS BANK, N.A.,
as a Lender
By: /s/ A. Paul Dawley
Name: A. Paul Dawley
Title: Senior Vice President
PNC BANK, NATIONAL ASSOCIATION,
as a Lender
By: /s/ Oscar M. Trejo
Name: Oscar M. Trejo
Title: Vice President
BANK OF AMERICA, N.A.,
as a Lender
By: /s/ Nancy A. Old
Name: Nancy A. Old
Title: Senior Vice President
WELLS FARGO BANK, NATIONAL ASSOCIATION,
as a Lender
By: /s/ Timothy Favinger
Name: Timothy Favinger
Title: Director
CITIBANK, N.A.,
as a Lender
By: /s/ Andrew Stella
Name: Andrew Stella
Title: Vice President
CONSENT AND REAFFIRMATION
Each of the undersigned hereby acknowledges receipt of a copy of the foregoing Amendment No. 2 to the Second Amended and Restated Credit Agreement dated as of June 29, 2022 (as amended, restated, supplemented or otherwise modified, the “Credit Agreement”) by and among Tredegar Corporation, a Virginia corporation, the financial institutions from time to time party thereto (the “Lenders”) and JPMorgan Chase Bank, N.A., as Administrative Agent (the “Administrative Agent”), which Amendment No. 2 is dated as of August 3, 2023 (the “Amendment”). Capitalized terms used in this Consent and Reaffirmation and not defined herein shall have the meanings given to them in the Credit Agreement. Without in any way establishing a course of dealing by the Administrative Agent or any Lender, each of the undersigned consents to the Amendment and reaffirms the terms and conditions of the Credit Agreement and any other Loan Document executed by it and acknowledges and agrees that such Credit Agreement and each and every such Loan Document executed by the undersigned in connection with the Credit Agreement remains in full force and effect and is hereby reaffirmed, ratified and confirmed. All references to the Credit Agreement contained in the above‑referenced documents shall be a reference to the Credit Agreement as so modified by the Amendment.
Dated: August 3, 2023
[Signature Page Follows]
IN WITNESS WHEREOF, this Consent and Reaffirmation has been duly executed as of the day and year first above written.
TREDEGAR PERFORMANCE FILMS INC.
By: /s/ D. Andrew Edwards
Name: D. Andrew Edwards
Title: Executive Vice President and Chief Financial Officer
TERPHANE HOLDINGS LLC
By: /s/ D. Andrew Edwards
Name: D. Andrew Edwards
Title: Executive Vice President and Chief Financial Officer
BONNELL ALUMINUM, INC.
By: /s/ D. Andrew Edwards
Name: D. Andrew Edwards
Title: Executive Vice President and Chief Financial Officer
BONNELL ALUMINUM (NILES), LLC
By: /s/ D. Andrew Edwards
Name: D. Andrew Edwards
Title: Executive Vice President and Chief Financial Officer
BONNELL ALUMINUM (CORPORATE), INC.
By: /s/ D. Andrew Edwards
Name: D. Andrew Edwards
Title: Executive Vice President and Chief Financial Officer
BONNELL ALUMINUM (CLEARFIELD), INC.
By: /s/ D. Andrew Edwards
Name: D. Andrew Edwards
Title: Executive Vice President and Chief Financial Officer
TREDEGAR SURFACE PROTECTION, LLC
By: /s/ D. Andrew Edwards
Name: D. Andrew Edwards
Title: Executive Vice President and Chief Financial Officer
TREDEGAR FAR EAST CORPORATION
By: /s/ D. Andrew Edwards
Name: D. Andrew Edwards
Title: Executive Vice President and Chief Financial Officer
TREDEGAR FILM PRODUCTS (LATIN AMERICA), INC.
By: /s/ D. Andrew Edwards
Name: D. Andrew Edwards
Title: Executive Vice President and Chief Financial Officer
TAC HOLDINGS, LLC
By: /s/ D. Andrew Edwards
Name: D. Andrew Edwards
Title: Executive Vice President and Chief Financial Officer
BONNELL ALUMINUM (ELKHART), INC.
By: /s/ D. Andrew Edwards
Name: D. Andrew Edwards
Title: Executive Vice President and Chief Financial Officer
ANNEX A
[See attached.]
TABLE OF CONTENTS
Page
ARTICLE I DEFINITIONS_____________________________________________________________________________ 1
SECTION 1.01 Defined Terms___________________________________________________________________1
SECTION 1.02 Classification of Loans and Borrowings______________________________________________39
SECTION 1.03 Terms Generally________________________________________________________________ 39
SECTION 1.04 Accounting Terms; GAAP______________________________________________________ 3940
SECTION 1.05 Status of Obligations_____________________________________________________________40
SECTION 1.06 Interest Rates; Benchmark Notification______________________________________________ 40
SECTION 1.07 Amendment and Restatement of Existing Credit Agreement____________________________4041
SECTION 1.08 Divisions____________________________________________________________________ 4142
SECTION 1.09 Letter of Credit Amounts 4142
SECTION 1.10 Exchange Rates; Currency Equivalents 4142
ARTICLE II THE CREDITS___________________________________________________________________________ 42
SECTION 2.01 Commitments _________________________________________________________________ 42
SECTION 2.02 Loans and Borrowings _________________________________________________________4243
SECTION 2.03 Requests for Revolving Borrowings ______________________________________________ 4344
SECTION 2.04 Determination of Dollar Amounts __________________________________________________ 44
SECTION 2.05 Swingline Loans______________________________________________________________ 4445
SECTION 2.06 Letters of Credit ______________________________________________________________ 4546
SECTION 2.07 Funding of Borrowings__________________________________________________________ 51
SECTION 2.08 Interest Elections______________________________________________________________5152
SECTION 2.09 Termination and Reduction of Commitments________________________________________5354
SECTION 2.10 Repayment of Loans; Evidence of Debt____________________________________________ 5354
SECTION 2.11 Prepayment of Loans___________________________________________________________5455
SECTION 2.12 Fees__________________________________________________________________________ 55
SECTION 2.13 Interest______________________________________________________________________5657
SECTION 2.14 Alternate Rate of Interest_________________________________________________________ 57
SECTION 2.15 Increased Costs_________________________________________________________________ 60
SECTION 2.16 Break Funding Payments________________________________________________________6162
SECTION 2.17 Taxes_______________________________________________________________________6162
SECTION 2.18 Payments Generally; Allocations of Proceeds; Pro Rata Treatment; Sharing of Setoffs ________ 65
SECTION 2.19 Mitigation Obligations; Replacement of Lenders______________________________________ 67
SECTION 2.20 Expansion Option_____________________________________________________________ 6768
SECTION 2.21 Judgment Currency______________________________________________________________ 69
SECTION 2.22 Defaulting Lenders____________________________________________________________ 6970
ARTICLE III REPRESENTATIONS AND WARRANTIES________________________________________________ 7172
SECTION 3.01 Organization; Powers__________________________________________________________ 7172
SECTION 3.02 Authorization; Governmental Approvals_____________________________________________ 72
SECTION 3.03 Enforceability________________________________________________________________ 7273
SECTION 3.04 Financial Statements___________________________________________________________ 7273
SECTION 3.05 No Material Adverse Change____________________________________________________ 7273
SECTION 3.06 Title to Properties_____________________________________________________________ 7273
Table of Contents (continued)
Page
SECTION 3.07 The Subsidiaries and the Borrower__________________________________________________73
SECTION 3.08 Litigation: Compliance with Laws__________________________________________________ 73
SECTION 3.09 Agreements__________________________________________________________________ 7374
SECTION 3.10 Federal Reserve Regulations_____________________________________________________7374
SECTION 3.11 Investment Company Act_______________________________________________________ 7374
SECTION 3.12 Use of Proceeds_______________________________________________________________7374
SECTION 3.13 Tax Returns__________________________________________________________________7374
SECTION 3.14 No Material Misstatements________________________________________________________ 74
SECTION 3.15 ERISA______________________________________________________________________7475
SECTION 3.16 Environmental Matters_________________________________________________________ 7475
SECTION 3.17 Security Interest in Collateral____________________________________________________ 7475
SECTION 3.18 Tax Shelter Regulations__________________________________________________________ 75
SECTION 3.19 Anti-Corruption Laws and Sanctions________________________________________________ 75
SECTION 3.20 Affected Financial Institutions___________________________________________________ 7576
ARTICLE IV CONDITIONS__________________________________________________________________________ 7576
SECTION 4.01 Effective Date______________________________________________________________ 7576
SECTION 4.02 Each Credit Event___________________________________________________________7677
ARTICLE V AFFIRMATIVE COVENANTS_____________________________________________________________ 77
SECTION 5.01 Existence; Businesses and Properties Compliance_____________________________________7778
SECTION 5.02 Insurance_____________________________________________________________________7778
SECTION 5.03 Obligations and Taxes___________________________________________________________7778
SECTION 5.04 Financial Statements, Reports, etc._________________________________________________7778
SECTION 5.05 Litigation and Other Notices______________________________________________________7879
SECTION 5.06 ERISA______________________________________________________________________7980
SECTION 5.07 Maintaining Records; Access to Properties and Inspections_____________________________7980
SECTION 5.08 Compliance with Law__________________________________________________________7980
SECTION 5.09 Guarantors; Pledges; Additional Collateral; Further Assurances__________________________7980
SECTION 5.10 Environmental Laws_____________________________________________________________ 81
ARTICLE VI NEGATIVE COVENANTS_______________________________________________________________8182
SECTION 6.01 Liens_______________________________________________________________________ 8182
SECTION 6.02 Sale and Lease-Back Transactions________________________________________________ 8384
SECTION 6.03 Indebtedness_________________________________________________________________ 8384
SECTION 6.04 Mergers, Consolidations and Sales of Assets________________________________________ 8485
SECTION 6.05 Dividends and Distributions_____________________________________________________ 8586
SECTION 6.06 Transactions with Affiliates_______________________________________________________ 86
SECTION 6.07 [Intentionally Omitted]_________________________________________________________ 8687
SECTION 6.08 Total Net Leverage Ratio_______________________________________________________ 8687
SECTION 6.09 Interest Coverage Ratio_________________________________________________________8687
SECTION 6.10 No Further Negative Pledges_____________________________________________________8687
SECTION 6.11 Advances, Investments and Loans________________________________________________ 8687
SECTION 6.12 Limitation on Restricted Actions__________________________________________________8688
SECTION 6.13 Anti-Corruption Laws and Sanctions______________________________________________ 8788
Table of Contents (continued)
Page
ARTICLE VII EVENTS OF DEFAULT_______________________________________________________________8788
SECTION 7.01 Events of Default______________________________________________________________8788
SECTION 7.02 Remedies Upon an Event of Default_______________________________________________8990
ARTICLE VIII THE ADMINISTRATIVE AGENT_______________________________________________________ 9092
SECTION 8.01 Authorization and Action_______________________________________________________ 9092
SECTION 8.02 Administrative Agent’s Reliance, Indemnification, Etc.________________________________9394
SECTION 8.03 Posting of Communications_____________________________________________________ 9495
SECTION 8.04 The Administrative Agent Individually_____________________________________________9596
SECTION 8.05 Successor Administrative Agent__________________________________________________9597
SECTION 8.06 Acknowledgement of Lenders and Issuing Banks____________________________________ 9698
SECTION 8.07 Collateral Matters_____________________________________________________________ 9899
SECTION 8.08 Credit Bidding_______________________________________________________________99100
SECTION 8.09 Certain ERISA Matters_______________________________________________________ 100101
SECTION 8.10 Certain Foreign Pledge Matters_________________________________________________101102
ARTICLE IX MISCELLANEOUS___________________________________________________________________102103
SECTION 9.01 Notices____________________________________________________________________102103
SECTION 9.02 Waivers; Amendments________________________________________________________ 103104
SECTION 9.03 Expenses; Indemnity; Damage Waiver____________________________________________106107
SECTION 9.04 Successors and Assigns________________________________________________________107108
SECTION 9.05 Survival____________________________________________________________________112113
SECTION 9.06 Counterparts; Integration; Effectiveness; Electronic Execution_________________________112113
SECTION 9.07 Severability________________________________________________________________ 113115
SECTION 9.08 Right of Setoff_______________________________________________________________113115
SECTION 9.09 Governing Law; Jurisdiction; Consent to Service of Process__________________________ 114115
SECTION 9.10 WAIVER OF JURY TRIAL___________________________________________________114116
SECTION 9.11 Headings__________________________________________________________________ 115116
SECTION 9.12 Confidentiality_______________________________________________________________115116
SECTION 9.13 USA PATRIOT Act_________________________________________________________ 116117
SECTION 9.14 Release of Subsidiary Guarantors________________________________________________116117
SECTION 9.15 Interest Rate Limitation________________________________________________________116118
SECTION 9.16 No Fiduciary Duty, etc.________________________________________________________117118
SECTION 9.17 Appointment for Perfection_____________________________________________________118119
SECTION 9.18 Acknowledgement and Consent to Bail-In of Affected Financial
Institutions_________________________________________________________ 118119
SECTION 9.19 Acknowledgement Regarding Supported QFCs_____________________________________118120
ARTICLE X BORROWER GUARANTEE____________________________________________________________119120
Table of Contents (continued)
Page
SCHEDULES:
Schedule 1.01(a) – Non-Operating Property Held
Schedule 1.01(b) – Permitted Investments Schedule 1.01(c) – Securities Held
Schedule 2.01A – Commitments
Schedule 2.01B – Letter of Credit Commitments Schedule 2.06 – Existing Letters of Credit
Schedule 3.07 – Subsidiaries
Schedule 6.01 – Permitted Liens
Schedule 6.03(c) – Existing Intercompany Indebtedness
EXHIBITS:
Exhibit A – Form of Assignment and Assumption
Exhibit B-1 – Form of Borrowing Request
Exhibit B-2 – Form of Interest Election Request
Exhibit C – Form of Note
Exhibit D – [Intentionally Omitted]
Exhibit E – Form of Increasing Lender Supplement
Exhibit F – Form of Augmenting Lender Supplement
Exhibit G – List of Closing Documents
Exhibit H – Form of Subsidiary Guaranty
Exhibit I – Form of Compliance Certificate
Exhibit J-1 – Form of U.S. Tax Certificate (Foreign Lenders That Are Not Partnerships)
Exhibit J-2 – Form of U.S. Tax Certificate (Foreign Participants That Are Not Partnerships)
Exhibit J-3 – Form of U.S. Tax Certificate (Foreign Participants That Are Partnerships)
Exhibit J-4 – Form of U.S. Tax Certificate (Foreign Lenders That Are Partnerships)
“Adjusted Daily Simple RFR” means, (i) with respect to any RFR Borrowing denominated in Pounds Sterling, an interest rate per annum equal to (a) the Daily Simple RFR for Pounds Sterling, plus (b) 0.0326%, (ii) with respect to any RFR Borrowing denominated in Swiss Francs, an interest rate per annum equal to (a) the Daily Simple RFR for Swiss Francs, plus (b) negative 0.0571%, and (iii) with respect to any RFR Borrowing denominated in Dollars, an interest rate per annum equal to (a) the Daily Simple RFR for Dollars, plus (b) 0.10%; provided that if the Adjusted Daily Simple RFR as so determined would be less than the Floor, such rate shall be deemed to be equal to the Floor for the purposes of this Agreement.
“Adjusted EURIBO Rate” means, with respect to any Term Benchmark Borrowing denominated in euro for any Interest Period, an interest rate per annum equal to (a) the EURIBO Rate for such Interest Period multiplied by (b) the Statutory Reserve Rate; provided that if the Adjusted EURIBO Rate as so determined would be less than the Floor, such rate shall be deemed to be equal to the Floor for the purposes of this Agreement.
“Adjusted Term SOFR Rate” means, with respect to any Term Benchmark Borrowing denominated in Dollars for any Interest Period, an interest rate per annum equal to (a) the Term SOFR Rate for such Interest Period, plus (b) 0.10%; provided that if the Adjusted Term SOFR Rate as so determined would be less than the Floor, such rate shall be deemed to be equal to the Floor for the purposes of this Agreement.
“Adjusted TIBO Rate” means, with respect to any Term Benchmark Borrowing denominated in Japanese Yen for any Interest Period, an interest rate per annum equal to (a) the TIBO Rate for such Interest Period multiplied by (b) the Statutory Reserve Rate; provided that if the Adjusted TIBO Rate as so determined would be less than the Floor, such rate shall be deemed to be equal to the Floor for the purposes of this Agreement.
“Administrative Agent” means JPMorgan Chase Bank, N.A. (or any of its designated branch offices or affiliates), in its capacity as administrative agent for the Lenders hereunder.
“Administrative Questionnaire” means an Administrative Questionnaire in a form supplied by the Administrative Agent.
“Affected Financial Institution” means (a) any EEA Financial Institution or (b) any UK Financial Institution.
“Affiliate” means, with respect to a specified Person, another Person that directly, or indirectly through one or more intermediaries, Controls or is Controlled by or is under common Control with the Person specified.
“Agent-Related Person” has the meaning assigned to such term in Section 9.03(c). “Aggregate Commitment” means the aggregate of the Commitments of all of the Lenders, as reduced or increased from time to time pursuant to the terms and conditions hereof. The initial Aggregate Commitment as of the Amendment No. 2 Effective Date is $375,000,000200,000,000.
“Agreed Currencies” means (i) Dollars, (ii) euro, (iii) Pounds Sterling, (iv) Swiss Francs, (v) Japanese Yen and (vi) any other currency (other than Dollars) (x) that is a lawful currency that is readily available and freely transferable and convertible into Dollars and (y) that is agreed to by the Administrative Agent and each of the Lenders.
“Agreement” has the meaning assigned to such term in the introductory paragraph.
“Alternate Base Rate” means, for any day, a rate per annum equal to the greatest of (a) the Prime Rate in effect on such day, (b) the NYFRB Rate in effect on such day plus ½ of 1% and (c) the Adjusted Term SOFR Rate for a one month Interest Period as published two U.S. Government Securities Business Days prior to such day (or if such day is not a U.S. Government Securities Business Day, the immediately preceding U.S. Government Securities Business Day) plus 1%; provided that for the purpose of this definition, the Adjusted Term SOFR Rate for any day shall be based on the Term SOFR Reference Rate at approximately 5:00 a.m., Chicago time, on such day (or any amended publication time for the Term SOFR Reference Rate, as specified by the CME Term SOFR Administrator in the Term SOFR Reference Rate methodology). Any change in the Alternate Base Rate due to a change in the Prime Rate, the NYFRB Rate or the Adjusted Term SOFR Rate shall be effective from and including the effective date of such change in the Prime Rate, the NYFRB Rate or the Adjusted Term SOFR Rate, respectively. If the Alternate Base Rate is being used as an alternate rate of interest pursuant to Section 2.14 (for the avoidance of doubt, only until the Benchmark Replacement has been determined pursuant to Section 2.14(b)), then the Alternate Base Rate shall be the greater of clauses (a) and (b) above and shall be determined without reference to clause (c) above. For the avoidance of doubt, if the Alternate Base Rate as determined pursuant to the foregoing would be less than 1.00%, such rate shall be deemed to be 1.00% for purposes of this Agreement.
“Amendment No. 2 Effective Date” means August 3, 2023.
“Ancillary Document” has the meaning assigned to such term in Section 9.06.
“Anti-Corruption Laws” means all laws, rules, and regulations of any jurisdiction applicable to the Borrower and its affiliated companies concerning or relating to bribery or corruption.
“Applicable Party” has the meaning assigned to such term in Section 8.03(c).
“Applicable Percentage” means, with respect to any Lender, the percentage of them Aggregate Commitment represented by such Lender’s Commitment; provided that, in the case of Section 2.22 when a Defaulting Lender shall exist, “Applicable Percentage” shall mean the percentage of the Aggregate Commitment (disregarding any Defaulting Lender’s Commitment) represented by such Lender’s Commitment. If the Commitments have terminated or expired, the Applicable Percentages shall be determined based upon the Commitments most recently in effect, giving effect to any assignments and to any Lender’s status as a Defaulting Lender at the time of determination.
“Applicable Pledge Percentage” means 100% but 65% in the case of a pledge by the Borrower or any Domestic Subsidiary of its Equity Interests in a Foreign Subsidiary.
“Applicable Rate” means, for any day, with respect to any Term Benchmark Loan, any RFR Loan or any ABR Loan or with respect to the commitment fees payable hereunder, as the case may be, the applicable rate per annum set forth below under the caption “Term Benchmark Spread”, “RFR Spread”, “ABR Spread” or “Commitment Fee Rate”, as the case may be, based upon the Total Net Leverage Ratio applicable on such date:
| | | | | | | | | | | | | | | | | |
|
Total Net Leverage Ratio | Term Benchmark Spread |
RFR Spread |
ABR Spread |
Commitment Fee Rate |
| Category 1: | ≤ 1.00 to 1.00 | 1.501.750% | 1.501.750% | 0.500.750% | 0.20% |
| Category 2: | > 1.00 to 1.00 ≤ 2.00 to 1.00 | 1.6251.875% | 1.6251.875% | 0.6250.875% | 0.25% |
| Category 3: | > 2.00 to 1.00 ≤ 3.00 to 1.00 | 1.752.000% | 1.752.000% | 0.751.000% | 0.30% |
| Category 4: | > 3.00 to 1.00 ≤ 3.50 to 1.00 | 1.8752.125% | 1.8752.125% | 0.8751.125% | 0.35% |
| Category 5: | > 3.50 to 1.00 | 2.002.250% | 2.002.250% | 1.001.250% | 0.40% |
For purposes of the foregoing,
i.if at any time the Borrower fails to deliver the Financials on or before the date the Financials are due pursuant to Section 5.04, Category 5 shall be deemed applicable for the period commencing three (3) Business Days after the required date of delivery and ending on the date which is three (3) Business Days after the Financials are actually delivered, after which the Category shall be determined in accordance with the table above as applicable;
ii.adjustments, if any, to the Category then in effect shall be effective three (3) Business Days after the Administrative Agent has received the applicable Financials (it being understood and agreed that each change in Category shall apply during the period commencing on the effective date of such change and ending on the date immediately preceding the effective date of the next such change); and
iii.notwithstanding the foregoing, on and after the Amendment No. 2 Effective Date, Category 13 shall be deemed to be applicable until the Administrative Agent’s receipt of the applicable Financials for the Borrower’s first full fiscal quarter ending after the Amendment No. 2 Effective Date (unless such Financials demonstrate that Category 1, 2, 3, 4 or 5 should have been applicable during such period, in which case such other Category shall be deemed to be applicable during such period) and adjustments to the Category then in effect shall thereafter be effected in accordance with the preceding paragraphs.
“Applicable Time” means, with respect to any Borrowings and payments in any Foreign Currency, the local time in the place of settlement for such Foreign Currency as may be determined by the Administrative Agent or the applicable Issuing Bank, as the case may be, to be necessary for timely settlement on the relevant date in accordance with normal banking procedures in the place of payment.
“Approved Bank” shall have the meaning set forth in the definition of Cash Equivalents.
“Approved Electronic Platform” has the meaning assigned to such term in Section 8.03(a).
“Approved Fund” has the meaning assigned to such term in Section 9.04(b).
“Arranger” means each of JPMorgan Chase Bank, N.A., Citizens Bank, N.A. and PNC Capital Markets LLC in its capacity a joint bookrunner and a joint lead arranger hereunder.
“Asset Disposition” means the disposition of any or all of the assets (including, without limitation, a business segment, an operation within a business segment, the capital stock of a Subsidiary under GAAP, less (b) the Borrower’s treasury stock and minority interest in Subsidiaries at such time, all determined in accordance with GAAP.
“Consolidated Total Assets” means, as of the date of any determination thereof, total assets of the Borrower and its Subsidiaries calculated in accordance with GAAP on a consolidated basis as of such date.
“Consolidated Total Debt” means, at any time, all Indebtedness of the Borrower and its consolidated Subsidiaries at such time, computed and consolidated in accordance with GAAP. For the avoidance of doubt, Consolidated Total Debt shall exclude Indebtedness (if any) arising from any Permitted Supplier Financing.
“Continuing Director” means (a) any member of the Board of Directors of the Borrower on the date of this Agreement and (b) any Person whose subsequent nomination for election or election to the Board of Directors was recommended or approved by a majority of the Continuing Directors serving as such at the time of such nomination or election.
“Control” means the possession, directly or indirectly, of the power to direct or cause the direction of the management or policies of a Person, whether through the ability to exercise voting power, by contract or otherwise. “Controlling” and “Controlled” have meanings correlative thereto.
“Corresponding Tenor” with respect to any Available Tenor means, as applicable, either a tenor (including overnight) or an interest payment period having approximately the same length (disregarding business day adjustment) as such Available Tenor.
“Co-Syndication Agent” means each of Citizens Bank, N.A. and PNC Bank, National Association in its capacity as co-syndication agent for the credit facility evidenced by this Agreement.
“Covenant Relief Period” means the period commencing on the Amendment No. 2 Effective Date and ending on the first date (if any) on which the Borrower delivers to the Administrative Agent the Financials in respect of the fiscal year ending December 31, 2024 under Section 5.04(a) and the compliance certificate in respect of such fiscal year under Section 5.04(d) demonstrating that the Borrower was in compliance with Sections 6.08 and 6.09 as of the end of such fiscal year.
“Covered Entity” means any of the following:
i.a “covered entity” as that term is defined in, and interpreted in accordance with, 12 C.F.R. § 252.82(b);
ii.a “covered bank” as that term is defined in, and interpreted in accordance with, 12 C.F.R. § 47.3(b); or
iii.a “covered FSI” as that term is defined in, and interpreted in accordance with, 12 C.F.R. § 382.2(b).
“Covered Party” has the meaning assigned to it in Section 9.19.
“Credit Event” means a Borrowing, the issuance, amendment or extension of a Letter of Credit, an LC Disbursement or any of the foregoing.
any Subsidiary from the sale of such assets and (iii) the sale of the Securities Held and the Non-Operating Property Held;
d. sales of Permitted Receivables Related Assets and any related assets pursuant to any Permitted Supplier Financing;
e. any Internal Financing Transaction;
f. any Loan Party or any of its Subsidiaries from dissolving or disposing of any Subsidiary (other than Significant Subsidiaries);
g. leases entered into in the ordinary course of business and subleases to the extent that such sublease does not materially and adversely affect the Borrower’s business;
h. Permitted Investments; and
i.the disposition of any real estate no longer used or useful in the Borrower’s business with a net book value of less than $6,000,000 in the aggregate.
SECTION 6.05 Dividends and Distributions. Declare or make, directly or indirectly, any Restricted Payment; provided, however, that (a) any Subsidiary may declare and pay dividends or make other distributions to the Borrower, and any Internal Financing Subsidiary may declare and pay dividends or make other distributions to the Borrower or other wholly-owned Subsidiaries, (b) the Borrower may make Restricted Payments pursuant to and in accordance with stock option plans or other benefit plans for management or employees of the Borrower and its Subsidiaries, (c) solely to the extent that the Covenant Relief Period is not in effect, the Borrower may make Restricted Payments so long as no Default or Event of Default has occurred and is continuing prior to making such Restricted Payment or would arise after giving effect (including giving effect on a Pro Forma Basis) thereto in an aggregate amount of all such Restricted Payments made pursuant to this clause (c) not to exceed $75,000,000 during the term of this Agreement (the “Fixed RP Basket”) (provided, it being understood and agreed that, regardless of any previous usage of the Fixed RP Basket, if the Total Net Leverage Ratio is less than or equal to 2.00 to 1.00 at the end of any fiscal quarter of the Borrower, the Fixed RP Basket shall be reset to an amount of $75,000,000 at the time that the Borrower delivers to the Administrative Agent the applicable Financials in respect of such fiscal quarter under Section 5.04(a) or Section 5.04(b), as applicable, and the compliance certificate in respect of such fiscal quarter under Section 5.04(d) demonstrating such Total Net Leverage Ratio of less than or equal to 2.00 to 1.00) and (d) solely to the extent that the Covenant Relief Period is not in effect, the Borrower may make unlimited Restricted Payments so long as, at the time of the making of such Restricted Payment and immediately after giving effect (including giving effect on a Pro Forma Basis) thereto, (x) no Default or Event of Default shall have occurred and be continuing and (y) the Total Net Leverage Ratio is equal to or less than 2.00 to 1.00.
SECTION 6.06 Transactions with Affiliates. Sell or transfer any property or assets to, or purchase or acquire any property or assets from, or otherwise engage in any other transactions with, any of its Affiliates, except that as long as no Default or Event of Default shall have occurred and be continuing, the Borrower or any Subsidiary may engage in any of the foregoing transactions (a) in the ordinary course of business at prices and on terms and conditions not less favorable to the Borrower or such Subsidiary than could be obtained on an arm’s-length basis from unrelated third parties, (b) in connection with Internal Financing Transactions, (c) any dividends or distributions permitted by Section 6.05, (d) reasonable and customary fees paid to members of the board of directors (or similar governing body) of the Borrower and its Subsidiaries and compensation arrangements for officers and other employees of the Borrower and its Subsidiaries entered into in the ordinary course of business or (e) transactions between or among the Borrower and its Subsidiaries (or an entity that becomes a Subsidiary of the Borrower as a result of such transaction) (or any combination thereof) not involving any other Affiliate.
SECTION 6.07 [Intentionally Omitted].
SECTION 6.08 Total Net Leverage Ratio. Permit the Total Net Leverage Ratio, determined as of the end of each fiscal quarter, to be greater than 4.00 to 1.00.the level set forth below for such fiscal quarter:
| | | | | |
| Fiscal Quarter Ending | Maximum Total Net Leverage Ratio |
| September 30, 2023, December 31, 2023 and March 31, 2024 |
5.00 to 1.00 |
| June 30, 2024 | 4.75 to 1.00 |
| | | | | |
| September 30, 2024 | 4.25 to 1.00 |
| December 31, 2024 and each fiscal quarter thereafter |
4.00 to 1.00 |
SECTION 6.09 Interest Coverage Ratio. Permit the Interest Coverage Ratio, determined as of the end of each fiscal quarter, to be less than 3.00 to 1.00.the level set forth below for such fiscal quarter:
| | | | | |
| Fiscal Quarter Ending | Minimum Interest Coverage Ratio |
| September 30, 2023, December 31, 2023, March 31, 2024 and June 30, 2024 |
2.50 to 1.00 |
| September 30, 2024 | 2.75 to 1.00 |
| December 31, 2024 and each fiscal quarter thereafter |
3.00 to 1.00 |
SECTION 6.10 No Further Negative Pledges. Enter into, assume or become subject to any agreement of Indebtedness (but only Indebtedness of the type described in clauses (a) or (b) of the definition thereof) that prohibits or otherwise restricts the creation or assumption of any Lien upon its properties or assets, whether now owned or hereafter acquired, or requiring the grant of any security for such obligation if security is given for some other obligation, except:
a.pursuant to this Agreement and the other Loan Documents; and
b.pursuant to any document or instrument governing Indebtedness incurred pursuant to Section 6.03 (excluding subsection (a) thereof).
SECTION 6.11 Advances, Investments and Loans. Make any Investment except for Permitted Investments.
SECTION 6.12 Limitation on Restricted Actions. Directly or indirectly, create or otherwise cause or suffer to exist or become effective any encumbrance or restriction on the ability of any such Person to (a) pay dividends or make any other distributions to any Loan Party or any Subsidiary on its capital stock or with respect to any other interest or participation in, or measured by, its profits, (b) pay any Indebtedness or other obligation owed to any Loan Party or any Subsidiary, (c) make loans or advances to any Loan Party or any Subsidiary, (d) sell, lease or transfer any of its properties or assets to any Loan Party or any Subsidiary, or (e) act as a Subsidiary Guarantor and pledge its assets pursuant to the Loan Documents or any renewals, refinancings, exchanges, refundings or extension thereof, except (x) in respect of any of the matters referred to in clauses (a)-(d) above for such encumbrances or restrictions existing under or by reason of (i) this Agreement and the other Loan Documents,
(ii) applicable law and (iii) any Permitted Lien of the type described in clauses (a) or (h) of Section 6.01 or any document or instrument governing any such Permitted Lien; provided that any such restriction contained therein relates only to the asset or assets subject to such Permitted Lien and (y) in respect of any matters referred to in clauses (d) and (e) above, for such customary encumbrances or restrictions under or by reason of any document or agreement related to joint ventures or other similar arrangements permitted by this Agreement and (z) in respect of matters referred to in clause (d) above, for such customary encumbrances or restrictions arising under or by reason of any document or agreement evidencing a Permitted Supplier Financing with respect to the sale, lease or transfer of any accounts receivable and related assets that are the subject of such Permitted Supplier Financing.
SECTION 6.13 Anti-Corruption Laws and Sanctions. Request any Borrowing or Letter of Credit or use (or permit their respective directors, officers, employees and agents to use) the proceeds of any Borrowing or Letter of Credit (i) in furtherance of an offer, payment, promise to pay, or authorization of the payment or giving of money, or anything else of value, to any Person in violation of any Anti-Corruption Laws, (ii) for the purpose of funding, financing or facilitating any activities, business or transaction of or with any Sanctioned Person, or in any Sanctioned Country, or (iii) in any manner that would result in the violation of any Sanctions applicable to any party hereto.
ARTICLE VII
Events of Default
SECTION 7.01 Events of Default. In case of the happening of any of the following events (“Events of Default”):
a.any representation or warranty made or deemed made in or in connection with any Loan Document or the borrowings hereunder, or any representation, warranty, statement or information contained in any report, certificate, financial statement or other instrument furnished in connection with or pursuant to any Loan Document, shall prove to have been false or misleading in any material respect when so made, deemed made or furnished;
b.default shall be made in the payment of any principal of any Loan when and as the same shall become due and payable, or the Borrower shall fail to reimburse any Issuing Bank for any LC Exposure when due in accordance with the terms hereof, whether at the due date thereof or at a date fixed for prepayment thereof or by acceleration thereof or otherwise (or any Subsidiary Guarantor shall fail to pay on the Subsidiary Guaranty in respect of any of the foregoing or in respect of any other Guaranty Obligations thereunder within the aforesaid period of time);
SCHEDULE 2.01A COMMITMENTS | | | | | |
| LENDER | COMMITMENT |
| JPMORGAN CHASE BANK, N | $55,000,00029,333,333.34 |
| |
| CITIZENS BANK, N. | $55,000,00029,333,333.33 |
| |
| PNC BANK, NATIONAL ASSOCIAT | $55,000,00029,333,333.33 |
| |
| BANK OF AMERICA, N | $40,000,00021,333,333.34 |
| |
| U.S. BANK NATIONAL ASSOCIAT | $40,000,00021,333,333.33 |
| |
| WELLS FARGO BANK, NATIONAL ASSOCIA | $40,000,00021,333,333.33 |
| |
| CITIBANK, N.A | $30,000,00016,000,000.00 |
| |
| FIRST HORIZON BA | $30,000,00016,000,000.00 |
| |
| THE HUNTINGTON NATIONAL B | $30,000,00016,000,000.00 |
| |
| AGGREGATE COMMITMEN | $375,000,000200,000,000 |
EXHIBIT 31.1
Section 302 Certification
I, John M. Steitz, certify that:
(1)I have reviewed this Quarterly Report on Form 10-Q for the quarter ended June 30, 2023, of Tredegar Corporation;
(2)Based on my knowledge, this report does not contain any untrue statement of a material fact or omit to state a material fact necessary to make the statements made, in light of the circumstances under which such statements were made, not misleading with respect to the period covered by this report;
(3)Based on my knowledge, the financial statements, and other financial information included in this report, fairly present in all material respects the financial condition, results of operations and cash flows of the registrant as of, and for, the periods presented in this report;
(4)The registrant’s other certifying officer and I are responsible for establishing and maintaining disclosure controls and procedures (as defined in Exchange Act Rules 13a-15(e) and 15d-15(e)) and internal control over financial reporting (as defined in Exchange Act Rules 13a-15(f) and 15d-15(f)) for the registrant and have:
(a)Designed such disclosure controls and procedures, or caused such disclosure controls and procedures to be designed under our supervision, to ensure that material information relating to the registrant, including its consolidated subsidiaries, is made known to us by others within those entities, particularly during the period in which this report is being prepared;
(b)Designed such internal control over financial reporting, or caused such internal control over financial reporting to be designed under our supervision, to provide reasonable assurance regarding the reliability of financial reporting and the preparation of financial statements for external purposes in accordance with generally accepted accounting principles;
(c)Evaluated the effectiveness of the registrant’s disclosure controls and procedures and presented in this report our conclusions about the effectiveness of the disclosure controls and procedures as of the end of the period covered by this report based on such evaluation; and
(d)Disclosed in this report any change in the registrant’s internal control over financial reporting that occurred during the registrant’s most recent fiscal quarter (the registrant’s fourth fiscal quarter in the case of an annual report) that has materially affected, or is reasonably likely to materially affect, the registrant’s internal control over financial reporting; and
(5)The registrant’s other certifying officer and I have disclosed, based on our most recent evaluation of internal control over financial reporting, to the registrant’s auditors and the audit committee of the registrant’s board of directors (or persons performing the equivalent functions):
(a)All significant deficiencies and material weaknesses in the design or operation of internal control over financial reporting which are reasonably likely to adversely affect the registrant’s ability to record, process, summarize and report financial information; and
(b)Any fraud, whether or not material, that involves management or other employees who have a significant role in the registrant’s internal control over financial reporting.
Date: August 9, 2023 | | | | | | | | | | | |
| /s/ John M. Steitz | | |
| John M. Steitz | | |
| President and Chief Executive Officer | | |
| (Principal Executive Officer) | | |
EXHIBIT 31.2
Section 302 Certification
I, D. Andrew Edwards, certify that:
(1)I have reviewed this Quarterly Report on Form 10-Q for the quarter ended June 30, 2023, of Tredegar Corporation;
(2)Based on my knowledge, this report does not contain any untrue statement of a material fact or omit to state a material fact necessary to make the statements made, in light of the circumstances under which such statements were made, not misleading with respect to the period covered by this report;
(3)Based on my knowledge, the financial statements, and other financial information included in this report, fairly present in all material respects the financial condition, results of operations and cash flows of the registrant as of, and for, the periods presented in this report;
(4)The registrant’s other certifying officer and I are responsible for establishing and maintaining disclosure controls and procedures (as defined in Exchange Act Rules 13a-15(e) and 15d-15(e)) and internal control over financial reporting (as defined in Exchange Act Rules 13a-15(f) and 15d-15(f)) for the registrant and have:
(a)Designed such disclosure controls and procedures, or caused such disclosure controls and procedures to be designed under our supervision, to ensure that material information relating to the registrant, including its consolidated subsidiaries, is made known to us by others within those entities, particularly during the period in which this report is being prepared;
(b)Designed such internal control over financial reporting, or caused such internal control over financial reporting to be designed under our supervision, to provide reasonable assurance regarding the reliability of financial reporting and the preparation of financial statements for external purposes in accordance with generally accepted accounting principles;
(c)Evaluated the effectiveness of the registrant’s disclosure controls and procedures and presented in this report our conclusions about the effectiveness of the disclosure controls and procedures as of the end of the period covered by this report based on such evaluation; and
(d)Disclosed in this report any change in the registrant’s internal control over financial reporting that occurred during the registrant’s most recent fiscal quarter (the registrant’s fourth fiscal quarter in the case of an annual report) that has materially affected, or is reasonably likely to materially affect, the registrant’s internal control over financial reporting; and
(5)The registrant’s other certifying officer and I have disclosed, based on our most recent evaluation of internal control over financial reporting, to the registrant’s auditors and the audit committee of the registrant’s board of directors (or persons performing the equivalent functions):
(a)All significant deficiencies and material weaknesses in the design or operation of internal control over financial reporting which are reasonably likely to adversely affect the registrant’s ability to record, process, summarize and report financial information; and
(b)Any fraud, whether or not material, that involves management or other employees who have a significant role in the registrant’s internal control over financial reporting.
Date: August 9, 2023 | | | | | | | | | | | |
| /s/ D. Andrew Edwards | | |
| D. Andrew Edwards | | |
| Executive Vice President and Chief Financial Officer | | |
| (Principal Financial Officer) | | |
EXHIBIT 32.1
CERTIFICATION PURSUANT TO
18 U.S.C. SECTION 1350,
AS ADOPTED PURSUANT TO
SECTION 906 OF THE SARBANES-OXLEY ACT OF 2002
In connection with the Quarterly Report on Form 10-Q of Tredegar Corporation (the “Company”) for the quarter ended June 30, 2023 as filed with the Securities and Exchange Commission on the date hereof (the “Report”), I, John M. Steitz, President and Chief Executive Officer of the Company, certify, pursuant to 18 U.S.C. § 1350, as adopted pursuant to § 906 of the Sarbanes-Oxley Act of 2002, that:
(1) the Report fully complies with the requirements of Section 13(a) or 15(d) of the Securities Exchange Act of 1934, as amended; and
(2) the information contained in the Report fairly presents, in all material respects, the financial condition and results of operations of the Company. | | | | | | | | |
| /s/ John M. Steitz | | |
| John M. Steitz | | |
| President and Chief Executive Officer | | |
| (Principal Executive Officer) | | |
| August 9, 2023 | | |
EXHIBIT 32.2
CERTIFICATION PURSUANT TO
18 U.S.C. SECTION 1350,
AS ADOPTED PURSUANT TO
SECTION 906 OF THE SARBANES-OXLEY ACT OF 2002
In connection with the Quarterly Report on Form 10-Q of Tredegar Corporation (the “Company”) for the quarter ended June 30, 2023 as filed with the Securities and Exchange Commission on the date hereof (the “Report”), I, D. Andrew Edwards, Executive Vice President and Chief Financial Officer of the Company, certify, pursuant to 18 U.S.C. § 1350, as adopted pursuant to § 906 of the Sarbanes-Oxley Act of 2002, that:
(1) the Report fully complies with the requirements of Section 13(a) or 15(d) of the Securities Exchange Act of 1934, as amended; and
(2) the information contained in the Report fairly presents, in all material respects, the financial condition and results of operations of the Company. | | | | | | | | |
| /s/ D. Andrew Edwards | | |
| D. Andrew Edwards | | |
| Executive Vice President and Chief Financial Officer | | |
| (Principal Financial Officer) | | |
| August 9, 2023 | | |
v3.23.2
Cover - shares
|
6 Months Ended |
|
Jun. 30, 2023 |
Aug. 04, 2023 |
| Cover [Abstract] |
|
|
| Document Type |
10-Q
|
|
| Document Quarterly Report |
true
|
|
| Document Transition Report |
false
|
|
| Entity File Number |
1-10258
|
|
| Entity Registrant Name |
Tredegar Corporation
|
|
| Entity Incorporation, State or Country Code |
VA
|
|
| Entity Tax Identification Number |
54-1497771
|
|
| Entity Address, Address Line One |
1100 Boulders Parkway
|
|
| Entity Address, City or Town |
Richmond,
|
|
| Entity Address, State or Province |
VA
|
|
| Entity Address, Postal Zip Code |
23225
|
|
| City Area Code |
(804)
|
|
| Local Phone Number |
330-1000
|
|
| Title of 12(b) Security |
Common stock, no par value
|
|
| Trading Symbol |
TG
|
|
| Security Exchange Name |
NYSE
|
|
| Entity Current Reporting Status |
Yes
|
|
| Entity Interactive Data Current |
Yes
|
|
| Entity Filer Category |
Accelerated Filer
|
|
| Entity Small Business |
false
|
|
| Entity Emerging Growth Company |
false
|
|
| Entity Shell Company |
false
|
|
| Entity Central Index Key |
0000850429
|
|
| Current Fiscal Year End Date |
--12-31
|
|
| Document Fiscal Year Focus |
2022
|
|
| Document Fiscal Period Focus |
Q3
|
|
| Document Period End Date |
Jun. 30, 2023
|
|
| Amendment Flag |
false
|
|
| Entity Common Stock, Shares Outstanding |
|
34,384,677
|
| X |
- DefinitionBoolean flag that is true when the XBRL content amends previously-filed or accepted submission.
| Name: |
dei_AmendmentFlag |
| Namespace Prefix: |
dei_ |
| Data Type: |
xbrli:booleanItemType |
| Balance Type: |
na |
| Period Type: |
duration |
|
| X |
- DefinitionEnd date of current fiscal year in the format --MM-DD.
| Name: |
dei_CurrentFiscalYearEndDate |
| Namespace Prefix: |
dei_ |
| Data Type: |
xbrli:gMonthDayItemType |
| Balance Type: |
na |
| Period Type: |
duration |
|
| X |
- DefinitionFiscal period values are FY, Q1, Q2, and Q3. 1st, 2nd and 3rd quarter 10-Q or 10-QT statements have value Q1, Q2, and Q3 respectively, with 10-K, 10-KT or other fiscal year statements having FY.
| Name: |
dei_DocumentFiscalPeriodFocus |
| Namespace Prefix: |
dei_ |
| Data Type: |
dei:fiscalPeriodItemType |
| Balance Type: |
na |
| Period Type: |
duration |
|
| X |
- DefinitionThis is focus fiscal year of the document report in YYYY format. For a 2006 annual report, which may also provide financial information from prior periods, fiscal 2006 should be given as the fiscal year focus. Example: 2006.
| Name: |
dei_DocumentFiscalYearFocus |
| Namespace Prefix: |
dei_ |
| Data Type: |
xbrli:gYearItemType |
| Balance Type: |
na |
| Period Type: |
duration |
|
| X |
- DefinitionFor the EDGAR submission types of Form 8-K: the date of the report, the date of the earliest event reported; for the EDGAR submission types of Form N-1A: the filing date; for all other submission types: the end of the reporting or transition period. The format of the date is YYYY-MM-DD.
| Name: |
dei_DocumentPeriodEndDate |
| Namespace Prefix: |
dei_ |
| Data Type: |
xbrli:dateItemType |
| Balance Type: |
na |
| Period Type: |
duration |
|
| X |
- DefinitionBoolean flag that is true only for a form used as an quarterly report. Reference 1: http://www.xbrl.org/2003/role/presentationRef
-Publisher SEC
-Name Form 10-Q
-Number 240
-Section 308
-Subsection a
| Name: |
dei_DocumentQuarterlyReport |
| Namespace Prefix: |
dei_ |
| Data Type: |
xbrli:booleanItemType |
| Balance Type: |
na |
| Period Type: |
duration |
|
| X |
- DefinitionBoolean flag that is true only for a form used as a transition report. Reference 1: http://www.xbrl.org/2003/role/presentationRef
-Publisher SEC
-Name Forms 10-K, 10-Q, 20-F
-Number 240
-Section 13
-Subsection a-1
| Name: |
dei_DocumentTransitionReport |
| Namespace Prefix: |
dei_ |
| Data Type: |
xbrli:booleanItemType |
| Balance Type: |
na |
| Period Type: |
duration |
|
| X |
- DefinitionThe type of document being provided (such as 10-K, 10-Q, 485BPOS, etc). The document type is limited to the same value as the supporting SEC submission type, or the word 'Other'.
| Name: |
dei_DocumentType |
| Namespace Prefix: |
dei_ |
| Data Type: |
dei:submissionTypeItemType |
| Balance Type: |
na |
| Period Type: |
duration |
|
| X |
- DefinitionAddress Line 1 such as Attn, Building Name, Street Name
| Name: |
dei_EntityAddressAddressLine1 |
| Namespace Prefix: |
dei_ |
| Data Type: |
xbrli:normalizedStringItemType |
| Balance Type: |
na |
| Period Type: |
duration |
|
| X |
- Definition
+ References
+ Details
| Name: |
dei_EntityAddressCityOrTown |
| Namespace Prefix: |
dei_ |
| Data Type: |
xbrli:normalizedStringItemType |
| Balance Type: |
na |
| Period Type: |
duration |
|
| X |
- DefinitionCode for the postal or zip code
| Name: |
dei_EntityAddressPostalZipCode |
| Namespace Prefix: |
dei_ |
| Data Type: |
xbrli:normalizedStringItemType |
| Balance Type: |
na |
| Period Type: |
duration |
|
| X |
- DefinitionName of the state or province.
| Name: |
dei_EntityAddressStateOrProvince |
| Namespace Prefix: |
dei_ |
| Data Type: |
dei:stateOrProvinceItemType |
| Balance Type: |
na |
| Period Type: |
duration |
|
| X |
- DefinitionA unique 10-digit SEC-issued value to identify entities that have filed disclosures with the SEC. It is commonly abbreviated as CIK. Reference 1: http://www.xbrl.org/2003/role/presentationRef
-Publisher SEC
-Name Exchange Act
-Number 240
-Section 12
-Subsection b-2
| Name: |
dei_EntityCentralIndexKey |
| Namespace Prefix: |
dei_ |
| Data Type: |
dei:centralIndexKeyItemType |
| Balance Type: |
na |
| Period Type: |
duration |
|
| X |
- DefinitionIndicate number of shares or other units outstanding of each of registrant's classes of capital or common stock or other ownership interests, if and as stated on cover of related periodic report. Where multiple classes or units exist define each class/interest by adding class of stock items such as Common Class A [Member], Common Class B [Member] or Partnership Interest [Member] onto the Instrument [Domain] of the Entity Listings, Instrument.
| Name: |
dei_EntityCommonStockSharesOutstanding |
| Namespace Prefix: |
dei_ |
| Data Type: |
xbrli:sharesItemType |
| Balance Type: |
na |
| Period Type: |
instant |
|
| X |
- DefinitionIndicate 'Yes' or 'No' whether registrants (1) have filed all reports required to be filed by Section 13 or 15(d) of the Securities Exchange Act of 1934 during the preceding 12 months (or for such shorter period that registrants were required to file such reports), and (2) have been subject to such filing requirements for the past 90 days. This information should be based on the registrant's current or most recent filing containing the related disclosure.
| Name: |
dei_EntityCurrentReportingStatus |
| Namespace Prefix: |
dei_ |
| Data Type: |
dei:yesNoItemType |
| Balance Type: |
na |
| Period Type: |
duration |
|
| X |
- DefinitionIndicate if registrant meets the emerging growth company criteria. Reference 1: http://www.xbrl.org/2003/role/presentationRef
-Publisher SEC
-Name Exchange Act
-Number 240
-Section 12
-Subsection b-2
| Name: |
dei_EntityEmergingGrowthCompany |
| Namespace Prefix: |
dei_ |
| Data Type: |
xbrli:booleanItemType |
| Balance Type: |
na |
| Period Type: |
duration |
|
| X |
- DefinitionCommission file number. The field allows up to 17 characters. The prefix may contain 1-3 digits, the sequence number may contain 1-8 digits, the optional suffix may contain 1-4 characters, and the fields are separated with a hyphen.
| Name: |
dei_EntityFileNumber |
| Namespace Prefix: |
dei_ |
| Data Type: |
dei:fileNumberItemType |
| Balance Type: |
na |
| Period Type: |
duration |
|
| X |
- DefinitionIndicate whether the registrant is one of the following: Large Accelerated Filer, Accelerated Filer, Non-accelerated Filer. Definitions of these categories are stated in Rule 12b-2 of the Exchange Act. This information should be based on the registrant's current or most recent filing containing the related disclosure. Reference 1: http://www.xbrl.org/2003/role/presentationRef
-Publisher SEC
-Name Exchange Act
-Number 240
-Section 12
-Subsection b-2
| Name: |
dei_EntityFilerCategory |
| Namespace Prefix: |
dei_ |
| Data Type: |
dei:filerCategoryItemType |
| Balance Type: |
na |
| Period Type: |
duration |
|
| X |
- DefinitionTwo-character EDGAR code representing the state or country of incorporation.
| Name: |
dei_EntityIncorporationStateCountryCode |
| Namespace Prefix: |
dei_ |
| Data Type: |
dei:edgarStateCountryItemType |
| Balance Type: |
na |
| Period Type: |
duration |
|
| X |
- DefinitionBoolean flag that is true when the registrant has submitted electronically every Interactive Data File required to be submitted pursuant to Rule 405 of Regulation S-T during the preceding 12 months (or for such shorter period that the registrant was required to submit such files). Reference 1: http://www.xbrl.org/2003/role/presentationRef
-Publisher SEC
-Name Regulation S-T
-Number 232
-Section 405
| Name: |
dei_EntityInteractiveDataCurrent |
| Namespace Prefix: |
dei_ |
| Data Type: |
dei:yesNoItemType |
| Balance Type: |
na |
| Period Type: |
duration |
|
| X |
- DefinitionThe exact name of the entity filing the report as specified in its charter, which is required by forms filed with the SEC. Reference 1: http://www.xbrl.org/2003/role/presentationRef
-Publisher SEC
-Name Exchange Act
-Number 240
-Section 12
-Subsection b-2
| Name: |
dei_EntityRegistrantName |
| Namespace Prefix: |
dei_ |
| Data Type: |
xbrli:normalizedStringItemType |
| Balance Type: |
na |
| Period Type: |
duration |
|
| X |
- DefinitionBoolean flag that is true when the registrant is a shell company as defined in Rule 12b-2 of the Exchange Act. Reference 1: http://www.xbrl.org/2003/role/presentationRef
-Publisher SEC
-Name Exchange Act
-Number 240
-Section 12
-Subsection b-2
| Name: |
dei_EntityShellCompany |
| Namespace Prefix: |
dei_ |
| Data Type: |
xbrli:booleanItemType |
| Balance Type: |
na |
| Period Type: |
duration |
|
| X |
- DefinitionIndicates that the company is a Smaller Reporting Company (SRC). Reference 1: http://www.xbrl.org/2003/role/presentationRef
-Publisher SEC
-Name Exchange Act
-Number 240
-Section 12
-Subsection b-2
| Name: |
dei_EntitySmallBusiness |
| Namespace Prefix: |
dei_ |
| Data Type: |
xbrli:booleanItemType |
| Balance Type: |
na |
| Period Type: |
duration |
|
| X |
- DefinitionThe Tax Identification Number (TIN), also known as an Employer Identification Number (EIN), is a unique 9-digit value assigned by the IRS. Reference 1: http://www.xbrl.org/2003/role/presentationRef
-Publisher SEC
-Name Exchange Act
-Number 240
-Section 12
-Subsection b-2
| Name: |
dei_EntityTaxIdentificationNumber |
| Namespace Prefix: |
dei_ |
| Data Type: |
dei:employerIdItemType |
| Balance Type: |
na |
| Period Type: |
duration |
|
| X |
- DefinitionLocal phone number for entity.
| Name: |
dei_LocalPhoneNumber |
| Namespace Prefix: |
dei_ |
| Data Type: |
xbrli:normalizedStringItemType |
| Balance Type: |
na |
| Period Type: |
duration |
|
| X |
- DefinitionTitle of a 12(b) registered security. Reference 1: http://www.xbrl.org/2003/role/presentationRef
-Publisher SEC
-Name Exchange Act
-Number 240
-Section 12
-Subsection b
| Name: |
dei_Security12bTitle |
| Namespace Prefix: |
dei_ |
| Data Type: |
dei:securityTitleItemType |
| Balance Type: |
na |
| Period Type: |
duration |
|
| X |
- DefinitionName of the Exchange on which a security is registered. Reference 1: http://www.xbrl.org/2003/role/presentationRef
-Publisher SEC
-Name Exchange Act
-Number 240
-Section 12
-Subsection d1-1
| Name: |
dei_SecurityExchangeName |
| Namespace Prefix: |
dei_ |
| Data Type: |
dei:edgarExchangeCodeItemType |
| Balance Type: |
na |
| Period Type: |
duration |
|
| X |
- DefinitionTrading symbol of an instrument as listed on an exchange.
| Name: |
dei_TradingSymbol |
| Namespace Prefix: |
dei_ |
| Data Type: |
dei:tradingSymbolItemType |
| Balance Type: |
na |
| Period Type: |
duration |
|
v3.23.2
Consolidated Balance Sheets - USD ($)
$ in Thousands |
Jun. 30, 2023 |
Dec. 31, 2022 |
| Current assets: |
|
|
| Cash and cash equivalents |
$ 21,193
|
$ 19,232
|
| Accounts and other receivables, net |
79,139
|
84,544
|
| Income taxes recoverable |
1,216
|
733
|
| Inventories |
86,692
|
127,771
|
| Prepaid expenses and other |
10,214
|
10,304
|
| Total current assets |
198,454
|
242,584
|
| Property, plant and equipment, at cost |
545,048
|
531,921
|
| Less: accumulated depreciation |
(355,156)
|
(345,510)
|
| Net property, plant and equipment |
189,892
|
186,411
|
| Right-of-use leased assets |
12,794
|
14,021
|
| Identifiable intangible assets, net |
10,785
|
11,690
|
| Goodwill |
55,195
|
70,608
|
| Deferred Income Tax Assets, Net |
14,610
|
13,900
|
| Other assets |
3,139
|
2,879
|
| Total assets |
484,869
|
542,093
|
| Current liabilities: |
|
|
| Accounts payable |
82,290
|
114,938
|
| Accrued expenses |
23,501
|
31,603
|
| Lease liability, short-term |
2,163
|
2,035
|
| Income taxes payable |
579
|
1,137
|
| Total current liabilities |
108,533
|
149,713
|
| Lease liability, long-term |
11,991
|
12,738
|
| Long-term debt |
141,000
|
137,000
|
| Pension and other postretirement benefit obligations, net |
35,747
|
35,046
|
| Other non-current liabilities |
4,449
|
5,834
|
| Total liabilities |
$ 301,720
|
340,331
|
| Common Stock, Shares Authorized |
150,000,000
|
|
| Shareholders’ equity: |
|
|
| Common stock, no par value (authorized shares 150,000,000, issued and outstanding 34,363,845 shares at June 30, 2023 and 34,000,642 shares at December 31, 2022) |
$ 60,078
|
58,824
|
| Common stock held in trust for savings restoration plan (116,336 shares at June 30, 2023 and 113,316 shares at December 31, 2022) |
(2,218)
|
(2,188)
|
| Foreign currency translation adjustment |
(83,338)
|
(86,079)
|
| Gain (loss) on derivative financial instruments |
(843)
|
(2,480)
|
| Pension and other postretirement benefit adjustments |
(54,463)
|
(59,036)
|
| Retained earnings |
263,933
|
292,721
|
| Total shareholders’ equity |
183,149
|
201,762
|
| Total liabilities and shareholders’ equity |
$ 484,869
|
$ 542,093
|
| X |
- DefinitionCarrying value as of the balance sheet date of liabilities incurred (and for which invoices have typically been received) and payable to vendors for goods and services received that are used in an entity's business. Used to reflect the current portion of the liabilities (due within one year or within the normal operating cycle if longer). Reference 1: http://www.xbrl.org/2003/role/exampleRef
-Topic 852
-SubTopic 10
-Name Accounting Standards Codification
-Section 55
-Paragraph 10
-Publisher FASB
-URI https://asc.fasb.org//1943274/2147481372/852-10-55-10
Reference 2: http://fasb.org/us-gaap/role/ref/legacyRef
-Name Accounting Standards Codification
-Topic 210
-SubTopic 10
-Section S99
-Paragraph 1
-Subparagraph (SX 210.5-02.19(a))
-Publisher FASB
-URI https://asc.fasb.org//1943274/2147480566/210-10-S99-1
| Name: |
us-gaap_AccountsPayableCurrent |
| Namespace Prefix: |
us-gaap_ |
| Data Type: |
xbrli:monetaryItemType |
| Balance Type: |
credit |
| Period Type: |
instant |
|
| X |
- DefinitionAmount, after allowance for credit loss, of right to consideration from customer for product sold and service rendered in normal course of business. Reference 1: http://www.xbrl.org/2003/role/exampleRef
-Topic 946
-SubTopic 310
-Name Accounting Standards Codification
-Section 45
-Paragraph 1
-Subparagraph (d)
-Publisher FASB
-URI https://asc.fasb.org//1943274/2147480833/946-310-45-1
Reference 2: http://www.xbrl.org/2009/role/commonPracticeRef
-Topic 944
-SubTopic 210
-Name Accounting Standards Codification
-Section S99
-Paragraph 1
-Subparagraph (SX 210.7-03(a)(5))
-Publisher FASB
-URI https://asc.fasb.org//1943274/2147479440/944-210-S99-1
Reference 3: http://www.xbrl.org/2003/role/disclosureRef
-Topic 946
-SubTopic 210
-Name Accounting Standards Codification
-Section S99
-Paragraph 1
-Subparagraph (SX 210.6-04(5)(b))
-Publisher FASB
-URI https://asc.fasb.org//1943274/2147479617/946-210-S99-1
Reference 4: http://www.xbrl.org/2003/role/disclosureRef
-Topic 954
-SubTopic 310
-Name Accounting Standards Codification
-Section 45
-Paragraph 1
-Publisher FASB
-URI https://asc.fasb.org//1943274/2147481058/954-310-45-1
| Name: |
us-gaap_AccountsReceivableNet |
| Namespace Prefix: |
us-gaap_ |
| Data Type: |
xbrli:monetaryItemType |
| Balance Type: |
debit |
| Period Type: |
instant |
|
| X |
- DefinitionCarrying value as of the balance sheet date of obligations incurred and payable, pertaining to costs that are statutory in nature, are incurred on contractual obligations, or accumulate over time and for which invoices have not yet been received or will not be rendered. Examples include taxes, interest, rent and utilities. Used to reflect the current portion of the liabilities (due within one year or within the normal operating cycle if longer). Reference 1: http://fasb.org/us-gaap/role/ref/legacyRef
-Name Accounting Standards Codification
-Topic 210
-SubTopic 10
-Section S99
-Paragraph 1
-Subparagraph (SX 210.5-02.20)
-Publisher FASB
-URI https://asc.fasb.org//1943274/2147480566/210-10-S99-1
| Name: |
us-gaap_AccruedLiabilitiesCurrent |
| Namespace Prefix: |
us-gaap_ |
| Data Type: |
xbrli:monetaryItemType |
| Balance Type: |
credit |
| Period Type: |
instant |
|
| X |
- DefinitionAmount of accumulated depreciation, depletion and amortization for physical assets used in the normal conduct of business to produce goods and services. Reference 1: http://www.xbrl.org/2003/role/disclosureRef
-Topic 944
-SubTopic 210
-Name Accounting Standards Codification
-Section S99
-Paragraph 1
-Subparagraph (SX 210.7-03(a)(8)(b))
-Publisher FASB
-URI https://asc.fasb.org//1943274/2147479440/944-210-S99-1
Reference 2: http://www.xbrl.org/2003/role/disclosureRef
-Topic 210
-SubTopic 10
-Name Accounting Standards Codification
-Section S99
-Paragraph 1
-Subparagraph (SX 210.5-02(14))
-Publisher FASB
-URI https://asc.fasb.org//1943274/2147480566/210-10-S99-1
Reference 3: http://fasb.org/us-gaap/role/ref/legacyRef
-Name Accounting Standards Codification
-Topic 360
-SubTopic 10
-Section 50
-Paragraph 1
-Subparagraph (c)
-Publisher FASB
-URI https://asc.fasb.org//1943274/2147482099/360-10-50-1
| Name: |
us-gaap_AccumulatedDepreciationDepletionAndAmortizationPropertyPlantAndEquipment |
| Namespace Prefix: |
us-gaap_ |
| Data Type: |
xbrli:monetaryItemType |
| Balance Type: |
credit |
| Period Type: |
instant |
|
| X |
- DefinitionAmount, after tax, of accumulated other comprehensive (income) loss for defined benefit plan, that has not been recognized in net periodic benefit cost (credit). Reference 1: http://fasb.org/us-gaap/role/ref/legacyRef
-Name Accounting Standards Codification
-Topic 220
-SubTopic 10
-Section 45
-Paragraph 14A
-Publisher FASB
-URI https://asc.fasb.org//1943274/2147482790/220-10-45-14A
Reference 2: http://fasb.org/us-gaap/role/ref/legacyRef
-Name Accounting Standards Codification
-Section 45
-Paragraph 10A
-Subparagraph (i-k)
-SubTopic 10
-Topic 220
-Publisher FASB
-URI https://asc.fasb.org//1943274/2147482790/220-10-45-10A
Reference 3: http://www.xbrl.org/2009/role/commonPracticeRef
-Topic 715
-SubTopic 20
-Name Accounting Standards Codification
-Section 50
-Paragraph 1
-Subparagraph (j)
-Publisher FASB
-URI https://asc.fasb.org//1943274/2147480506/715-20-50-1
| Name: |
us-gaap_AccumulatedOtherComprehensiveIncomeLossDefinedBenefitPensionAndOtherPostretirementPlansNetOfTax |
| Namespace Prefix: |
us-gaap_ |
| Data Type: |
xbrli:monetaryItemType |
| Balance Type: |
debit |
| Period Type: |
instant |
|
| X |
- DefinitionAccumulated adjustment, net of tax, that results from the process of translating subsidiary financial statements and foreign equity investments into the reporting currency from the functional currency of the reporting entity, net of reclassification of realized foreign currency translation gains or losses. Reference 1: http://www.xbrl.org/2003/role/disclosureRef
-Topic 220
-SubTopic 10
-Name Accounting Standards Codification
-Section 45
-Paragraph 11
-Publisher FASB
-URI https://asc.fasb.org//1943274/2147482790/220-10-45-11
Reference 2: http://www.xbrl.org/2003/role/disclosureRef
-Topic 220
-SubTopic 10
-Name Accounting Standards Codification
-Section 45
-Paragraph 14A
-Publisher FASB
-URI https://asc.fasb.org//1943274/2147482790/220-10-45-14A
Reference 3: http://www.xbrl.org/2003/role/disclosureRef
-Topic 825
-SubTopic 10
-Name Accounting Standards Codification
-Section 45
-Paragraph 5A
-Publisher FASB
-URI https://asc.fasb.org//1943274/2147482736/825-10-45-5A
Reference 4: http://www.xbrl.org/2003/role/disclosureRef
-Topic 220
-SubTopic 10
-Name Accounting Standards Codification
-Section 45
-Paragraph 10A
-Subparagraph (a)
-Publisher FASB
-URI https://asc.fasb.org//1943274/2147482790/220-10-45-10A
Reference 5: http://www.xbrl.org/2003/role/disclosureRef
-Topic 220
-SubTopic 10
-Name Accounting Standards Codification
-Section 45
-Paragraph 14
-Publisher FASB
-URI https://asc.fasb.org//1943274/2147482790/220-10-45-14
| Name: |
us-gaap_AccumulatedOtherComprehensiveIncomeLossForeignCurrencyTranslationAdjustmentNetOfTax |
| Namespace Prefix: |
us-gaap_ |
| Data Type: |
xbrli:monetaryItemType |
| Balance Type: |
credit |
| Period Type: |
instant |
|
| X |
- DefinitionAmount, after tax, of accumulated gain (loss) on derivative instrument designated and qualifying as cash flow hedge included in assessment of hedge effectiveness. Reference 1: http://www.xbrl.org/2003/role/disclosureRef
-Topic 220
-SubTopic 10
-Name Accounting Standards Codification
-Section 45
-Paragraph 11
-Publisher FASB
-URI https://asc.fasb.org//1943274/2147482790/220-10-45-11
| Name: |
us-gaap_AociLossCashFlowHedgeCumulativeGainLossAfterTax |
| Namespace Prefix: |
us-gaap_ |
| Data Type: |
xbrli:monetaryItemType |
| Balance Type: |
credit |
| Period Type: |
instant |
|
| X |
- DefinitionSum of the carrying amounts as of the balance sheet date of all assets that are recognized. Assets are probable future economic benefits obtained or controlled by an entity as a result of past transactions or events. Reference 1: http://www.xbrl.org/2003/role/disclosureRef
-Topic 810
-SubTopic 10
-Name Accounting Standards Codification
-Section 50
-Paragraph 3
-Subparagraph (bb)
-Publisher FASB
-URI https://asc.fasb.org//1943274/2147481203/810-10-50-3
Reference 2: http://www.xbrl.org/2003/role/disclosureRef
-Topic 810
-SubTopic 10
-Name Accounting Standards Codification
-Section 45
-Paragraph 25
-Subparagraph (a)
-Publisher FASB
-URI https://asc.fasb.org//1943274/2147481231/810-10-45-25
Reference 3: http://www.xbrl.org/2003/role/disclosureRef
-Topic 235
-SubTopic 10
-Name Accounting Standards Codification
-Section S99
-Paragraph 1
-Subparagraph (SX 210.4-08(g)(1)(ii))
-Publisher FASB
-URI https://asc.fasb.org//1943274/2147480678/235-10-S99-1
Reference 4: http://www.xbrl.org/2003/role/disclosureRef
-Topic 323
-SubTopic 10
-Name Accounting Standards Codification
-Section 50
-Paragraph 3
-Subparagraph (c)
-Publisher FASB
-URI https://asc.fasb.org//1943274/2147481687/323-10-50-3
Reference 5: http://www.xbrl.org/2003/role/disclosureRef
-Topic 825
-SubTopic 10
-Name Accounting Standards Codification
-Section 50
-Paragraph 28
-Subparagraph (f)
-Publisher FASB
-URI https://asc.fasb.org//1943274/2147482907/825-10-50-28
Reference 6: http://www.xbrl.org/2003/role/exampleRef
-Topic 852
-SubTopic 10
-Name Accounting Standards Codification
-Section 55
-Paragraph 10
-Publisher FASB
-URI https://asc.fasb.org//1943274/2147481372/852-10-55-10
Reference 7: http://www.xbrl.org/2003/role/exampleRef
-Topic 946
-SubTopic 830
-Name Accounting Standards Codification
-Section 55
-Paragraph 12
-Publisher FASB
-URI https://asc.fasb.org//1943274/2147480167/946-830-55-12
Reference 8: http://www.xbrl.org/2003/role/disclosureRef
-Topic 944
-SubTopic 210
-Name Accounting Standards Codification
-Section S99
-Paragraph 1
-Subparagraph (SX 210.7-03(a)(12))
-Publisher FASB
-URI https://asc.fasb.org//1943274/2147479440/944-210-S99-1
Reference 9: http://www.xbrl.org/2003/role/disclosureRef
-Topic 280
-SubTopic 10
-Name Accounting Standards Codification
-Section 50
-Paragraph 22
-Publisher FASB
-URI https://asc.fasb.org//1943274/2147482810/280-10-50-22
Reference 10: http://www.xbrl.org/2003/role/disclosureRef
-Topic 946
-SubTopic 210
-Name Accounting Standards Codification
-Section S99
-Paragraph 1
-Subparagraph (SX 210.6-04(8))
-Publisher FASB
-URI https://asc.fasb.org//1943274/2147479617/946-210-S99-1
Reference 11: http://www.xbrl.org/2003/role/disclosureRef
-Topic 210
-SubTopic 10
-Name Accounting Standards Codification
-Section S99
-Paragraph 1
-Subparagraph (SX 210.5-02(18))
-Publisher FASB
-URI https://asc.fasb.org//1943274/2147480566/210-10-S99-1
Reference 12: http://www.xbrl.org/2003/role/disclosureRef
-Topic 470
-SubTopic 10
-Name Accounting Standards Codification
-Section S99
-Paragraph 1A
-Subparagraph (SX 210.13-01(a)(4)(i))
-Publisher FASB
-URI https://asc.fasb.org//1943274/2147480097/470-10-S99-1A
Reference 13: http://www.xbrl.org/2009/role/commonPracticeRef
-Topic 470
-SubTopic 10
-Name Accounting Standards Codification
-Section S99
-Paragraph 1A
-Subparagraph (SX 210.13-01(a)(4)(ii))
-Publisher FASB
-URI https://asc.fasb.org//1943274/2147480097/470-10-S99-1A
Reference 14: http://www.xbrl.org/2009/role/commonPracticeRef
-Topic 470
-SubTopic 10
-Name Accounting Standards Codification
-Section S99
-Paragraph 1A
-Subparagraph (SX 210.13-01(a)(4)(iii))
-Publisher FASB
-URI https://asc.fasb.org//1943274/2147480097/470-10-S99-1A
Reference 15: http://www.xbrl.org/2003/role/disclosureRef
-Topic 470
-SubTopic 10
-Name Accounting Standards Codification
-Section S99
-Paragraph 1A
-Subparagraph (SX 210.13-01(a)(4)(iii)(A))
-Publisher FASB
-URI https://asc.fasb.org//1943274/2147480097/470-10-S99-1A
Reference 16: http://www.xbrl.org/2003/role/disclosureRef
-Topic 470
-SubTopic 10
-Name Accounting Standards Codification
-Section S99
-Paragraph 1A
-Subparagraph (SX 210.13-01(a)(4)(iv))
-Publisher FASB
-URI https://asc.fasb.org//1943274/2147480097/470-10-S99-1A
Reference 17: http://www.xbrl.org/2003/role/disclosureRef
-Topic 470
-SubTopic 10
-Name Accounting Standards Codification
-Section S99
-Paragraph 1A
-Subparagraph (SX 210.13-01(a)(5))
-Publisher FASB
-URI https://asc.fasb.org//1943274/2147480097/470-10-S99-1A
Reference 18: http://www.xbrl.org/2003/role/disclosureRef
-Topic 470
-SubTopic 10
-Name Accounting Standards Codification
-Section S99
-Paragraph 1B
-Subparagraph (SX 210.13-02(a)(4)(i))
-Publisher FASB
-URI https://asc.fasb.org//1943274/2147480097/470-10-S99-1B
Reference 19: http://www.xbrl.org/2003/role/disclosureRef
-Topic 470
-SubTopic 10
-Name Accounting Standards Codification
-Section S99
-Paragraph 1B
-Subparagraph (SX 210.13-02(a)(4)(iii)(A))
-Publisher FASB
-URI https://asc.fasb.org//1943274/2147480097/470-10-S99-1B
Reference 20: http://www.xbrl.org/2003/role/disclosureRef
-Topic 470
-SubTopic 10
-Name Accounting Standards Codification
-Section S99
-Paragraph 1B
-Subparagraph (SX 210.13-02(a)(4)(iii)(B))
-Publisher FASB
-URI https://asc.fasb.org//1943274/2147480097/470-10-S99-1B
Reference 21: http://www.xbrl.org/2003/role/disclosureRef
-Topic 470
-SubTopic 10
-Name Accounting Standards Codification
-Section S99
-Paragraph 1B
-Subparagraph (SX 210.13-02(a)(4)(iv))
-Publisher FASB
-URI https://asc.fasb.org//1943274/2147480097/470-10-S99-1B
Reference 22: http://www.xbrl.org/2003/role/disclosureRef
-Topic 470
-SubTopic 10
-Name Accounting Standards Codification
-Section S99
-Paragraph 1B
-Subparagraph (SX 210.13-02(a)(5))
-Publisher FASB
-URI https://asc.fasb.org//1943274/2147480097/470-10-S99-1B
Reference 23: http://www.xbrl.org/2009/role/commonPracticeRef
-Topic 852
-SubTopic 10
-Name Accounting Standards Codification
-Section 50
-Paragraph 7
-Subparagraph (a)
-Publisher FASB
-URI https://asc.fasb.org//1943274/2147481404/852-10-50-7
Reference 24: http://www.xbrl.org/2003/role/disclosureRef
-Topic 280
-SubTopic 10
-Name Accounting Standards Codification
-Section 50
-Paragraph 30
-Subparagraph (c)
-Publisher FASB
-URI https://asc.fasb.org//1943274/2147482810/280-10-50-30
Reference 25: http://www.xbrl.org/2003/role/disclosureRef
-Topic 280
-SubTopic 10
-Name Accounting Standards Codification
-Section 50
-Paragraph 32
-Subparagraph (d)
-Publisher FASB
-URI https://asc.fasb.org//1943274/2147482810/280-10-50-32
Reference 26: http://fasb.org/us-gaap/role/ref/legacyRef
-Topic 942
-SubTopic 210
-Name Accounting Standards Codification
-Section S99
-Paragraph 1
-Subparagraph (SX 210.9-03(11))
-Publisher FASB
-URI https://asc.fasb.org//1943274/2147479853/942-210-S99-1
| Name: |
us-gaap_Assets |
| Namespace Prefix: |
us-gaap_ |
| Data Type: |
xbrli:monetaryItemType |
| Balance Type: |
debit |
| Period Type: |
instant |
|
| X |
- DefinitionSum of the carrying amounts as of the balance sheet date of all assets that are expected to be realized in cash, sold, or consumed within one year (or the normal operating cycle, if longer). Assets are probable future economic benefits obtained or controlled by an entity as a result of past transactions or events. Reference 1: http://www.xbrl.org/2003/role/disclosureRef
-Topic 810
-SubTopic 10
-Name Accounting Standards Codification
-Section 50
-Paragraph 3
-Subparagraph (bb)
-Publisher FASB
-URI https://asc.fasb.org//1943274/2147481203/810-10-50-3
Reference 2: http://www.xbrl.org/2003/role/disclosureRef
-Topic 810
-SubTopic 10
-Name Accounting Standards Codification
-Section 45
-Paragraph 25
-Subparagraph (a)
-Publisher FASB
-URI https://asc.fasb.org//1943274/2147481231/810-10-45-25
Reference 3: http://www.xbrl.org/2003/role/disclosureRef
-Topic 235
-SubTopic 10
-Name Accounting Standards Codification
-Section S99
-Paragraph 1
-Subparagraph (SX 210.4-08(g)(1)(ii))
-Publisher FASB
-URI https://asc.fasb.org//1943274/2147480678/235-10-S99-1
Reference 4: http://www.xbrl.org/2003/role/disclosureRef
-Topic 323
-SubTopic 10
-Name Accounting Standards Codification
-Section 50
-Paragraph 3
-Subparagraph (c)
-Publisher FASB
-URI https://asc.fasb.org//1943274/2147481687/323-10-50-3
Reference 5: http://www.xbrl.org/2003/role/disclosureRef
-Topic 825
-SubTopic 10
-Name Accounting Standards Codification
-Section 50
-Paragraph 28
-Subparagraph (f)
-Publisher FASB
-URI https://asc.fasb.org//1943274/2147482907/825-10-50-28
Reference 6: http://www.xbrl.org/2003/role/exampleRef
-Topic 852
-SubTopic 10
-Name Accounting Standards Codification
-Section 55
-Paragraph 10
-Publisher FASB
-URI https://asc.fasb.org//1943274/2147481372/852-10-55-10
Reference 7: http://www.xbrl.org/2003/role/disclosureRef
-Topic 210
-SubTopic 10
-Name Accounting Standards Codification
-Section 45
-Paragraph 1
-Publisher FASB
-URI https://asc.fasb.org//1943274/2147483467/210-10-45-1
Reference 8: http://www.xbrl.org/2003/role/disclosureRef
-Topic 210
-SubTopic 10
-Name Accounting Standards Codification
-Section S99
-Paragraph 1
-Subparagraph (SX 210.5-02(9))
-Publisher FASB
-URI https://asc.fasb.org//1943274/2147480566/210-10-S99-1
Reference 9: http://www.xbrl.org/2003/role/disclosureRef
-Topic 470
-SubTopic 10
-Name Accounting Standards Codification
-Section S99
-Paragraph 1A
-Subparagraph (SX 210.13-01(a)(4)(i))
-Publisher FASB
-URI https://asc.fasb.org//1943274/2147480097/470-10-S99-1A
Reference 10: http://www.xbrl.org/2009/role/commonPracticeRef
-Topic 470
-SubTopic 10
-Name Accounting Standards Codification
-Section S99
-Paragraph 1A
-Subparagraph (SX 210.13-01(a)(4)(ii))
-Publisher FASB
-URI https://asc.fasb.org//1943274/2147480097/470-10-S99-1A
Reference 11: http://www.xbrl.org/2009/role/commonPracticeRef
-Topic 470
-SubTopic 10
-Name Accounting Standards Codification
-Section S99
-Paragraph 1A
-Subparagraph (SX 210.13-01(a)(4)(iii))
-Publisher FASB
-URI https://asc.fasb.org//1943274/2147480097/470-10-S99-1A
Reference 12: http://www.xbrl.org/2003/role/disclosureRef
-Topic 470
-SubTopic 10
-Name Accounting Standards Codification
-Section S99
-Paragraph 1A
-Subparagraph (SX 210.13-01(a)(4)(iii)(A))
-Publisher FASB
-URI https://asc.fasb.org//1943274/2147480097/470-10-S99-1A
Reference 13: http://www.xbrl.org/2003/role/disclosureRef
-Topic 470
-SubTopic 10
-Name Accounting Standards Codification
-Section S99
-Paragraph 1A
-Subparagraph (SX 210.13-01(a)(4)(iv))
-Publisher FASB
-URI https://asc.fasb.org//1943274/2147480097/470-10-S99-1A
Reference 14: http://www.xbrl.org/2003/role/disclosureRef
-Topic 470
-SubTopic 10
-Name Accounting Standards Codification
-Section S99
-Paragraph 1A
-Subparagraph (SX 210.13-01(a)(5))
-Publisher FASB
-URI https://asc.fasb.org//1943274/2147480097/470-10-S99-1A
Reference 15: http://www.xbrl.org/2003/role/disclosureRef
-Topic 470
-SubTopic 10
-Name Accounting Standards Codification
-Section S99
-Paragraph 1B
-Subparagraph (SX 210.13-02(a)(4)(i))
-Publisher FASB
-URI https://asc.fasb.org//1943274/2147480097/470-10-S99-1B
Reference 16: http://www.xbrl.org/2003/role/disclosureRef
-Topic 470
-SubTopic 10
-Name Accounting Standards Codification
-Section S99
-Paragraph 1B
-Subparagraph (SX 210.13-02(a)(4)(iii)(A))
-Publisher FASB
-URI https://asc.fasb.org//1943274/2147480097/470-10-S99-1B
Reference 17: http://www.xbrl.org/2003/role/disclosureRef
-Topic 470
-SubTopic 10
-Name Accounting Standards Codification
-Section S99
-Paragraph 1B
-Subparagraph (SX 210.13-02(a)(4)(iii)(B))
-Publisher FASB
-URI https://asc.fasb.org//1943274/2147480097/470-10-S99-1B
Reference 18: http://www.xbrl.org/2003/role/disclosureRef
-Topic 470
-SubTopic 10
-Name Accounting Standards Codification
-Section S99
-Paragraph 1B
-Subparagraph (SX 210.13-02(a)(4)(iv))
-Publisher FASB
-URI https://asc.fasb.org//1943274/2147480097/470-10-S99-1B
Reference 19: http://www.xbrl.org/2003/role/disclosureRef
-Topic 470
-SubTopic 10
-Name Accounting Standards Codification
-Section S99
-Paragraph 1B
-Subparagraph (SX 210.13-02(a)(5))
-Publisher FASB
-URI https://asc.fasb.org//1943274/2147480097/470-10-S99-1B
Reference 20: http://www.xbrl.org/2009/role/commonPracticeRef
-Topic 852
-SubTopic 10
-Name Accounting Standards Codification
-Section 50
-Paragraph 7
-Subparagraph (a)
-Publisher FASB
-URI https://asc.fasb.org//1943274/2147481404/852-10-50-7
| Name: |
us-gaap_AssetsCurrent |
| Namespace Prefix: |
us-gaap_ |
| Data Type: |
xbrli:monetaryItemType |
| Balance Type: |
debit |
| Period Type: |
instant |
|
| X |
- References
+ Details
| Name: |
us-gaap_AssetsCurrentAbstract |
| Namespace Prefix: |
us-gaap_ |
| Data Type: |
xbrli:stringItemType |
| Balance Type: |
na |
| Period Type: |
duration |
|
| X |
- DefinitionAmount of cash and cash equivalents, and cash and cash equivalents restricted to withdrawal or usage. Excludes amount for disposal group and discontinued operations. Cash includes, but is not limited to, currency on hand, demand deposits with banks or financial institutions, and other accounts with general characteristics of demand deposits. Cash equivalents include, but are not limited to, short-term, highly liquid investments that are both readily convertible to known amounts of cash and so near their maturity that they present insignificant risk of changes in value because of changes in interest rates. Reference 1: http://www.xbrl.org/2003/role/disclosureRef
-Topic 230
-SubTopic 10
-Name Accounting Standards Codification
-Section 50
-Paragraph 8
-Publisher FASB
-URI https://asc.fasb.org//1943274/2147482913/230-10-50-8
Reference 2: http://fasb.org/us-gaap/role/ref/legacyRef
-Topic 230
-SubTopic 10
-Name Accounting Standards Codification
-Section 45
-Paragraph 24
-Publisher FASB
-URI https://asc.fasb.org//1943274/2147482740/230-10-45-24
Reference 3: http://fasb.org/us-gaap/role/ref/legacyRef
-Name Accounting Standards Codification
-Topic 230
-SubTopic 10
-Section 45
-Paragraph 4
-Publisher FASB
-URI https://asc.fasb.org//1943274/2147482740/230-10-45-4
| Name: |
us-gaap_CashCashEquivalentsRestrictedCashAndRestrictedCashEquivalents |
| Namespace Prefix: |
us-gaap_ |
| Data Type: |
xbrli:monetaryItemType |
| Balance Type: |
debit |
| Period Type: |
instant |
|
| X |
- DefinitionValue of common stock held in trust.
| Name: |
us-gaap_CommonStockHeldInTrust |
| Namespace Prefix: |
us-gaap_ |
| Data Type: |
xbrli:monetaryItemType |
| Balance Type: |
debit |
| Period Type: |
instant |
|
| X |
- DefinitionThe maximum number of common shares permitted to be issued by an entity's charter and bylaws. Reference 1: http://www.xbrl.org/2003/role/disclosureRef
-Topic 946
-SubTopic 210
-Name Accounting Standards Codification
-Section S99
-Paragraph 1
-Subparagraph (SX 210.6-04(16)(a))
-Publisher FASB
-URI https://asc.fasb.org//1943274/2147479617/946-210-S99-1
Reference 2: http://fasb.org/us-gaap/role/ref/legacyRef
-Topic 210
-SubTopic 10
-Name Accounting Standards Codification
-Section S99
-Paragraph 1
-Subparagraph (SX 210.5-02(29))
-Publisher FASB
-URI https://asc.fasb.org//1943274/2147480566/210-10-S99-1
| Name: |
us-gaap_CommonStockSharesAuthorized |
| Namespace Prefix: |
us-gaap_ |
| Data Type: |
xbrli:sharesItemType |
| Balance Type: |
na |
| Period Type: |
instant |
|
| X |
- DefinitionAggregate par or stated value of issued nonredeemable common stock (or common stock redeemable solely at the option of the issuer). This item includes treasury stock repurchased by the entity. Note: elements for number of nonredeemable common shares, par value and other disclosure concepts are in another section within stockholders' equity. Reference 1: http://www.xbrl.org/2003/role/exampleRef
-Topic 852
-SubTopic 10
-Name Accounting Standards Codification
-Section 55
-Paragraph 10
-Publisher FASB
-URI https://asc.fasb.org//1943274/2147481372/852-10-55-10
Reference 2: http://www.xbrl.org/2003/role/disclosureRef
-Topic 944
-SubTopic 210
-Name Accounting Standards Codification
-Section S99
-Paragraph 1
-Subparagraph (SX 210.7-03(a)(22))
-Publisher FASB
-URI https://asc.fasb.org//1943274/2147479440/944-210-S99-1
Reference 3: http://fasb.org/us-gaap/role/ref/legacyRef
-Topic 210
-SubTopic 10
-Name Accounting Standards Codification
-Section S99
-Paragraph 1
-Subparagraph (SX 210.5-02(29))
-Publisher FASB
-URI https://asc.fasb.org//1943274/2147480566/210-10-S99-1
| Name: |
us-gaap_CommonStockValue |
| Namespace Prefix: |
us-gaap_ |
| Data Type: |
xbrli:monetaryItemType |
| Balance Type: |
credit |
| Period Type: |
instant |
|
| X |
- DefinitionAmount after accumulated impairment loss of an asset representing future economic benefits arising from other assets acquired in a business combination that are not individually identified and separately recognized. Reference 1: http://www.xbrl.org/2003/role/exampleRef
-Topic 852
-SubTopic 10
-Name Accounting Standards Codification
-Section 55
-Paragraph 10
-Publisher FASB
-URI https://asc.fasb.org//1943274/2147481372/852-10-55-10
Reference 2: http://www.xbrl.org/2003/role/exampleRef
-Topic 350
-SubTopic 20
-Name Accounting Standards Codification
-Section 55
-Paragraph 24
-Publisher FASB
-URI https://asc.fasb.org//1943274/2147482548/350-20-55-24
Reference 3: http://www.xbrl.org/2003/role/disclosureRef
-Topic 210
-SubTopic 10
-Name Accounting Standards Codification
-Section S99
-Paragraph 1
-Subparagraph (SX 210.5-02(15))
-Publisher FASB
-URI https://asc.fasb.org//1943274/2147480566/210-10-S99-1
Reference 4: http://www.xbrl.org/2003/role/disclosureRef
-Topic 350
-SubTopic 20
-Name Accounting Standards Codification
-Section 45
-Paragraph 1
-Publisher FASB
-URI https://asc.fasb.org//1943274/2147482598/350-20-45-1
Reference 5: http://www.xbrl.org/2009/role/commonPracticeRef
-Topic 350
-SubTopic 20
-Name Accounting Standards Codification
-Section 50
-Paragraph 1
-Subparagraph (a)
-Publisher FASB
-URI https://asc.fasb.org//1943274/2147482573/350-20-50-1
Reference 6: http://www.xbrl.org/2009/role/commonPracticeRef
-Topic 350
-SubTopic 20
-Name Accounting Standards Codification
-Section 50
-Paragraph 1
-Subparagraph (h)
-Publisher FASB
-URI https://asc.fasb.org//1943274/2147482573/350-20-50-1
Reference 7: http://www.xbrl.org/2003/role/disclosureRef
-Topic 942
-SubTopic 210
-Name Accounting Standards Codification
-Section S99
-Paragraph 1
-Subparagraph (SX 210.9-03(10)(1))
-Publisher FASB
-URI https://asc.fasb.org//1943274/2147479853/942-210-S99-1
| Name: |
us-gaap_Goodwill |
| Namespace Prefix: |
us-gaap_ |
| Data Type: |
xbrli:monetaryItemType |
| Balance Type: |
debit |
| Period Type: |
instant |
|
| X |
- DefinitionSum of the carrying amounts of all intangible assets, excluding goodwill, as of the balance sheet date, net of accumulated amortization and impairment charges. Reference 1: http://fasb.org/us-gaap/role/ref/legacyRef
-Name Accounting Standards Codification
-Topic 350
-SubTopic 30
-Section 50
-Paragraph 2
-Subparagraph ((a)(1),(b))
-Publisher FASB
-URI https://asc.fasb.org//1943274/2147482665/350-30-50-2
Reference 2: http://fasb.org/us-gaap/role/ref/legacyRef
-Name Accounting Standards Codification
-Topic 350
-SubTopic 30
-Section 45
-Paragraph 1
-Publisher FASB
-URI https://asc.fasb.org//1943274/2147482686/350-30-45-1
| Name: |
us-gaap_IntangibleAssetsNetExcludingGoodwill |
| Namespace Prefix: |
us-gaap_ |
| Data Type: |
xbrli:monetaryItemType |
| Balance Type: |
debit |
| Period Type: |
instant |
|
| X |
- DefinitionAmount after valuation and LIFO reserves of inventory expected to be sold, or consumed within one year or operating cycle, if longer. Reference 1: http://www.xbrl.org/2003/role/exampleRef
-Topic 852
-SubTopic 10
-Name Accounting Standards Codification
-Section 55
-Paragraph 10
-Publisher FASB
-URI https://asc.fasb.org//1943274/2147481372/852-10-55-10
Reference 2: http://www.xbrl.org/2003/role/exampleRef
-Topic 210
-SubTopic 10
-Name Accounting Standards Codification
-Section 45
-Paragraph 1
-Subparagraph (b)
-Publisher FASB
-URI https://asc.fasb.org//1943274/2147483467/210-10-45-1
Reference 3: http://www.xbrl.org/2003/role/disclosureRef
-Topic 210
-SubTopic 10
-Name Accounting Standards Codification
-Section S99
-Paragraph 1
-Subparagraph (SX 210.5-02(6))
-Publisher FASB
-URI https://asc.fasb.org//1943274/2147480566/210-10-S99-1
| Name: |
us-gaap_InventoryNet |
| Namespace Prefix: |
us-gaap_ |
| Data Type: |
xbrli:monetaryItemType |
| Balance Type: |
debit |
| Period Type: |
instant |
|
| X |
- DefinitionSum of the carrying amounts as of the balance sheet date of all liabilities that are recognized. Liabilities are probable future sacrifices of economic benefits arising from present obligations of an entity to transfer assets or provide services to other entities in the future. Reference 1: http://www.xbrl.org/2003/role/disclosureRef
-Topic 810
-SubTopic 10
-Name Accounting Standards Codification
-Section 50
-Paragraph 3
-Subparagraph (c)
-Publisher FASB
-URI https://asc.fasb.org//1943274/2147481203/810-10-50-3
Reference 2: http://www.xbrl.org/2003/role/disclosureRef
-Topic 810
-SubTopic 10
-Name Accounting Standards Codification
-Section 45
-Paragraph 25
-Subparagraph (b)
-Publisher FASB
-URI https://asc.fasb.org//1943274/2147481231/810-10-45-25
Reference 3: http://www.xbrl.org/2003/role/disclosureRef
-Topic 810
-SubTopic 10
-Name Accounting Standards Codification
-Section 50
-Paragraph 3
-Subparagraph (bb)
-Publisher FASB
-URI https://asc.fasb.org//1943274/2147481203/810-10-50-3
Reference 4: http://www.xbrl.org/2003/role/disclosureRef
-Topic 235
-SubTopic 10
-Name Accounting Standards Codification
-Section S99
-Paragraph 1
-Subparagraph (SX 210.4-08(g)(1)(ii))
-Publisher FASB
-URI https://asc.fasb.org//1943274/2147480678/235-10-S99-1
Reference 5: http://www.xbrl.org/2003/role/disclosureRef
-Topic 323
-SubTopic 10
-Name Accounting Standards Codification
-Section 50
-Paragraph 3
-Subparagraph (c)
-Publisher FASB
-URI https://asc.fasb.org//1943274/2147481687/323-10-50-3
Reference 6: http://www.xbrl.org/2003/role/disclosureRef
-Topic 825
-SubTopic 10
-Name Accounting Standards Codification
-Section 50
-Paragraph 28
-Subparagraph (f)
-Publisher FASB
-URI https://asc.fasb.org//1943274/2147482907/825-10-50-28
Reference 7: http://www.xbrl.org/2003/role/exampleRef
-Topic 946
-SubTopic 830
-Name Accounting Standards Codification
-Section 55
-Paragraph 12
-Publisher FASB
-URI https://asc.fasb.org//1943274/2147480167/946-830-55-12
Reference 8: http://www.xbrl.org/2003/role/disclosureRef
-Topic 946
-SubTopic 210
-Name Accounting Standards Codification
-Section S99
-Paragraph 1
-Subparagraph (SX 210.6-04(14))
-Publisher FASB
-URI https://asc.fasb.org//1943274/2147479617/946-210-S99-1
Reference 9: http://www.xbrl.org/2003/role/disclosureRef
-Topic 470
-SubTopic 10
-Name Accounting Standards Codification
-Section S99
-Paragraph 1A
-Subparagraph (SX 210.13-01(a)(4)(i))
-Publisher FASB
-URI https://asc.fasb.org//1943274/2147480097/470-10-S99-1A
Reference 10: http://www.xbrl.org/2009/role/commonPracticeRef
-Topic 470
-SubTopic 10
-Name Accounting Standards Codification
-Section S99
-Paragraph 1A
-Subparagraph (SX 210.13-01(a)(4)(ii))
-Publisher FASB
-URI https://asc.fasb.org//1943274/2147480097/470-10-S99-1A
Reference 11: http://www.xbrl.org/2003/role/disclosureRef
-Topic 470
-SubTopic 10
-Name Accounting Standards Codification
-Section S99
-Paragraph 1A
-Subparagraph (SX 210.13-01(a)(4)(iii)(A))
-Publisher FASB
-URI https://asc.fasb.org//1943274/2147480097/470-10-S99-1A
Reference 12: http://www.xbrl.org/2003/role/disclosureRef
-Topic 470
-SubTopic 10
-Name Accounting Standards Codification
-Section S99
-Paragraph 1A
-Subparagraph (SX 210.13-01(a)(4)(iv))
-Publisher FASB
-URI https://asc.fasb.org//1943274/2147480097/470-10-S99-1A
Reference 13: http://www.xbrl.org/2003/role/disclosureRef
-Topic 470
-SubTopic 10
-Name Accounting Standards Codification
-Section S99
-Paragraph 1A
-Subparagraph (SX 210.13-01(a)(5))
-Publisher FASB
-URI https://asc.fasb.org//1943274/2147480097/470-10-S99-1A
Reference 14: http://www.xbrl.org/2003/role/disclosureRef
-Topic 470
-SubTopic 10
-Name Accounting Standards Codification
-Section S99
-Paragraph 1B
-Subparagraph (SX 210.13-02(a)(4)(i))
-Publisher FASB
-URI https://asc.fasb.org//1943274/2147480097/470-10-S99-1B
Reference 15: http://www.xbrl.org/2003/role/disclosureRef
-Topic 470
-SubTopic 10
-Name Accounting Standards Codification
-Section S99
-Paragraph 1B
-Subparagraph (SX 210.13-02(a)(4)(iii)(A))
-Publisher FASB
-URI https://asc.fasb.org//1943274/2147480097/470-10-S99-1B
Reference 16: http://www.xbrl.org/2003/role/disclosureRef
-Topic 470
-SubTopic 10
-Name Accounting Standards Codification
-Section S99
-Paragraph 1B
-Subparagraph (SX 210.13-02(a)(4)(iii)(B))
-Publisher FASB
-URI https://asc.fasb.org//1943274/2147480097/470-10-S99-1B
Reference 17: http://www.xbrl.org/2003/role/disclosureRef
-Topic 470
-SubTopic 10
-Name Accounting Standards Codification
-Section S99
-Paragraph 1B
-Subparagraph (SX 210.13-02(a)(4)(iv))
-Publisher FASB
-URI https://asc.fasb.org//1943274/2147480097/470-10-S99-1B
Reference 18: http://www.xbrl.org/2003/role/disclosureRef
-Topic 470
-SubTopic 10
-Name Accounting Standards Codification
-Section S99
-Paragraph 1B
-Subparagraph (SX 210.13-02(a)(5))
-Publisher FASB
-URI https://asc.fasb.org//1943274/2147480097/470-10-S99-1B
Reference 19: http://www.xbrl.org/2009/role/commonPracticeRef
-Topic 852
-SubTopic 10
-Name Accounting Standards Codification
-Section 50
-Paragraph 7
-Subparagraph (a)
-Publisher FASB
-URI https://asc.fasb.org//1943274/2147481404/852-10-50-7
Reference 20: http://www.xbrl.org/2009/role/commonPracticeRef
-Topic 852
-SubTopic 10
-Name Accounting Standards Codification
-Section 50
-Paragraph 7
-Subparagraph (b)
-Publisher FASB
-URI https://asc.fasb.org//1943274/2147481404/852-10-50-7
Reference 21: http://www.xbrl.org/2003/role/exampleRef
-Topic 280
-SubTopic 10
-Name Accounting Standards Codification
-Section 50
-Paragraph 30
-Subparagraph (d)
-Publisher FASB
-URI https://asc.fasb.org//1943274/2147482810/280-10-50-30
Reference 22: http://fasb.org/us-gaap/role/ref/legacyRef
-Name Accounting Standards Codification
-Topic 210
-SubTopic 10
-Section S99
-Paragraph 1
-Subparagraph (SX 210.5-02.19-26)
-Publisher FASB
-URI https://asc.fasb.org//1943274/2147480566/210-10-S99-1
| Name: |
us-gaap_Liabilities |
| Namespace Prefix: |
us-gaap_ |
| Data Type: |
xbrli:monetaryItemType |
| Balance Type: |
credit |
| Period Type: |
instant |
|
| X |
- DefinitionAmount of liabilities and equity items, including the portion of equity attributable to noncontrolling interests, if any. Reference 1: http://www.xbrl.org/2003/role/exampleRef
-Topic 852
-SubTopic 10
-Name Accounting Standards Codification
-Section 55
-Paragraph 10
-Publisher FASB
-URI https://asc.fasb.org//1943274/2147481372/852-10-55-10
Reference 2: http://www.xbrl.org/2003/role/disclosureRef
-Topic 944
-SubTopic 210
-Name Accounting Standards Codification
-Section S99
-Paragraph 1
-Subparagraph (SX 210.7-03(a)(25))
-Publisher FASB
-URI https://asc.fasb.org//1943274/2147479440/944-210-S99-1
Reference 3: http://www.xbrl.org/2009/role/commonPracticeRef
-Topic 235
-SubTopic 10
-Name Accounting Standards Codification
-Section S99
-Paragraph 1
-Subparagraph (SX 210.4-08(g)(1)(ii))
-Publisher FASB
-URI https://asc.fasb.org//1943274/2147480678/235-10-S99-1
Reference 4: http://www.xbrl.org/2009/role/commonPracticeRef
-Topic 323
-SubTopic 10
-Name Accounting Standards Codification
-Section 50
-Paragraph 3
-Subparagraph (c)
-Publisher FASB
-URI https://asc.fasb.org//1943274/2147481687/323-10-50-3
Reference 5: http://www.xbrl.org/2009/role/commonPracticeRef
-Topic 825
-SubTopic 10
-Name Accounting Standards Codification
-Section 50
-Paragraph 28
-Subparagraph (f)
-Publisher FASB
-URI https://asc.fasb.org//1943274/2147482907/825-10-50-28
Reference 6: http://fasb.org/us-gaap/role/ref/legacyRef
-Topic 942
-SubTopic 210
-Name Accounting Standards Codification
-Section S99
-Paragraph 1
-Subparagraph (SX 210.9-03(23))
-Publisher FASB
-URI https://asc.fasb.org//1943274/2147479853/942-210-S99-1
Reference 7: http://fasb.org/us-gaap/role/ref/legacyRef
-Topic 210
-SubTopic 10
-Name Accounting Standards Codification
-Section S99
-Paragraph 1
-Subparagraph (SX 210.5-02(32))
-Publisher FASB
-URI https://asc.fasb.org//1943274/2147480566/210-10-S99-1
| Name: |
us-gaap_LiabilitiesAndStockholdersEquity |
| Namespace Prefix: |
us-gaap_ |
| Data Type: |
xbrli:monetaryItemType |
| Balance Type: |
credit |
| Period Type: |
instant |
|
| X |
- DefinitionTotal obligations incurred as part of normal operations that are expected to be paid during the following twelve months or within one business cycle, if longer. Reference 1: http://www.xbrl.org/2003/role/disclosureRef
-Topic 810
-SubTopic 10
-Name Accounting Standards Codification
-Section 50
-Paragraph 3
-Subparagraph (c)
-Publisher FASB
-URI https://asc.fasb.org//1943274/2147481203/810-10-50-3
Reference 2: http://www.xbrl.org/2003/role/disclosureRef
-Topic 810
-SubTopic 10
-Name Accounting Standards Codification
-Section 45
-Paragraph 25
-Subparagraph (b)
-Publisher FASB
-URI https://asc.fasb.org//1943274/2147481231/810-10-45-25
Reference 3: http://www.xbrl.org/2003/role/disclosureRef
-Topic 810
-SubTopic 10
-Name Accounting Standards Codification
-Section 50
-Paragraph 3
-Subparagraph (bb)
-Publisher FASB
-URI https://asc.fasb.org//1943274/2147481203/810-10-50-3
Reference 4: http://www.xbrl.org/2003/role/disclosureRef
-Topic 235
-SubTopic 10
-Name Accounting Standards Codification
-Section S99
-Paragraph 1
-Subparagraph (SX 210.4-08(g)(1)(ii))
-Publisher FASB
-URI https://asc.fasb.org//1943274/2147480678/235-10-S99-1
Reference 5: http://www.xbrl.org/2003/role/disclosureRef
-Topic 323
-SubTopic 10
-Name Accounting Standards Codification
-Section 50
-Paragraph 3
-Subparagraph (c)
-Publisher FASB
-URI https://asc.fasb.org//1943274/2147481687/323-10-50-3
Reference 6: http://www.xbrl.org/2003/role/disclosureRef
-Topic 825
-SubTopic 10
-Name Accounting Standards Codification
-Section 50
-Paragraph 28
-Subparagraph (f)
-Publisher FASB
-URI https://asc.fasb.org//1943274/2147482907/825-10-50-28
Reference 7: http://www.xbrl.org/2003/role/exampleRef
-Topic 852
-SubTopic 10
-Name Accounting Standards Codification
-Section 55
-Paragraph 10
-Publisher FASB
-URI https://asc.fasb.org//1943274/2147481372/852-10-55-10
Reference 8: http://www.xbrl.org/2003/role/disclosureRef
-Topic 210
-SubTopic 10
-Name Accounting Standards Codification
-Section 45
-Paragraph 5
-Publisher FASB
-URI https://asc.fasb.org//1943274/2147483467/210-10-45-5
Reference 9: http://www.xbrl.org/2003/role/disclosureRef
-Topic 470
-SubTopic 10
-Name Accounting Standards Codification
-Section S99
-Paragraph 1A
-Subparagraph (SX 210.13-01(a)(4)(i))
-Publisher FASB
-URI https://asc.fasb.org//1943274/2147480097/470-10-S99-1A
Reference 10: http://www.xbrl.org/2009/role/commonPracticeRef
-Topic 470
-SubTopic 10
-Name Accounting Standards Codification
-Section S99
-Paragraph 1A
-Subparagraph (SX 210.13-01(a)(4)(ii))
-Publisher FASB
-URI https://asc.fasb.org//1943274/2147480097/470-10-S99-1A
Reference 11: http://www.xbrl.org/2003/role/disclosureRef
-Topic 470
-SubTopic 10
-Name Accounting Standards Codification
-Section S99
-Paragraph 1A
-Subparagraph (SX 210.13-01(a)(4)(iii)(A))
-Publisher FASB
-URI https://asc.fasb.org//1943274/2147480097/470-10-S99-1A
Reference 12: http://www.xbrl.org/2003/role/disclosureRef
-Topic 470
-SubTopic 10
-Name Accounting Standards Codification
-Section S99
-Paragraph 1A
-Subparagraph (SX 210.13-01(a)(4)(iv))
-Publisher FASB
-URI https://asc.fasb.org//1943274/2147480097/470-10-S99-1A
Reference 13: http://www.xbrl.org/2003/role/disclosureRef
-Topic 470
-SubTopic 10
-Name Accounting Standards Codification
-Section S99
-Paragraph 1A
-Subparagraph (SX 210.13-01(a)(5))
-Publisher FASB
-URI https://asc.fasb.org//1943274/2147480097/470-10-S99-1A
Reference 14: http://www.xbrl.org/2003/role/disclosureRef
-Topic 470
-SubTopic 10
-Name Accounting Standards Codification
-Section S99
-Paragraph 1B
-Subparagraph (SX 210.13-02(a)(4)(i))
-Publisher FASB
-URI https://asc.fasb.org//1943274/2147480097/470-10-S99-1B
Reference 15: http://www.xbrl.org/2003/role/disclosureRef
-Topic 470
-SubTopic 10
-Name Accounting Standards Codification
-Section S99
-Paragraph 1B
-Subparagraph (SX 210.13-02(a)(4)(iii)(A))
-Publisher FASB
-URI https://asc.fasb.org//1943274/2147480097/470-10-S99-1B
Reference 16: http://www.xbrl.org/2003/role/disclosureRef
-Topic 470
-SubTopic 10
-Name Accounting Standards Codification
-Section S99
-Paragraph 1B
-Subparagraph (SX 210.13-02(a)(4)(iii)(B))
-Publisher FASB
-URI https://asc.fasb.org//1943274/2147480097/470-10-S99-1B
Reference 17: http://www.xbrl.org/2003/role/disclosureRef
-Topic 470
-SubTopic 10
-Name Accounting Standards Codification
-Section S99
-Paragraph 1B
-Subparagraph (SX 210.13-02(a)(4)(iv))
-Publisher FASB
-URI https://asc.fasb.org//1943274/2147480097/470-10-S99-1B
Reference 18: http://www.xbrl.org/2003/role/disclosureRef
-Topic 470
-SubTopic 10
-Name Accounting Standards Codification
-Section S99
-Paragraph 1B
-Subparagraph (SX 210.13-02(a)(5))
-Publisher FASB
-URI https://asc.fasb.org//1943274/2147480097/470-10-S99-1B
Reference 19: http://www.xbrl.org/2009/role/commonPracticeRef
-Topic 852
-SubTopic 10
-Name Accounting Standards Codification
-Section 50
-Paragraph 7
-Subparagraph (a)
-Publisher FASB
-URI https://asc.fasb.org//1943274/2147481404/852-10-50-7
Reference 20: http://www.xbrl.org/2009/role/commonPracticeRef
-Topic 852
-SubTopic 10
-Name Accounting Standards Codification
-Section 50
-Paragraph 7
-Subparagraph (b)
-Publisher FASB
-URI https://asc.fasb.org//1943274/2147481404/852-10-50-7
Reference 21: http://fasb.org/us-gaap/role/ref/legacyRef
-Name Accounting Standards Codification
-Topic 210
-SubTopic 10
-Section S99
-Paragraph 1
-Subparagraph (SX 210.5-02.21)
-Publisher FASB
-URI https://asc.fasb.org//1943274/2147480566/210-10-S99-1
| Name: |
us-gaap_LiabilitiesCurrent |
| Namespace Prefix: |
us-gaap_ |
| Data Type: |
xbrli:monetaryItemType |
| Balance Type: |
credit |
| Period Type: |
instant |
|
| X |
- References
+ Details
| Name: |
us-gaap_LiabilitiesCurrentAbstract |
| Namespace Prefix: |
us-gaap_ |
| Data Type: |
xbrli:stringItemType |
| Balance Type: |
na |
| Period Type: |
duration |
|
| X |
- DefinitionAmount, after deduction of unamortized premium (discount) and debt issuance cost, of long-term debt classified as noncurrent. Excludes lease obligation. Reference 1: http://www.xbrl.org/2003/role/disclosureRef
-Topic 210
-SubTopic 10
-Name Accounting Standards Codification
-Section S99
-Paragraph 1
-Subparagraph (SX 210.5-02(22))
-Publisher FASB
-URI https://asc.fasb.org//1943274/2147480566/210-10-S99-1
| Name: |
us-gaap_LongTermDebtNoncurrent |
| Namespace Prefix: |
us-gaap_ |
| Data Type: |
xbrli:monetaryItemType |
| Balance Type: |
credit |
| Period Type: |
instant |
|
| X |
- DefinitionPresent value of lessee's discounted obligation for lease payments from operating lease, classified as current. Reference 1: http://www.xbrl.org/2003/role/disclosureRef
-Topic 842
-SubTopic 20
-Name Accounting Standards Codification
-Section 45
-Paragraph 1
-Subparagraph (b)
-Publisher FASB
-URI https://asc.fasb.org//1943274/2147479041/842-20-45-1
| Name: |
us-gaap_OperatingLeaseLiabilityCurrent |
| Namespace Prefix: |
us-gaap_ |
| Data Type: |
xbrli:monetaryItemType |
| Balance Type: |
credit |
| Period Type: |
instant |
|
| X |
- DefinitionPresent value of lessee's discounted obligation for lease payments from operating lease, classified as noncurrent. Reference 1: http://www.xbrl.org/2003/role/disclosureRef
-Topic 842
-SubTopic 20
-Name Accounting Standards Codification
-Section 45
-Paragraph 1
-Subparagraph (b)
-Publisher FASB
-URI https://asc.fasb.org//1943274/2147479041/842-20-45-1
| Name: |
us-gaap_OperatingLeaseLiabilityNoncurrent |
| Namespace Prefix: |
us-gaap_ |
| Data Type: |
xbrli:monetaryItemType |
| Balance Type: |
credit |
| Period Type: |
instant |
|
| X |
- DefinitionAmount of lessee's right to use underlying asset under operating lease. Reference 1: http://www.xbrl.org/2003/role/disclosureRef
-Topic 842
-SubTopic 20
-Name Accounting Standards Codification
-Section 45
-Paragraph 1
-Subparagraph (a)
-Publisher FASB
-URI https://asc.fasb.org//1943274/2147479041/842-20-45-1
| Name: |
us-gaap_OperatingLeaseRightOfUseAsset |
| Namespace Prefix: |
us-gaap_ |
| Data Type: |
xbrli:monetaryItemType |
| Balance Type: |
debit |
| Period Type: |
instant |
|
| X |
- DefinitionAmount of noncurrent assets classified as other. Reference 1: http://www.xbrl.org/2003/role/disclosureRef
-Topic 210
-SubTopic 10
-Name Accounting Standards Codification
-Section S99
-Paragraph 1
-Subparagraph (SX 210.5-02(17))
-Publisher FASB
-URI https://asc.fasb.org//1943274/2147480566/210-10-S99-1
| Name: |
us-gaap_OtherAssetsNoncurrent |
| Namespace Prefix: |
us-gaap_ |
| Data Type: |
xbrli:monetaryItemType |
| Balance Type: |
debit |
| Period Type: |
instant |
|
| X |
- DefinitionAmount of liabilities classified as other, due after one year or the normal operating cycle, if longer. Reference 1: http://fasb.org/us-gaap/role/ref/legacyRef
-Name Accounting Standards Codification
-Topic 210
-SubTopic 10
-Section S99
-Paragraph 1
-Subparagraph (SX 210.5-02.24)
-Publisher FASB
-URI https://asc.fasb.org//1943274/2147480566/210-10-S99-1
| Name: |
us-gaap_OtherLiabilitiesNoncurrent |
| Namespace Prefix: |
us-gaap_ |
| Data Type: |
xbrli:monetaryItemType |
| Balance Type: |
credit |
| Period Type: |
instant |
|
| X |
- DefinitionAmount of liability, recognized in statement of financial position, for pension, other postretirement and postemployment benefits, classified as noncurrent. Reference 1: http://fasb.org/us-gaap/role/ref/legacyRef
-Topic 715
-SubTopic 20
-Name Accounting Standards Codification
-Section 45
-Paragraph 3
-Publisher FASB
-URI https://asc.fasb.org//1943274/2147480535/715-20-45-3
Reference 2: http://fasb.org/us-gaap/role/ref/legacyRef
-Topic 210
-SubTopic 10
-Name Accounting Standards Codification
-Section S99
-Paragraph 1
-Subparagraph (SX 210.5-02(24))
-Publisher FASB
-URI https://asc.fasb.org//1943274/2147480566/210-10-S99-1
Reference 3: http://fasb.org/us-gaap/role/ref/legacyRef
-Name Accounting Standards Codification
-Topic 715
-SubTopic 20
-Section 45
-Paragraph 2
-Publisher FASB
-URI https://asc.fasb.org//1943274/2147480535/715-20-45-2
Reference 4: http://fasb.org/us-gaap/role/ref/legacyRef
-Name Accounting Standards Codification
-Topic 715
-SubTopic 20
-Section 50
-Paragraph 1
-Subparagraph (c)
-Publisher FASB
-URI https://asc.fasb.org//1943274/2147480506/715-20-50-1
| Name: |
us-gaap_PensionAndOtherPostretirementAndPostemploymentBenefitPlansLiabilitiesNoncurrent |
| Namespace Prefix: |
us-gaap_ |
| Data Type: |
xbrli:monetaryItemType |
| Balance Type: |
credit |
| Period Type: |
instant |
|
| X |
- DefinitionAmount of asset related to consideration paid in advance for costs that provide economic benefits in future periods, and amount of other assets that are expected to be realized or consumed within one year or the normal operating cycle, if longer. Reference 1: http://www.xbrl.org/2009/role/commonPracticeRef
-Topic 210
-SubTopic 10
-Name Accounting Standards Codification
-Section S99
-Paragraph 1
-Subparagraph (SX 210.5-02(9))
-Publisher FASB
-URI https://asc.fasb.org//1943274/2147480566/210-10-S99-1
| Name: |
us-gaap_PrepaidExpenseAndOtherAssetsCurrent |
| Namespace Prefix: |
us-gaap_ |
| Data Type: |
xbrli:monetaryItemType |
| Balance Type: |
debit |
| Period Type: |
instant |
|
| X |
- DefinitionAmount before accumulated depreciation, depletion and amortization of physical assets used in the normal conduct of business and not intended for resale. Examples include, but are not limited to, land, buildings, machinery and equipment, office equipment, and furniture and fixtures. Reference 1: http://www.xbrl.org/2003/role/disclosureRef
-Topic 944
-SubTopic 210
-Name Accounting Standards Codification
-Section S99
-Paragraph 1
-Subparagraph (SX 210.7-03(a)(8))
-Publisher FASB
-URI https://asc.fasb.org//1943274/2147479440/944-210-S99-1
Reference 2: http://www.xbrl.org/2003/role/disclosureRef
-Topic 210
-SubTopic 10
-Name Accounting Standards Codification
-Section S99
-Paragraph 1
-Subparagraph (SX 210.5-02(13))
-Publisher FASB
-URI https://asc.fasb.org//1943274/2147480566/210-10-S99-1
Reference 3: http://fasb.org/us-gaap/role/ref/legacyRef
-Topic 360
-SubTopic 10
-Name Accounting Standards Codification
-Section 50
-Paragraph 1
-Subparagraph (b)
-Publisher FASB
-URI https://asc.fasb.org//1943274/2147482099/360-10-50-1
| Name: |
us-gaap_PropertyPlantAndEquipmentGross |
| Namespace Prefix: |
us-gaap_ |
| Data Type: |
xbrli:monetaryItemType |
| Balance Type: |
debit |
| Period Type: |
instant |
|
| X |
- DefinitionAmount after accumulated depreciation, depletion and amortization of physical assets used in the normal conduct of business to produce goods and services and not intended for resale. Examples include, but are not limited to, land, buildings, machinery and equipment, office equipment, and furniture and fixtures. Reference 1: http://fasb.org/us-gaap/role/ref/legacyRef
-Name Accounting Standards Codification
-Section 50
-Paragraph 1
-SubTopic 10
-Topic 360
-Publisher FASB
-URI https://asc.fasb.org//1943274/2147482099/360-10-50-1
Reference 2: http://www.xbrl.org/2003/role/exampleRef
-Topic 852
-SubTopic 10
-Name Accounting Standards Codification
-Section 55
-Paragraph 10
-Publisher FASB
-URI https://asc.fasb.org//1943274/2147481372/852-10-55-10
Reference 3: http://www.xbrl.org/2003/role/disclosureRef
-Topic 944
-SubTopic 210
-Name Accounting Standards Codification
-Section S99
-Paragraph 1
-Subparagraph (SX 210.7-03(a)(8))
-Publisher FASB
-URI https://asc.fasb.org//1943274/2147479440/944-210-S99-1
Reference 4: http://www.xbrl.org/2003/role/disclosureRef
-Topic 942
-SubTopic 360
-Name Accounting Standards Codification
-Section 50
-Paragraph 1
-Publisher FASB
-URI https://asc.fasb.org//1943274/2147480842/942-360-50-1
| Name: |
us-gaap_PropertyPlantAndEquipmentNet |
| Namespace Prefix: |
us-gaap_ |
| Data Type: |
xbrli:monetaryItemType |
| Balance Type: |
debit |
| Period Type: |
instant |
|
| X |
- DefinitionAmount of accumulated undistributed earnings (deficit). Reference 1: http://www.xbrl.org/2003/role/exampleRef
-Topic 852
-SubTopic 10
-Name Accounting Standards Codification
-Section 55
-Paragraph 10
-Publisher FASB
-URI https://asc.fasb.org//1943274/2147481372/852-10-55-10
Reference 2: http://www.xbrl.org/2003/role/disclosureRef
-Topic 944
-SubTopic 40
-Name Accounting Standards Codification
-Section 65
-Paragraph 2
-Subparagraph (g)(2)(i)
-Publisher FASB
-URI https://asc.fasb.org//1943274/2147480016/944-40-65-2
Reference 3: http://www.xbrl.org/2003/role/disclosureRef
-Topic 944
-SubTopic 40
-Name Accounting Standards Codification
-Section 65
-Paragraph 2
-Subparagraph (h)(2)
-Publisher FASB
-URI https://asc.fasb.org//1943274/2147480016/944-40-65-2
Reference 4: http://www.xbrl.org/2003/role/disclosureRef
-Topic 946
-SubTopic 20
-Name Accounting Standards Codification
-Section 50
-Paragraph 11
-Publisher FASB
-URI https://asc.fasb.org//1943274/2147480990/946-20-50-11
Reference 5: http://www.xbrl.org/2003/role/disclosureRef
-Topic 944
-SubTopic 210
-Name Accounting Standards Codification
-Section S99
-Paragraph 1
-Subparagraph (SX 210.7-03(a)(23)(a)(4))
-Publisher FASB
-URI https://asc.fasb.org//1943274/2147479440/944-210-S99-1
Reference 6: http://www.xbrl.org/2003/role/disclosureRef
-Topic 946
-SubTopic 210
-Name Accounting Standards Codification
-Section S99
-Paragraph 1
-Subparagraph (SX 210.6-04(17))
-Publisher FASB
-URI https://asc.fasb.org//1943274/2147479617/946-210-S99-1
Reference 7: http://fasb.org/us-gaap/role/ref/legacyRef
-Topic 505
-SubTopic 10
-Name Accounting Standards Codification
-Section S99
-Paragraph 1
-Subparagraph (SX 210.3-04)
-Publisher FASB
-URI https://asc.fasb.org//1943274/2147480008/505-10-S99-1
Reference 8: http://fasb.org/us-gaap/role/ref/legacyRef
-Topic 210
-SubTopic 10
-Name Accounting Standards Codification
-Section S99
-Paragraph 1
-Subparagraph (SX 210.5-02(30)(a)(3))
-Publisher FASB
-URI https://asc.fasb.org//1943274/2147480566/210-10-S99-1
| Name: |
us-gaap_RetainedEarningsAccumulatedDeficit |
| Namespace Prefix: |
us-gaap_ |
| Data Type: |
xbrli:monetaryItemType |
| Balance Type: |
credit |
| Period Type: |
instant |
|
| X |
- DefinitionAmount of equity (deficit) attributable to parent. Excludes temporary equity and equity attributable to noncontrolling interest. Reference 1: http://www.xbrl.org/2003/role/exampleRef
-Topic 852
-SubTopic 10
-Name Accounting Standards Codification
-Section 55
-Paragraph 10
-Publisher FASB
-URI https://asc.fasb.org//1943274/2147481372/852-10-55-10
Reference 2: http://www.xbrl.org/2003/role/exampleRef
-Topic 946
-SubTopic 830
-Name Accounting Standards Codification
-Section 55
-Paragraph 12
-Publisher FASB
-URI https://asc.fasb.org//1943274/2147480167/946-830-55-12
Reference 3: http://www.xbrl.org/2003/role/disclosureRef
-Topic 946
-SubTopic 210
-Name Accounting Standards Codification
-Section S99
-Paragraph 1
-Subparagraph (SX 210.6-04(19))
-Publisher FASB
-URI https://asc.fasb.org//1943274/2147479617/946-210-S99-1
Reference 4: http://www.xbrl.org/2003/role/disclosureRef
-Topic 946
-SubTopic 210
-Name Accounting Standards Codification
-Section S99
-Paragraph 2
-Subparagraph (SX 210.6-05(4))
-Publisher FASB
-URI https://asc.fasb.org//1943274/2147479617/946-210-S99-2
Reference 5: http://www.xbrl.org/2009/role/commonPracticeRef
-Topic 946
-SubTopic 220
-Name Accounting Standards Codification
-Section S99
-Paragraph 3
-Subparagraph (SX 210.6-09(4)(b))
-Publisher FASB
-URI https://asc.fasb.org//1943274/2147483575/946-220-S99-3
Reference 6: http://www.xbrl.org/2003/role/disclosureRef
-Topic 946
-SubTopic 220
-Name Accounting Standards Codification
-Section S99
-Paragraph 3
-Subparagraph (SX 210.6-09(6))
-Publisher FASB
-URI https://asc.fasb.org//1943274/2147483575/946-220-S99-3
Reference 7: http://www.xbrl.org/2003/role/disclosureRef
-Topic 946
-SubTopic 220
-Name Accounting Standards Codification
-Section S99
-Paragraph 3
-Subparagraph (SX 210.6-09(7))
-Publisher FASB
-URI https://asc.fasb.org//1943274/2147483575/946-220-S99-3
Reference 8: http://www.xbrl.org/2009/role/commonPracticeRef
-Topic 235
-SubTopic 10
-Name Accounting Standards Codification
-Section S99
-Paragraph 1
-Subparagraph (SX 210.4-08(g)(1)(ii))
-Publisher FASB
-URI https://asc.fasb.org//1943274/2147480678/235-10-S99-1
Reference 9: http://www.xbrl.org/2009/role/commonPracticeRef
-Topic 323
-SubTopic 10
-Name Accounting Standards Codification
-Section 50
-Paragraph 3
-Subparagraph (c)
-Publisher FASB
-URI https://asc.fasb.org//1943274/2147481687/323-10-50-3
Reference 10: http://www.xbrl.org/2009/role/commonPracticeRef
-Topic 825
-SubTopic 10
-Name Accounting Standards Codification
-Section 50
-Paragraph 28
-Subparagraph (f)
-Publisher FASB
-URI https://asc.fasb.org//1943274/2147482907/825-10-50-28
Reference 11: http://fasb.org/us-gaap/role/ref/legacyRef
-Topic 210
-SubTopic 10
-Name Accounting Standards Codification
-Section S99
-Paragraph 1
-Subparagraph (SX 210.5-02(29))
-Publisher FASB
-URI https://asc.fasb.org//1943274/2147480566/210-10-S99-1
Reference 12: http://fasb.org/us-gaap/role/ref/legacyRef
-Topic 210
-SubTopic 10
-Name Accounting Standards Codification
-Section S99
-Paragraph 1
-Subparagraph (SX 210.5-02(31))
-Publisher FASB
-URI https://asc.fasb.org//1943274/2147480566/210-10-S99-1
Reference 13: http://fasb.org/us-gaap/role/ref/legacyRef
-Topic 210
-SubTopic 10
-Name Accounting Standards Codification
-Section S99
-Paragraph 1
-Subparagraph (SX 210.5-02(30))
-Publisher FASB
-URI https://asc.fasb.org//1943274/2147480566/210-10-S99-1
Reference 14: http://fasb.org/us-gaap/role/ref/legacyRef
-Topic 310
-SubTopic 10
-Name Accounting Standards Codification
-Section S99
-Paragraph 2
-Subparagraph (SAB Topic 4.E)
-Publisher FASB
-URI https://asc.fasb.org//1943274/2147480418/310-10-S99-2
| Name: |
us-gaap_StockholdersEquity |
| Namespace Prefix: |
us-gaap_ |
| Data Type: |
xbrli:monetaryItemType |
| Balance Type: |
credit |
| Period Type: |
instant |
|
| X |
- References
+ Details
| Name: |
us-gaap_StockholdersEquityAbstract |
| Namespace Prefix: |
us-gaap_ |
| Data Type: |
xbrli:stringItemType |
| Balance Type: |
na |
| Period Type: |
duration |
|
| X |
- DefinitionCarrying value as of the balance sheet date of obligations incurred and payable for statutory income, sales, use, payroll, excise, real, property and other taxes. Used to reflect the current portion of the liabilities (due within one year or within the normal operating cycle if longer). Reference 1: http://fasb.org/us-gaap/role/ref/legacyRef
-Name Accounting Standards Codification
-Topic 210
-SubTopic 10
-Section S99
-Paragraph 1
-Subparagraph (SX 210.5-02.19,20)
-Publisher FASB
-URI https://asc.fasb.org//1943274/2147480566/210-10-S99-1
| Name: |
us-gaap_TaxesPayableCurrent |
| Namespace Prefix: |
us-gaap_ |
| Data Type: |
xbrli:monetaryItemType |
| Balance Type: |
credit |
| Period Type: |
instant |
|
v3.23.2
Consolidated Balance Sheets (Parenthetical) - shares
|
Jun. 30, 2023 |
Dec. 31, 2022 |
| Statement of Financial Position [Abstract] |
|
|
| Common Stock, Shares Authorized |
150,000,000
|
|
| Common Stock, Shares, Issued |
34,363,845
|
34,000,642
|
| Common Stock, Shares, Outstanding |
34,363,845
|
34,000,642
|
| Common Stock, Shares Held in Employee Trust, Shares |
116,336
|
113,316
|
| X |
- DefinitionThe maximum number of common shares permitted to be issued by an entity's charter and bylaws. Reference 1: http://www.xbrl.org/2003/role/disclosureRef
-Topic 946
-SubTopic 210
-Name Accounting Standards Codification
-Section S99
-Paragraph 1
-Subparagraph (SX 210.6-04(16)(a))
-Publisher FASB
-URI https://asc.fasb.org//1943274/2147479617/946-210-S99-1
Reference 2: http://fasb.org/us-gaap/role/ref/legacyRef
-Topic 210
-SubTopic 10
-Name Accounting Standards Codification
-Section S99
-Paragraph 1
-Subparagraph (SX 210.5-02(29))
-Publisher FASB
-URI https://asc.fasb.org//1943274/2147480566/210-10-S99-1
| Name: |
us-gaap_CommonStockSharesAuthorized |
| Namespace Prefix: |
us-gaap_ |
| Data Type: |
xbrli:sharesItemType |
| Balance Type: |
na |
| Period Type: |
instant |
|
| X |
- DefinitionNumber of common stock held in a trust that has been set up specifically to accumulate stock for the sole purpose of distribution to participating employees but not yet earned. Reference 1: http://fasb.org/us-gaap/role/ref/legacyRef
-Name Accounting Standards Codification
-Topic 718
-SubTopic 40
-Section 25
-Paragraph 12
-Publisher FASB
-URI https://asc.fasb.org//1943274/2147480637/718-40-25-12
| Name: |
us-gaap_CommonStockSharesHeldInEmployeeTrustShares |
| Namespace Prefix: |
us-gaap_ |
| Data Type: |
xbrli:sharesItemType |
| Balance Type: |
na |
| Period Type: |
instant |
|
| X |
- DefinitionTotal number of common shares of an entity that have been sold or granted to shareholders (includes common shares that were issued, repurchased and remain in the treasury). These shares represent capital invested by the firm's shareholders and owners, and may be all or only a portion of the number of shares authorized. Shares issued include shares outstanding and shares held in the treasury. Reference 1: http://fasb.org/us-gaap/role/ref/legacyRef
-Topic 210
-SubTopic 10
-Name Accounting Standards Codification
-Section S99
-Paragraph 1
-Subparagraph (SX 210.5-02(29))
-Publisher FASB
-URI https://asc.fasb.org//1943274/2147480566/210-10-S99-1
| Name: |
us-gaap_CommonStockSharesIssued |
| Namespace Prefix: |
us-gaap_ |
| Data Type: |
xbrli:sharesItemType |
| Balance Type: |
na |
| Period Type: |
instant |
|
| X |
- DefinitionNumber of shares of common stock outstanding. Common stock represent the ownership interest in a corporation. Reference 1: http://fasb.org/us-gaap/role/ref/legacyRef
-Name Accounting Standards Codification
-Section 50
-Paragraph 2
-SubTopic 10
-Topic 505
-Publisher FASB
-URI https://asc.fasb.org//1943274/2147481112/505-10-50-2
Reference 2: http://www.xbrl.org/2003/role/disclosureRef
-Topic 946
-SubTopic 210
-Name Accounting Standards Codification
-Section S99
-Paragraph 2
-Subparagraph (SX 210.6-05(4))
-Publisher FASB
-URI https://asc.fasb.org//1943274/2147479617/946-210-S99-2
Reference 3: http://www.xbrl.org/2009/role/commonPracticeRef
-Topic 946
-SubTopic 220
-Name Accounting Standards Codification
-Section S99
-Paragraph 3
-Subparagraph (SX 210.6-09(4)(b))
-Publisher FASB
-URI https://asc.fasb.org//1943274/2147483575/946-220-S99-3
Reference 4: http://www.xbrl.org/2003/role/disclosureRef
-Topic 946
-SubTopic 210
-Name Accounting Standards Codification
-Section S99
-Paragraph 1
-Subparagraph (SX 210.6-04(16)(a))
-Publisher FASB
-URI https://asc.fasb.org//1943274/2147479617/946-210-S99-1
Reference 5: http://www.xbrl.org/2009/role/commonPracticeRef
-Topic 946
-SubTopic 220
-Name Accounting Standards Codification
-Section S99
-Paragraph 3
-Subparagraph (SX 210.6-09(7))
-Publisher FASB
-URI https://asc.fasb.org//1943274/2147483575/946-220-S99-3
Reference 6: http://fasb.org/us-gaap/role/ref/legacyRef
-Topic 210
-SubTopic 10
-Name Accounting Standards Codification
-Section S99
-Paragraph 1
-Subparagraph (SX 210.5-02(29))
-Publisher FASB
-URI https://asc.fasb.org//1943274/2147480566/210-10-S99-1
| Name: |
us-gaap_CommonStockSharesOutstanding |
| Namespace Prefix: |
us-gaap_ |
| Data Type: |
xbrli:sharesItemType |
| Balance Type: |
na |
| Period Type: |
instant |
|
| X |
- References
+ Details
| Name: |
us-gaap_StatementOfFinancialPositionAbstract |
| Namespace Prefix: |
us-gaap_ |
| Data Type: |
xbrli:stringItemType |
| Balance Type: |
na |
| Period Type: |
duration |
|
v3.23.2
Consolidated Statements Of Income - USD ($)
shares in Thousands, $ in Thousands |
3 Months Ended |
6 Months Ended |
Jun. 30, 2023 |
Jun. 30, 2022 |
Jun. 30, 2023 |
Jun. 30, 2022 |
| Revenues and other items: |
|
|
|
|
| Sales |
$ 178,167
|
$ 274,363
|
$ 369,289
|
$ 510,929
|
| Other income (expense), net |
(20)
|
1,342
|
260
|
1,041
|
| Total revenues, net of other expenses |
178,147
|
275,705
|
369,549
|
511,970
|
| Costs and expenses: |
|
|
|
|
| Selling, general and administrative |
16,889
|
18,862
|
35,894
|
40,143
|
| Research and development |
1,376
|
1,754
|
2,581
|
3,278
|
| Amortization of identifiable intangibles |
464
|
666
|
968
|
1,329
|
| Accrued pension and post-retirement benefits |
3,418
|
3,506
|
6,837
|
6,982
|
| Interest expense |
2,374
|
1,234
|
4,686
|
2,020
|
| Asset impairments and costs associated with exit and disposal activities, net of adjustments |
0
|
134
|
69
|
126
|
| Goodwill, Impairment Loss |
15,413
|
0
|
15,413
|
0
|
| Total |
200,400
|
255,280
|
392,483
|
474,344
|
| Income (loss) before income taxes |
(22,253)
|
20,425
|
(22,934)
|
37,626
|
| Income tax expense (benefit) |
(3,331)
|
5,556
|
(3,000)
|
6,334
|
| Net income (loss) |
$ (18,922)
|
$ 14,869
|
$ (19,934)
|
$ 31,292
|
| Earnings (loss) per share: |
|
|
|
|
| Basic (in dollars per share) |
$ (0.56)
|
$ 0.44
|
$ (0.59)
|
$ 0.93
|
| Diluted (in dollars per share) |
$ (0.56)
|
$ 0.44
|
$ (0.59)
|
$ 0.93
|
| Shares used to compute earnings (loss) per share: |
|
|
|
|
| Basic (in shares) |
34,079
|
33,814
|
33,988
|
33,734
|
| Diluted (in shares) |
34,079
|
33,854
|
33,988
|
33,776
|
| Cost of goods sold |
|
|
|
|
| Costs and expenses: |
|
|
|
|
| Cost of Goods and Services Sold |
$ 153,267
|
$ 218,088
|
$ 312,792
|
$ 401,348
|
| Freight |
|
|
|
|
| Costs and expenses: |
|
|
|
|
| Cost of Goods and Services Sold |
$ 7,199
|
$ 11,036
|
$ 13,243
|
$ 19,118
|
| X |
- DefinitionAmounts charged against earnings for incurred and estimated one-time, nonrecurring costs assoicated with asset impariments and exit and disposal activities.
| Name: |
tg_AssetImpairmentAndCostsAssociatedWithExitAndDisposalActivitiesimpairmentLine |
| Namespace Prefix: |
tg_ |
| Data Type: |
xbrli:monetaryItemType |
| Balance Type: |
debit |
| Period Type: |
duration |
|
| X |
- DefinitionShares Used To Compute Earnings Loss Per Share.
| Name: |
tg_SharesUsedToComputeEarningsLossPerShareAbstract |
| Namespace Prefix: |
tg_ |
| Data Type: |
xbrli:stringItemType |
| Balance Type: |
na |
| Period Type: |
duration |
|
| X |
- DefinitionTotal sales, net of returns, allowances and discounts, plus other non-operating income and expenses.
| Name: |
tg_TotalRevenuesNetOfOtherExpenses |
| Namespace Prefix: |
tg_ |
| Data Type: |
xbrli:monetaryItemType |
| Balance Type: |
credit |
| Period Type: |
duration |
|
| X |
- DefinitionThe aggregate expense charged against earnings to allocate the cost of intangible assets (nonphysical assets not used in production) in a systematic and rational manner to the periods expected to benefit from such assets. As a noncash expense, this element is added back to net income when calculating cash provided by or used in operations using the indirect method. Reference 1: http://fasb.org/us-gaap/role/ref/legacyRef
-Name Accounting Standards Codification
-Section 45
-Paragraph 28
-Subparagraph (b)
-SubTopic 10
-Topic 230
-Publisher FASB
-URI https://asc.fasb.org//1943274/2147482740/230-10-45-28
Reference 2: http://fasb.org/us-gaap/role/ref/legacyRef
-Name Accounting Standards Codification
-Topic 350
-SubTopic 30
-Section 45
-Paragraph 2
-Publisher FASB
-URI https://asc.fasb.org//1943274/2147482686/350-30-45-2
Reference 3: http://fasb.org/us-gaap/role/ref/legacyRef
-Name Accounting Standards Codification
-Topic 350
-SubTopic 30
-Section 50
-Paragraph 2
-Subparagraph (a)(2)
-Publisher FASB
-URI https://asc.fasb.org//1943274/2147482665/350-30-50-2
| Name: |
us-gaap_AmortizationOfIntangibleAssets |
| Namespace Prefix: |
us-gaap_ |
| Data Type: |
xbrli:monetaryItemType |
| Balance Type: |
debit |
| Period Type: |
duration |
|
| X |
- DefinitionThe aggregate costs related to goods produced and sold and services rendered by an entity during the reporting period. This excludes costs incurred during the reporting period related to financial services rendered and other revenue generating activities. Reference 1: http://www.xbrl.org/2003/role/disclosureRef
-Topic 924
-SubTopic 10
-Name Accounting Standards Codification
-Section S99
-Paragraph 1
-Subparagraph (SAB Topic 11.L)
-Publisher FASB
-URI https://asc.fasb.org//1943274/2147479941/924-10-S99-1
Reference 2: http://fasb.org/us-gaap/role/ref/legacyRef
-Topic 220
-SubTopic 10
-Name Accounting Standards Codification
-Section S99
-Paragraph 2
-Subparagraph (SX 210.5-03.2(a),(d))
-Publisher FASB
-URI https://asc.fasb.org//1943274/2147483621/220-10-S99-2
| Name: |
us-gaap_CostOfGoodsAndServicesSold |
| Namespace Prefix: |
us-gaap_ |
| Data Type: |
xbrli:monetaryItemType |
| Balance Type: |
debit |
| Period Type: |
duration |
|
| X |
- References
+ Details
| Name: |
us-gaap_CostOfRevenueAbstract |
| Namespace Prefix: |
us-gaap_ |
| Data Type: |
xbrli:stringItemType |
| Balance Type: |
na |
| Period Type: |
duration |
|
| X |
- DefinitionTotal costs of sales and operating expenses for the period. Reference 1: http://fasb.org/us-gaap/role/ref/legacyRef
-Topic 220
-SubTopic 10
-Name Accounting Standards Codification
-Section S99
-Paragraph 2
-Subparagraph (SX 210.5-03)
-Publisher FASB
-URI https://asc.fasb.org//1943274/2147483621/220-10-S99-2
| Name: |
us-gaap_CostsAndExpenses |
| Namespace Prefix: |
us-gaap_ |
| Data Type: |
xbrli:monetaryItemType |
| Balance Type: |
debit |
| Period Type: |
duration |
|
| X |
- References
+ Details
| Name: |
us-gaap_EarningsPerShareAbstract |
| Namespace Prefix: |
us-gaap_ |
| Data Type: |
xbrli:stringItemType |
| Balance Type: |
na |
| Period Type: |
duration |
|
| X |
- DefinitionAmount of loss from the write-down of an asset representing the future economic benefits arising from other assets acquired in a business combination that are not individually identified and separately recognized. Reference 1: http://fasb.org/us-gaap/role/ref/legacyRef
-Name Accounting Standards Codification
-Section 45
-Paragraph 28
-Subparagraph (b)
-SubTopic 10
-Topic 230
-Publisher FASB
-URI https://asc.fasb.org//1943274/2147482740/230-10-45-28
Reference 2: http://www.xbrl.org/2003/role/exampleRef
-Topic 350
-SubTopic 20
-Name Accounting Standards Codification
-Section 55
-Paragraph 24
-Publisher FASB
-URI https://asc.fasb.org//1943274/2147482548/350-20-55-24
Reference 3: http://www.xbrl.org/2003/role/disclosureRef
-Topic 350
-SubTopic 20
-Name Accounting Standards Codification
-Section 50
-Paragraph 1
-Subparagraph (e)
-Publisher FASB
-URI https://asc.fasb.org//1943274/2147482573/350-20-50-1
Reference 4: http://www.xbrl.org/2003/role/disclosureRef
-Topic 350
-SubTopic 20
-Name Accounting Standards Codification
-Section 50
-Paragraph 2
-Subparagraph (b)
-Publisher FASB
-URI https://asc.fasb.org//1943274/2147482573/350-20-50-2
Reference 5: http://www.xbrl.org/2003/role/disclosureRef
-Topic 350
-SubTopic 20
-Name Accounting Standards Codification
-Section 45
-Paragraph 2
-Publisher FASB
-URI https://asc.fasb.org//1943274/2147482598/350-20-45-2
| Name: |
us-gaap_GoodwillImpairmentLoss |
| Namespace Prefix: |
us-gaap_ |
| Data Type: |
xbrli:monetaryItemType |
| Balance Type: |
debit |
| Period Type: |
duration |
|
| X |
- DefinitionThe amount of net income (loss) from continuing operations per each share of common stock or unit outstanding during the reporting period. Reference 1: http://www.xbrl.org/2003/role/disclosureRef
-Topic 250
-SubTopic 10
-Name Accounting Standards Codification
-Section 50
-Paragraph 3
-Publisher FASB
-URI https://asc.fasb.org//1943274/2147483443/250-10-50-3
Reference 2: http://www.xbrl.org/2003/role/disclosureRef
-Topic 250
-SubTopic 10
-Name Accounting Standards Codification
-Section 50
-Paragraph 1
-Subparagraph (b)(2)
-Publisher FASB
-URI https://asc.fasb.org//1943274/2147483443/250-10-50-1
Reference 3: http://www.xbrl.org/2003/role/disclosureRef
-Topic 815
-SubTopic 40
-Name Accounting Standards Codification
-Section 65
-Paragraph 1
-Subparagraph (f)
-Publisher FASB
-URI https://asc.fasb.org//1943274/2147480175/815-40-65-1
Reference 4: http://www.xbrl.org/2003/role/disclosureRef
-Topic 250
-SubTopic 10
-Name Accounting Standards Codification
-Section 50
-Paragraph 11
-Subparagraph (a)
-Publisher FASB
-URI https://asc.fasb.org//1943274/2147483443/250-10-50-11
Reference 5: http://www.xbrl.org/2003/role/disclosureRef
-Topic 250
-SubTopic 10
-Name Accounting Standards Codification
-Section 50
-Paragraph 11
-Subparagraph (b)
-Publisher FASB
-URI https://asc.fasb.org//1943274/2147483443/250-10-50-11
Reference 6: http://www.xbrl.org/2003/role/disclosureRef
-Topic 260
-SubTopic 10
-Name Accounting Standards Codification
-Section 45
-Paragraph 2
-Publisher FASB
-URI https://asc.fasb.org//1943274/2147482689/260-10-45-2
Reference 7: http://www.xbrl.org/2003/role/disclosureRef
-Topic 260
-SubTopic 10
-Name Accounting Standards Codification
-Section 45
-Paragraph 60B
-Subparagraph (d)
-Publisher FASB
-URI https://asc.fasb.org//1943274/2147482689/260-10-45-60B
Reference 8: http://www.xbrl.org/2003/role/disclosureRef
-Topic 250
-SubTopic 10
-Name Accounting Standards Codification
-Section 50
-Paragraph 4
-Publisher FASB
-URI https://asc.fasb.org//1943274/2147483443/250-10-50-4
Reference 9: http://www.xbrl.org/2009/role/commonPracticeRef
-Topic 944
-SubTopic 220
-Name Accounting Standards Codification
-Section S99
-Paragraph 1
-Subparagraph (SX 210.7-04(23))
-Publisher FASB
-URI https://asc.fasb.org//1943274/2147483586/944-220-S99-1
Reference 10: http://www.xbrl.org/2003/role/disclosureRef
-Topic 220
-SubTopic 10
-Name Accounting Standards Codification
-Section S99
-Paragraph 2
-Subparagraph (SX 210.5-03(25))
-Publisher FASB
-URI https://asc.fasb.org//1943274/2147483621/220-10-S99-2
Reference 11: http://www.xbrl.org/2003/role/disclosureRef
-Topic 942
-SubTopic 220
-Name Accounting Standards Codification
-Section S99
-Paragraph 1
-Subparagraph (SX 210.9-04(27))
-Publisher FASB
-URI https://asc.fasb.org//1943274/2147483589/942-220-S99-1
Reference 12: http://www.xbrl.org/2003/role/disclosureRef
-Topic 260
-SubTopic 10
-Name Accounting Standards Codification
-Section 45
-Paragraph 7
-Publisher FASB
-URI https://asc.fasb.org//1943274/2147482689/260-10-45-7
Reference 13: http://fasb.org/us-gaap/role/ref/legacyRef
-Topic 220
-SubTopic 10
-Name Accounting Standards Codification
-Section S99
-Paragraph 1
-Subparagraph (SX 210.5-03(13))
-Publisher FASB
-URI https://asc.fasb.org//1943274/2147483621/220-10-S99-1
Reference 14: http://fasb.org/us-gaap/role/ref/legacyRef
-Topic 942
-SubTopic 220
-Name Accounting Standards Codification
-Section S99
-Paragraph 1
-Subparagraph (SX 210.9-04(20))
-Publisher FASB
-URI https://asc.fasb.org//1943274/2147483589/942-220-S99-1
Reference 15: http://fasb.org/us-gaap/role/ref/legacyRef
-Topic 942
-SubTopic 220
-Name Accounting Standards Codification
-Section S99
-Paragraph 1
-Subparagraph (SX 210.7-04(19))
-Publisher FASB
-URI https://asc.fasb.org//1943274/2147483589/942-220-S99-1
| Name: |
us-gaap_IncomeLossFromContinuingOperationsPerBasicShare |
| Namespace Prefix: |
us-gaap_ |
| Data Type: |
dtr-types:perShareItemType |
| Balance Type: |
na |
| Period Type: |
duration |
|
| X |
- DefinitionThe amount of net income (loss) derived from continuing operations during the period available to each share of common stock or common unit outstanding during the reporting period and to each share or unit that would have been outstanding assuming the issuance of common shares or units for all dilutive potential common shares or units outstanding during the reporting period. Reference 1: http://www.xbrl.org/2003/role/disclosureRef
-Topic 250
-SubTopic 10
-Name Accounting Standards Codification
-Section 50
-Paragraph 3
-Publisher FASB
-URI https://asc.fasb.org//1943274/2147483443/250-10-50-3
Reference 2: http://www.xbrl.org/2003/role/disclosureRef
-Topic 250
-SubTopic 10
-Name Accounting Standards Codification
-Section 50
-Paragraph 1
-Subparagraph (b)(2)
-Publisher FASB
-URI https://asc.fasb.org//1943274/2147483443/250-10-50-1
Reference 3: http://www.xbrl.org/2003/role/disclosureRef
-Topic 815
-SubTopic 40
-Name Accounting Standards Codification
-Section 65
-Paragraph 1
-Subparagraph (f)
-Publisher FASB
-URI https://asc.fasb.org//1943274/2147480175/815-40-65-1
Reference 4: http://www.xbrl.org/2003/role/disclosureRef
-Topic 250
-SubTopic 10
-Name Accounting Standards Codification
-Section 50
-Paragraph 11
-Subparagraph (a)
-Publisher FASB
-URI https://asc.fasb.org//1943274/2147483443/250-10-50-11
Reference 5: http://www.xbrl.org/2003/role/disclosureRef
-Topic 250
-SubTopic 10
-Name Accounting Standards Codification
-Section 50
-Paragraph 11
-Subparagraph (b)
-Publisher FASB
-URI https://asc.fasb.org//1943274/2147483443/250-10-50-11
Reference 6: http://www.xbrl.org/2003/role/disclosureRef
-Topic 260
-SubTopic 10
-Name Accounting Standards Codification
-Section 45
-Paragraph 2
-Publisher FASB
-URI https://asc.fasb.org//1943274/2147482689/260-10-45-2
Reference 7: http://www.xbrl.org/2003/role/disclosureRef
-Topic 260
-SubTopic 10
-Name Accounting Standards Codification
-Section 45
-Paragraph 60B
-Subparagraph (d)
-Publisher FASB
-URI https://asc.fasb.org//1943274/2147482689/260-10-45-60B
Reference 8: http://www.xbrl.org/2003/role/disclosureRef
-Topic 250
-SubTopic 10
-Name Accounting Standards Codification
-Section 50
-Paragraph 4
-Publisher FASB
-URI https://asc.fasb.org//1943274/2147483443/250-10-50-4
Reference 9: http://www.xbrl.org/2009/role/commonPracticeRef
-Topic 944
-SubTopic 220
-Name Accounting Standards Codification
-Section S99
-Paragraph 1
-Subparagraph (SX 210.7-04(23))
-Publisher FASB
-URI https://asc.fasb.org//1943274/2147483586/944-220-S99-1
Reference 10: http://www.xbrl.org/2003/role/disclosureRef
-Topic 260
-SubTopic 10
-Name Accounting Standards Codification
-Section 50
-Paragraph 1
-Subparagraph (a)
-Publisher FASB
-URI https://asc.fasb.org//1943274/2147482662/260-10-50-1
Reference 11: http://www.xbrl.org/2003/role/disclosureRef
-Topic 220
-SubTopic 10
-Name Accounting Standards Codification
-Section S99
-Paragraph 2
-Subparagraph (SX 210.5-03(25))
-Publisher FASB
-URI https://asc.fasb.org//1943274/2147483621/220-10-S99-2
Reference 12: http://www.xbrl.org/2003/role/disclosureRef
-Topic 942
-SubTopic 220
-Name Accounting Standards Codification
-Section S99
-Paragraph 1
-Subparagraph (SX 210.9-04(27))
-Publisher FASB
-URI https://asc.fasb.org//1943274/2147483589/942-220-S99-1
Reference 13: http://www.xbrl.org/2003/role/disclosureRef
-Topic 260
-SubTopic 10
-Name Accounting Standards Codification
-Section 45
-Paragraph 7
-Publisher FASB
-URI https://asc.fasb.org//1943274/2147482689/260-10-45-7
Reference 14: http://fasb.org/us-gaap/role/ref/legacyRef
-Topic 220
-SubTopic 10
-Name Accounting Standards Codification
-Section S99
-Paragraph 1
-Subparagraph (SX 210.5-03(13))
-Publisher FASB
-URI https://asc.fasb.org//1943274/2147483621/220-10-S99-1
| Name: |
us-gaap_IncomeLossFromContinuingOperationsPerDilutedShare |
| Namespace Prefix: |
us-gaap_ |
| Data Type: |
dtr-types:perShareItemType |
| Balance Type: |
na |
| Period Type: |
duration |
|
| X |
- DefinitionInterest and debt related expenses associated with nonoperating financing activities of the entity. Reference 1: http://fasb.org/us-gaap/role/ref/legacyRef
-Name Accounting Standards Codification
-Section 50
-Paragraph 1
-SubTopic 20
-Topic 835
-Publisher FASB
-URI https://asc.fasb.org//1943274/2147483013/835-20-50-1
| Name: |
us-gaap_InterestAndDebtExpense |
| Namespace Prefix: |
us-gaap_ |
| Data Type: |
xbrli:monetaryItemType |
| Balance Type: |
debit |
| Period Type: |
duration |
|
| X |
- DefinitionThe portion of profit or loss for the period, net of income taxes, which is attributable to the parent. Reference 1: http://www.xbrl.org/2003/role/disclosureRef
-Topic 235
-SubTopic 10
-Name Accounting Standards Codification
-Section S99
-Paragraph 1
-Subparagraph (SX 210.4-08(g)(1)(ii))
-Publisher FASB
-URI https://asc.fasb.org//1943274/2147480678/235-10-S99-1
Reference 2: http://www.xbrl.org/2003/role/disclosureRef
-Topic 323
-SubTopic 10
-Name Accounting Standards Codification
-Section 50
-Paragraph 3
-Subparagraph (c)
-Publisher FASB
-URI https://asc.fasb.org//1943274/2147481687/323-10-50-3
Reference 3: http://www.xbrl.org/2003/role/disclosureRef
-Topic 825
-SubTopic 10
-Name Accounting Standards Codification
-Section 50
-Paragraph 28
-Subparagraph (f)
-Publisher FASB
-URI https://asc.fasb.org//1943274/2147482907/825-10-50-28
Reference 4: http://www.xbrl.org/2003/role/disclosureRef
-Topic 220
-SubTopic 10
-Name Accounting Standards Codification
-Section 50
-Paragraph 6
-Publisher FASB
-URI https://asc.fasb.org//1943274/2147482765/220-10-50-6
Reference 5: http://www.xbrl.org/2003/role/disclosureRef
-Topic 250
-SubTopic 10
-Name Accounting Standards Codification
-Section 50
-Paragraph 3
-Publisher FASB
-URI https://asc.fasb.org//1943274/2147483443/250-10-50-3
Reference 6: http://www.xbrl.org/2003/role/disclosureRef
-Topic 250
-SubTopic 10
-Name Accounting Standards Codification
-Section 50
-Paragraph 1
-Subparagraph (b)(2)
-Publisher FASB
-URI https://asc.fasb.org//1943274/2147483443/250-10-50-1
Reference 7: http://www.xbrl.org/2003/role/disclosureRef
-Topic 815
-SubTopic 40
-Name Accounting Standards Codification
-Section 65
-Paragraph 1
-Subparagraph (f)
-Publisher FASB
-URI https://asc.fasb.org//1943274/2147480175/815-40-65-1
Reference 8: http://www.xbrl.org/2003/role/disclosureRef
-Topic 250
-SubTopic 10
-Name Accounting Standards Codification
-Section 50
-Paragraph 8
-Publisher FASB
-URI https://asc.fasb.org//1943274/2147483443/250-10-50-8
Reference 9: http://www.xbrl.org/2003/role/disclosureRef
-Topic 250
-SubTopic 10
-Name Accounting Standards Codification
-Section 50
-Paragraph 9
-Publisher FASB
-URI https://asc.fasb.org//1943274/2147483443/250-10-50-9
Reference 10: http://www.xbrl.org/2003/role/disclosureRef
-Topic 250
-SubTopic 10
-Name Accounting Standards Codification
-Section 50
-Paragraph 11
-Subparagraph (a)
-Publisher FASB
-URI https://asc.fasb.org//1943274/2147483443/250-10-50-11
Reference 11: http://www.xbrl.org/2003/role/disclosureRef
-Topic 250
-SubTopic 10
-Name Accounting Standards Codification
-Section 50
-Paragraph 11
-Subparagraph (b)
-Publisher FASB
-URI https://asc.fasb.org//1943274/2147483443/250-10-50-11
Reference 12: http://www.xbrl.org/2003/role/disclosureRef
-Topic 250
-SubTopic 10
-Name Accounting Standards Codification
-Section 50
-Paragraph 4
-Publisher FASB
-URI https://asc.fasb.org//1943274/2147483443/250-10-50-4
Reference 13: http://www.xbrl.org/2003/role/exampleRef
-Topic 946
-SubTopic 830
-Name Accounting Standards Codification
-Section 55
-Paragraph 10
-Publisher FASB
-URI https://asc.fasb.org//1943274/2147480167/946-830-55-10
Reference 14: http://www.xbrl.org/2003/role/disclosureRef
-Topic 946
-SubTopic 220
-Name Accounting Standards Codification
-Section 45
-Paragraph 7
-Publisher FASB
-URI https://asc.fasb.org//1943274/2147483581/946-220-45-7
Reference 15: http://www.xbrl.org/2003/role/disclosureRef
-Topic 944
-SubTopic 220
-Name Accounting Standards Codification
-Section S99
-Paragraph 1
-Subparagraph (SX 210.7-04(18))
-Publisher FASB
-URI https://asc.fasb.org//1943274/2147483586/944-220-S99-1
Reference 16: http://www.xbrl.org/2003/role/disclosureRef
-Topic 280
-SubTopic 10
-Name Accounting Standards Codification
-Section 50
-Paragraph 22
-Publisher FASB
-URI https://asc.fasb.org//1943274/2147482810/280-10-50-22
Reference 17: http://www.xbrl.org/2003/role/disclosureRef
-Topic 946
-SubTopic 220
-Name Accounting Standards Codification
-Section S99
-Paragraph 1
-Subparagraph (SX 210.6-07(9))
-Publisher FASB
-URI https://asc.fasb.org//1943274/2147483575/946-220-S99-1
Reference 18: http://www.xbrl.org/2003/role/disclosureRef
-Topic 946
-SubTopic 220
-Name Accounting Standards Codification
-Section S99
-Paragraph 3
-Subparagraph (SX 210.6-09(1)(d))
-Publisher FASB
-URI https://asc.fasb.org//1943274/2147483575/946-220-S99-3
Reference 19: http://www.xbrl.org/2003/role/disclosureRef
-Topic 470
-SubTopic 10
-Name Accounting Standards Codification
-Section S99
-Paragraph 1A
-Subparagraph (SX 210.13-01(a)(4)(i))
-Publisher FASB
-URI https://asc.fasb.org//1943274/2147480097/470-10-S99-1A
Reference 20: http://www.xbrl.org/2009/role/commonPracticeRef
-Topic 470
-SubTopic 10
-Name Accounting Standards Codification
-Section S99
-Paragraph 1A
-Subparagraph (SX 210.13-01(a)(4)(ii))
-Publisher FASB
-URI https://asc.fasb.org//1943274/2147480097/470-10-S99-1A
Reference 21: http://www.xbrl.org/2003/role/disclosureRef
-Topic 470
-SubTopic 10
-Name Accounting Standards Codification
-Section S99
-Paragraph 1A
-Subparagraph (SX 210.13-01(a)(4)(iii)(A))
-Publisher FASB
-URI https://asc.fasb.org//1943274/2147480097/470-10-S99-1A
Reference 22: http://www.xbrl.org/2003/role/disclosureRef
-Topic 470
-SubTopic 10
-Name Accounting Standards Codification
-Section S99
-Paragraph 1A
-Subparagraph (SX 210.13-01(a)(4)(iv))
-Publisher FASB
-URI https://asc.fasb.org//1943274/2147480097/470-10-S99-1A
Reference 23: http://www.xbrl.org/2003/role/disclosureRef
-Topic 470
-SubTopic 10
-Name Accounting Standards Codification
-Section S99
-Paragraph 1A
-Subparagraph (SX 210.13-01(a)(5))
-Publisher FASB
-URI https://asc.fasb.org//1943274/2147480097/470-10-S99-1A
Reference 24: http://www.xbrl.org/2003/role/disclosureRef
-Topic 470
-SubTopic 10
-Name Accounting Standards Codification
-Section S99
-Paragraph 1B
-Subparagraph (SX 210.13-02(a)(4)(i))
-Publisher FASB
-URI https://asc.fasb.org//1943274/2147480097/470-10-S99-1B
Reference 25: http://www.xbrl.org/2003/role/disclosureRef
-Topic 470
-SubTopic 10
-Name Accounting Standards Codification
-Section S99
-Paragraph 1B
-Subparagraph (SX 210.13-02(a)(4)(iii)(A))
-Publisher FASB
-URI https://asc.fasb.org//1943274/2147480097/470-10-S99-1B
Reference 26: http://www.xbrl.org/2003/role/disclosureRef
-Topic 470
-SubTopic 10
-Name Accounting Standards Codification
-Section S99
-Paragraph 1B
-Subparagraph (SX 210.13-02(a)(4)(iii)(B))
-Publisher FASB
-URI https://asc.fasb.org//1943274/2147480097/470-10-S99-1B
Reference 27: http://www.xbrl.org/2003/role/disclosureRef
-Topic 470
-SubTopic 10
-Name Accounting Standards Codification
-Section S99
-Paragraph 1B
-Subparagraph (SX 210.13-02(a)(4)(iv))
-Publisher FASB
-URI https://asc.fasb.org//1943274/2147480097/470-10-S99-1B
Reference 28: http://www.xbrl.org/2003/role/disclosureRef
-Topic 470
-SubTopic 10
-Name Accounting Standards Codification
-Section S99
-Paragraph 1B
-Subparagraph (SX 210.13-02(a)(5))
-Publisher FASB
-URI https://asc.fasb.org//1943274/2147480097/470-10-S99-1B
Reference 29: http://www.xbrl.org/2003/role/disclosureRef
-Topic 280
-SubTopic 10
-Name Accounting Standards Codification
-Section 50
-Paragraph 30
-Subparagraph (b)
-Publisher FASB
-URI https://asc.fasb.org//1943274/2147482810/280-10-50-30
Reference 30: http://www.xbrl.org/2003/role/disclosureRef
-Topic 280
-SubTopic 10
-Name Accounting Standards Codification
-Section 50
-Paragraph 32
-Subparagraph (f)
-Publisher FASB
-URI https://asc.fasb.org//1943274/2147482810/280-10-50-32
Reference 31: http://www.xbrl.org/2003/role/disclosureRef
-Topic 260
-SubTopic 10
-Name Accounting Standards Codification
-Section 45
-Paragraph 60B
-Subparagraph (a)
-Publisher FASB
-URI https://asc.fasb.org//1943274/2147482689/260-10-45-60B
Reference 32: http://www.xbrl.org/2003/role/exampleRef
-Topic 280
-SubTopic 10
-Name Accounting Standards Codification
-Section 50
-Paragraph 31
-Publisher FASB
-URI https://asc.fasb.org//1943274/2147482810/280-10-50-31
Reference 33: http://www.xbrl.org/2003/role/disclosureRef
-Topic 280
-SubTopic 10
-Name Accounting Standards Codification
-Section 50
-Paragraph 32
-Subparagraph (c)
-Publisher FASB
-URI https://asc.fasb.org//1943274/2147482810/280-10-50-32
Reference 34: http://www.xbrl.org/2003/role/disclosureRef
-Topic 205
-SubTopic 20
-Name Accounting Standards Codification
-Section 50
-Paragraph 7
-Publisher FASB
-URI https://asc.fasb.org//1943274/2147483499/205-20-50-7
Reference 35: http://fasb.org/us-gaap/role/ref/legacyRef
-Topic 230
-SubTopic 10
-Name Accounting Standards Codification
-Section 45
-Paragraph 28
-Publisher FASB
-URI https://asc.fasb.org//1943274/2147482740/230-10-45-28
Reference 36: http://www.xbrl.org/2003/role/disclosureRef
-Topic 220
-SubTopic 10
-Name Accounting Standards Codification
-Section 45
-Paragraph 1A
-Subparagraph (a)
-Publisher FASB
-URI https://asc.fasb.org//1943274/2147482790/220-10-45-1A
Reference 37: http://www.xbrl.org/2003/role/disclosureRef
-Topic 220
-SubTopic 10
-Name Accounting Standards Codification
-Section 45
-Paragraph 1B
-Subparagraph (a)
-Publisher FASB
-URI https://asc.fasb.org//1943274/2147482790/220-10-45-1B
Reference 38: http://fasb.org/us-gaap/role/ref/legacyRef
-Topic 220
-SubTopic 10
-Name Accounting Standards Codification
-Section S99
-Paragraph 2
-Subparagraph (SX 210.5-03(20))
-Publisher FASB
-URI https://asc.fasb.org//1943274/2147483621/220-10-S99-2
Reference 39: http://fasb.org/us-gaap/role/ref/legacyRef
-Topic 942
-SubTopic 220
-Name Accounting Standards Codification
-Section S99
-Paragraph 1
-Subparagraph (SX 210.9-04(22))
-Publisher FASB
-URI https://asc.fasb.org//1943274/2147483589/942-220-S99-1
| Name: |
us-gaap_NetIncomeLoss |
| Namespace Prefix: |
us-gaap_ |
| Data Type: |
xbrli:monetaryItemType |
| Balance Type: |
credit |
| Period Type: |
duration |
|
| X |
- DefinitionAmount of income (expense) related to nonoperating activities, classified as other. Reference 1: http://fasb.org/us-gaap/role/ref/legacyRef
-Topic 220
-SubTopic 10
-Name Accounting Standards Codification
-Section S99
-Paragraph 2
-Subparagraph (SX 210.5-03.9)
-Publisher FASB
-URI https://asc.fasb.org//1943274/2147483621/220-10-S99-2
| Name: |
us-gaap_OtherNonoperatingIncomeExpense |
| Namespace Prefix: |
us-gaap_ |
| Data Type: |
xbrli:monetaryItemType |
| Balance Type: |
credit |
| Period Type: |
duration |
|
| X |
- DefinitionAmount of cost (reversal of cost) for pension and other postretirement benefits.
| Name: |
us-gaap_PensionAndOtherPostretirementBenefitExpense |
| Namespace Prefix: |
us-gaap_ |
| Data Type: |
xbrli:monetaryItemType |
| Balance Type: |
debit |
| Period Type: |
duration |
|
| X |
- DefinitionThe aggregate costs incurred (1) in a planned search or critical investigation aimed at discovery of new knowledge with the hope that such knowledge will be useful in developing a new product or service, a new process or technique, or in bringing about a significant improvement to an existing product or process; or (2) to translate research findings or other knowledge into a plan or design for a new product or process or for a significant improvement to an existing product or process whether intended for sale or the entity's use, during the reporting period charged to research and development projects, including the costs of developing computer software up to the point in time of achieving technological feasibility, and costs allocated in accounting for a business combination to in-process projects deemed to have no alternative future use. Reference 1: http://www.xbrl.org/2003/role/disclosureRef
-Topic 730
-SubTopic 10
-Name Accounting Standards Codification
-Section 50
-Paragraph 1
-Publisher FASB
-URI https://asc.fasb.org//1943274/2147482916/730-10-50-1
Reference 2: http://www.xbrl.org/2009/role/commonPracticeRef
-Topic 912
-SubTopic 730
-Name Accounting Standards Codification
-Section 25
-Paragraph 1
-Publisher FASB
-URI https://asc.fasb.org//1943274/2147482517/912-730-25-1
Reference 3: http://fasb.org/us-gaap/role/ref/legacyRef
-Name Accounting Standards Codification
-Topic 985
-SubTopic 20
-Section 50
-Paragraph 1
-Publisher FASB
-URI https://asc.fasb.org//1943274/2147481283/985-20-50-1
| Name: |
us-gaap_ResearchAndDevelopmentExpense |
| Namespace Prefix: |
us-gaap_ |
| Data Type: |
xbrli:monetaryItemType |
| Balance Type: |
debit |
| Period Type: |
duration |
|
| X |
- References
+ Details
| Name: |
us-gaap_RevenuesAbstract |
| Namespace Prefix: |
us-gaap_ |
| Data Type: |
xbrli:stringItemType |
| Balance Type: |
na |
| Period Type: |
duration |
|
| X |
- DefinitionThe aggregate total costs related to selling a firm's product and services, as well as all other general and administrative expenses. Direct selling expenses (for example, credit, warranty, and advertising) are expenses that can be directly linked to the sale of specific products. Indirect selling expenses are expenses that cannot be directly linked to the sale of specific products, for example telephone expenses, Internet, and postal charges. General and administrative expenses include salaries of non-sales personnel, rent, utilities, communication, etc. Reference 1: http://fasb.org/us-gaap/role/ref/legacyRef
-Topic 220
-SubTopic 10
-Name Accounting Standards Codification
-Section S99
-Paragraph 2
-Subparagraph (SX 210.5-03.4)
-Publisher FASB
-URI https://asc.fasb.org//1943274/2147483621/220-10-S99-2
| Name: |
us-gaap_SellingGeneralAndAdministrativeExpense |
| Namespace Prefix: |
us-gaap_ |
| Data Type: |
xbrli:monetaryItemType |
| Balance Type: |
debit |
| Period Type: |
duration |
|
| X |
- DefinitionThe average number of shares or units issued and outstanding that are used in calculating diluted EPS or earnings per unit (EPU), determined based on the timing of issuance of shares or units in the period. Reference 1: http://www.xbrl.org/2003/role/disclosureRef
-Topic 260
-SubTopic 10
-Name Accounting Standards Codification
-Section 50
-Paragraph 1
-Subparagraph (a)
-Publisher FASB
-URI https://asc.fasb.org//1943274/2147482662/260-10-50-1
Reference 2: http://www.xbrl.org/2003/role/disclosureRef
-Topic 260
-SubTopic 10
-Name Accounting Standards Codification
-Section 45
-Paragraph 16
-Publisher FASB
-URI https://asc.fasb.org//1943274/2147482689/260-10-45-16
| Name: |
us-gaap_WeightedAverageNumberOfDilutedSharesOutstanding |
| Namespace Prefix: |
us-gaap_ |
| Data Type: |
xbrli:sharesItemType |
| Balance Type: |
na |
| Period Type: |
duration |
|
| X |
- DefinitionNumber of [basic] shares or units, after adjustment for contingently issuable shares or units and other shares or units not deemed outstanding, determined by relating the portion of time within a reporting period that common shares or units have been outstanding to the total time in that period. Reference 1: http://www.xbrl.org/2003/role/disclosureRef
-Topic 260
-SubTopic 10
-Name Accounting Standards Codification
-Section 50
-Paragraph 1
-Subparagraph (a)
-Publisher FASB
-URI https://asc.fasb.org//1943274/2147482662/260-10-50-1
Reference 2: http://www.xbrl.org/2003/role/disclosureRef
-Topic 260
-SubTopic 10
-Name Accounting Standards Codification
-Section 45
-Paragraph 10
-Publisher FASB
-URI https://asc.fasb.org//1943274/2147482689/260-10-45-10
| Name: |
us-gaap_WeightedAverageNumberOfSharesOutstandingBasic |
| Namespace Prefix: |
us-gaap_ |
| Data Type: |
xbrli:sharesItemType |
| Balance Type: |
na |
| Period Type: |
duration |
|
| X |
- Details
| Name: |
srt_ProductOrServiceAxis=us-gaap_ProductMember |
| Namespace Prefix: |
|
| Data Type: |
na |
| Balance Type: |
|
| Period Type: |
|
|
| X |
- Details
| Name: |
srt_ProductOrServiceAxis=us-gaap_ShippingAndHandlingMember |
| Namespace Prefix: |
|
| Data Type: |
na |
| Balance Type: |
|
| Period Type: |
|
|
v3.23.2
Consolidated Statements Of Comprehensive Income (Loss) - USD ($)
$ in Thousands |
3 Months Ended |
6 Months Ended |
Jun. 30, 2023 |
Jun. 30, 2022 |
Jun. 30, 2023 |
Jun. 30, 2022 |
| Statement of Comprehensive Income [Abstract] |
|
|
|
|
| Net Income (Loss) Attributable to Parent |
$ (18,922)
|
$ 14,869
|
$ (19,934)
|
$ 31,292
|
| Other Comprehensive Income (Loss), Net of Tax [Abstract] |
|
|
|
|
| Other Comprehensive Income (Loss), Foreign Currency Transaction and Translation Adjustment, Net of Tax |
1,621
|
(5,230)
|
2,741
|
306
|
| Derivative financial instruments adjustment |
368
|
(9,161)
|
1,637
|
(3,231)
|
| Other Comprehensive (Income) Loss, Defined Benefit Plan, Reclassification Adjustment from AOCI, after Tax |
2,286
|
2,556
|
4,573
|
5,094
|
| Other comprehensive income (loss) |
4,275
|
(11,835)
|
8,951
|
2,169
|
| Comprehensive Income (Loss), Net of Tax, Attributable to Parent, Total |
$ (14,647)
|
$ 3,034
|
$ (10,983)
|
$ 33,461
|
| X |
- DefinitionAmount after tax of increase (decrease) in equity from transactions and other events and circumstances from net income and other comprehensive income, attributable to parent entity. Excludes changes in equity resulting from investments by owners and distributions to owners. Reference 1: http://www.xbrl.org/2003/role/disclosureRef
-Topic 220
-SubTopic 10
-Name Accounting Standards Codification
-Section S99
-Paragraph 2
-Subparagraph (SX 210.5-03(24))
-Publisher FASB
-URI https://asc.fasb.org//1943274/2147483621/220-10-S99-2
Reference 2: http://www.xbrl.org/2003/role/disclosureRef
-Topic 942
-SubTopic 220
-Name Accounting Standards Codification
-Section S99
-Paragraph 1
-Subparagraph (SX 210.9-04(26))
-Publisher FASB
-URI https://asc.fasb.org//1943274/2147483589/942-220-S99-1
Reference 3: http://www.xbrl.org/2003/role/disclosureRef
-Topic 944
-SubTopic 220
-Name Accounting Standards Codification
-Section S99
-Paragraph 1
-Subparagraph (SX 210.7-04(22))
-Publisher FASB
-URI https://asc.fasb.org//1943274/2147483586/944-220-S99-1
Reference 4: http://www.xbrl.org/2003/role/disclosureRef
-Topic 220
-SubTopic 10
-Name Accounting Standards Codification
-Section 45
-Paragraph 1A
-Subparagraph (c)
-Publisher FASB
-URI https://asc.fasb.org//1943274/2147482790/220-10-45-1A
Reference 5: http://www.xbrl.org/2003/role/disclosureRef
-Topic 220
-SubTopic 10
-Name Accounting Standards Codification
-Section 45
-Paragraph 1B
-Subparagraph (b)
-Publisher FASB
-URI https://asc.fasb.org//1943274/2147482790/220-10-45-1B
Reference 6: http://fasb.org/us-gaap/role/ref/legacyRef
-Name Accounting Standards Codification
-Topic 220
-SubTopic 10
-Section 45
-Paragraph 5
-Publisher FASB
-URI https://asc.fasb.org//1943274/2147482790/220-10-45-5
| Name: |
us-gaap_ComprehensiveIncomeNetOfTax |
| Namespace Prefix: |
us-gaap_ |
| Data Type: |
xbrli:monetaryItemType |
| Balance Type: |
credit |
| Period Type: |
duration |
|
| X |
- DefinitionThe portion of profit or loss for the period, net of income taxes, which is attributable to the parent. Reference 1: http://www.xbrl.org/2003/role/disclosureRef
-Topic 235
-SubTopic 10
-Name Accounting Standards Codification
-Section S99
-Paragraph 1
-Subparagraph (SX 210.4-08(g)(1)(ii))
-Publisher FASB
-URI https://asc.fasb.org//1943274/2147480678/235-10-S99-1
Reference 2: http://www.xbrl.org/2003/role/disclosureRef
-Topic 323
-SubTopic 10
-Name Accounting Standards Codification
-Section 50
-Paragraph 3
-Subparagraph (c)
-Publisher FASB
-URI https://asc.fasb.org//1943274/2147481687/323-10-50-3
Reference 3: http://www.xbrl.org/2003/role/disclosureRef
-Topic 825
-SubTopic 10
-Name Accounting Standards Codification
-Section 50
-Paragraph 28
-Subparagraph (f)
-Publisher FASB
-URI https://asc.fasb.org//1943274/2147482907/825-10-50-28
Reference 4: http://www.xbrl.org/2003/role/disclosureRef
-Topic 220
-SubTopic 10
-Name Accounting Standards Codification
-Section 50
-Paragraph 6
-Publisher FASB
-URI https://asc.fasb.org//1943274/2147482765/220-10-50-6
Reference 5: http://www.xbrl.org/2003/role/disclosureRef
-Topic 250
-SubTopic 10
-Name Accounting Standards Codification
-Section 50
-Paragraph 3
-Publisher FASB
-URI https://asc.fasb.org//1943274/2147483443/250-10-50-3
Reference 6: http://www.xbrl.org/2003/role/disclosureRef
-Topic 250
-SubTopic 10
-Name Accounting Standards Codification
-Section 50
-Paragraph 1
-Subparagraph (b)(2)
-Publisher FASB
-URI https://asc.fasb.org//1943274/2147483443/250-10-50-1
Reference 7: http://www.xbrl.org/2003/role/disclosureRef
-Topic 815
-SubTopic 40
-Name Accounting Standards Codification
-Section 65
-Paragraph 1
-Subparagraph (f)
-Publisher FASB
-URI https://asc.fasb.org//1943274/2147480175/815-40-65-1
Reference 8: http://www.xbrl.org/2003/role/disclosureRef
-Topic 250
-SubTopic 10
-Name Accounting Standards Codification
-Section 50
-Paragraph 8
-Publisher FASB
-URI https://asc.fasb.org//1943274/2147483443/250-10-50-8
Reference 9: http://www.xbrl.org/2003/role/disclosureRef
-Topic 250
-SubTopic 10
-Name Accounting Standards Codification
-Section 50
-Paragraph 9
-Publisher FASB
-URI https://asc.fasb.org//1943274/2147483443/250-10-50-9
Reference 10: http://www.xbrl.org/2003/role/disclosureRef
-Topic 250
-SubTopic 10
-Name Accounting Standards Codification
-Section 50
-Paragraph 11
-Subparagraph (a)
-Publisher FASB
-URI https://asc.fasb.org//1943274/2147483443/250-10-50-11
Reference 11: http://www.xbrl.org/2003/role/disclosureRef
-Topic 250
-SubTopic 10
-Name Accounting Standards Codification
-Section 50
-Paragraph 11
-Subparagraph (b)
-Publisher FASB
-URI https://asc.fasb.org//1943274/2147483443/250-10-50-11
Reference 12: http://www.xbrl.org/2003/role/disclosureRef
-Topic 250
-SubTopic 10
-Name Accounting Standards Codification
-Section 50
-Paragraph 4
-Publisher FASB
-URI https://asc.fasb.org//1943274/2147483443/250-10-50-4
Reference 13: http://www.xbrl.org/2003/role/exampleRef
-Topic 946
-SubTopic 830
-Name Accounting Standards Codification
-Section 55
-Paragraph 10
-Publisher FASB
-URI https://asc.fasb.org//1943274/2147480167/946-830-55-10
Reference 14: http://www.xbrl.org/2003/role/disclosureRef
-Topic 946
-SubTopic 220
-Name Accounting Standards Codification
-Section 45
-Paragraph 7
-Publisher FASB
-URI https://asc.fasb.org//1943274/2147483581/946-220-45-7
Reference 15: http://www.xbrl.org/2003/role/disclosureRef
-Topic 944
-SubTopic 220
-Name Accounting Standards Codification
-Section S99
-Paragraph 1
-Subparagraph (SX 210.7-04(18))
-Publisher FASB
-URI https://asc.fasb.org//1943274/2147483586/944-220-S99-1
Reference 16: http://www.xbrl.org/2003/role/disclosureRef
-Topic 280
-SubTopic 10
-Name Accounting Standards Codification
-Section 50
-Paragraph 22
-Publisher FASB
-URI https://asc.fasb.org//1943274/2147482810/280-10-50-22
Reference 17: http://www.xbrl.org/2003/role/disclosureRef
-Topic 946
-SubTopic 220
-Name Accounting Standards Codification
-Section S99
-Paragraph 1
-Subparagraph (SX 210.6-07(9))
-Publisher FASB
-URI https://asc.fasb.org//1943274/2147483575/946-220-S99-1
Reference 18: http://www.xbrl.org/2003/role/disclosureRef
-Topic 946
-SubTopic 220
-Name Accounting Standards Codification
-Section S99
-Paragraph 3
-Subparagraph (SX 210.6-09(1)(d))
-Publisher FASB
-URI https://asc.fasb.org//1943274/2147483575/946-220-S99-3
Reference 19: http://www.xbrl.org/2003/role/disclosureRef
-Topic 470
-SubTopic 10
-Name Accounting Standards Codification
-Section S99
-Paragraph 1A
-Subparagraph (SX 210.13-01(a)(4)(i))
-Publisher FASB
-URI https://asc.fasb.org//1943274/2147480097/470-10-S99-1A
Reference 20: http://www.xbrl.org/2009/role/commonPracticeRef
-Topic 470
-SubTopic 10
-Name Accounting Standards Codification
-Section S99
-Paragraph 1A
-Subparagraph (SX 210.13-01(a)(4)(ii))
-Publisher FASB
-URI https://asc.fasb.org//1943274/2147480097/470-10-S99-1A
Reference 21: http://www.xbrl.org/2003/role/disclosureRef
-Topic 470
-SubTopic 10
-Name Accounting Standards Codification
-Section S99
-Paragraph 1A
-Subparagraph (SX 210.13-01(a)(4)(iii)(A))
-Publisher FASB
-URI https://asc.fasb.org//1943274/2147480097/470-10-S99-1A
Reference 22: http://www.xbrl.org/2003/role/disclosureRef
-Topic 470
-SubTopic 10
-Name Accounting Standards Codification
-Section S99
-Paragraph 1A
-Subparagraph (SX 210.13-01(a)(4)(iv))
-Publisher FASB
-URI https://asc.fasb.org//1943274/2147480097/470-10-S99-1A
Reference 23: http://www.xbrl.org/2003/role/disclosureRef
-Topic 470
-SubTopic 10
-Name Accounting Standards Codification
-Section S99
-Paragraph 1A
-Subparagraph (SX 210.13-01(a)(5))
-Publisher FASB
-URI https://asc.fasb.org//1943274/2147480097/470-10-S99-1A
Reference 24: http://www.xbrl.org/2003/role/disclosureRef
-Topic 470
-SubTopic 10
-Name Accounting Standards Codification
-Section S99
-Paragraph 1B
-Subparagraph (SX 210.13-02(a)(4)(i))
-Publisher FASB
-URI https://asc.fasb.org//1943274/2147480097/470-10-S99-1B
Reference 25: http://www.xbrl.org/2003/role/disclosureRef
-Topic 470
-SubTopic 10
-Name Accounting Standards Codification
-Section S99
-Paragraph 1B
-Subparagraph (SX 210.13-02(a)(4)(iii)(A))
-Publisher FASB
-URI https://asc.fasb.org//1943274/2147480097/470-10-S99-1B
Reference 26: http://www.xbrl.org/2003/role/disclosureRef
-Topic 470
-SubTopic 10
-Name Accounting Standards Codification
-Section S99
-Paragraph 1B
-Subparagraph (SX 210.13-02(a)(4)(iii)(B))
-Publisher FASB
-URI https://asc.fasb.org//1943274/2147480097/470-10-S99-1B
Reference 27: http://www.xbrl.org/2003/role/disclosureRef
-Topic 470
-SubTopic 10
-Name Accounting Standards Codification
-Section S99
-Paragraph 1B
-Subparagraph (SX 210.13-02(a)(4)(iv))
-Publisher FASB
-URI https://asc.fasb.org//1943274/2147480097/470-10-S99-1B
Reference 28: http://www.xbrl.org/2003/role/disclosureRef
-Topic 470
-SubTopic 10
-Name Accounting Standards Codification
-Section S99
-Paragraph 1B
-Subparagraph (SX 210.13-02(a)(5))
-Publisher FASB
-URI https://asc.fasb.org//1943274/2147480097/470-10-S99-1B
Reference 29: http://www.xbrl.org/2003/role/disclosureRef
-Topic 280
-SubTopic 10
-Name Accounting Standards Codification
-Section 50
-Paragraph 30
-Subparagraph (b)
-Publisher FASB
-URI https://asc.fasb.org//1943274/2147482810/280-10-50-30
Reference 30: http://www.xbrl.org/2003/role/disclosureRef
-Topic 280
-SubTopic 10
-Name Accounting Standards Codification
-Section 50
-Paragraph 32
-Subparagraph (f)
-Publisher FASB
-URI https://asc.fasb.org//1943274/2147482810/280-10-50-32
Reference 31: http://www.xbrl.org/2003/role/disclosureRef
-Topic 260
-SubTopic 10
-Name Accounting Standards Codification
-Section 45
-Paragraph 60B
-Subparagraph (a)
-Publisher FASB
-URI https://asc.fasb.org//1943274/2147482689/260-10-45-60B
Reference 32: http://www.xbrl.org/2003/role/exampleRef
-Topic 280
-SubTopic 10
-Name Accounting Standards Codification
-Section 50
-Paragraph 31
-Publisher FASB
-URI https://asc.fasb.org//1943274/2147482810/280-10-50-31
Reference 33: http://www.xbrl.org/2003/role/disclosureRef
-Topic 280
-SubTopic 10
-Name Accounting Standards Codification
-Section 50
-Paragraph 32
-Subparagraph (c)
-Publisher FASB
-URI https://asc.fasb.org//1943274/2147482810/280-10-50-32
Reference 34: http://www.xbrl.org/2003/role/disclosureRef
-Topic 205
-SubTopic 20
-Name Accounting Standards Codification
-Section 50
-Paragraph 7
-Publisher FASB
-URI https://asc.fasb.org//1943274/2147483499/205-20-50-7
Reference 35: http://fasb.org/us-gaap/role/ref/legacyRef
-Topic 230
-SubTopic 10
-Name Accounting Standards Codification
-Section 45
-Paragraph 28
-Publisher FASB
-URI https://asc.fasb.org//1943274/2147482740/230-10-45-28
Reference 36: http://www.xbrl.org/2003/role/disclosureRef
-Topic 220
-SubTopic 10
-Name Accounting Standards Codification
-Section 45
-Paragraph 1A
-Subparagraph (a)
-Publisher FASB
-URI https://asc.fasb.org//1943274/2147482790/220-10-45-1A
Reference 37: http://www.xbrl.org/2003/role/disclosureRef
-Topic 220
-SubTopic 10
-Name Accounting Standards Codification
-Section 45
-Paragraph 1B
-Subparagraph (a)
-Publisher FASB
-URI https://asc.fasb.org//1943274/2147482790/220-10-45-1B
Reference 38: http://fasb.org/us-gaap/role/ref/legacyRef
-Topic 220
-SubTopic 10
-Name Accounting Standards Codification
-Section S99
-Paragraph 2
-Subparagraph (SX 210.5-03(20))
-Publisher FASB
-URI https://asc.fasb.org//1943274/2147483621/220-10-S99-2
Reference 39: http://fasb.org/us-gaap/role/ref/legacyRef
-Topic 942
-SubTopic 220
-Name Accounting Standards Codification
-Section S99
-Paragraph 1
-Subparagraph (SX 210.9-04(22))
-Publisher FASB
-URI https://asc.fasb.org//1943274/2147483589/942-220-S99-1
| Name: |
us-gaap_NetIncomeLoss |
| Namespace Prefix: |
us-gaap_ |
| Data Type: |
xbrli:monetaryItemType |
| Balance Type: |
credit |
| Period Type: |
duration |
|
| X |
- DefinitionAmount, after tax and reclassification, of gain (loss) from derivative instrument designated and qualifying as cash flow hedge included in assessment of hedge effectiveness. Reference 1: http://www.xbrl.org/2003/role/disclosureRef
-Topic 220
-SubTopic 10
-Name Accounting Standards Codification
-Section 45
-Paragraph 11
-Publisher FASB
-URI https://asc.fasb.org//1943274/2147482790/220-10-45-11
Reference 2: http://www.xbrl.org/2003/role/disclosureRef
-Topic 220
-SubTopic 10
-Name Accounting Standards Codification
-Section 45
-Paragraph 10A
-Subparagraph (d)
-Publisher FASB
-URI https://asc.fasb.org//1943274/2147482790/220-10-45-10A
| Name: |
us-gaap_OtherComprehensiveIncomeLossCashFlowHedgeGainLossAfterReclassificationAndTax |
| Namespace Prefix: |
us-gaap_ |
| Data Type: |
xbrli:monetaryItemType |
| Balance Type: |
credit |
| Period Type: |
duration |
|
| X |
- DefinitionAmount after tax and reclassification adjustments of gain (loss) on foreign currency translation adjustments, foreign currency transactions designated and effective as economic hedges of a net investment in a foreign entity and intra-entity foreign currency transactions that are of a long-term-investment nature. Reference 1: http://fasb.org/us-gaap/role/ref/legacyRef
-Name Accounting Standards Codification
-Section 45
-Paragraph 10A
-Subparagraph (a)
-SubTopic 10
-Topic 220
-Publisher FASB
-URI https://asc.fasb.org//1943274/2147482790/220-10-45-10A
| Name: |
us-gaap_OtherComprehensiveIncomeLossForeignCurrencyTransactionAndTranslationAdjustmentNetOfTax |
| Namespace Prefix: |
us-gaap_ |
| Data Type: |
xbrli:monetaryItemType |
| Balance Type: |
credit |
| Period Type: |
duration |
|
| X |
- References
+ Details
| Name: |
us-gaap_OtherComprehensiveIncomeLossNetOfTaxPeriodIncreaseDecreaseAbstract |
| Namespace Prefix: |
us-gaap_ |
| Data Type: |
xbrli:stringItemType |
| Balance Type: |
na |
| Period Type: |
duration |
|
| X |
- DefinitionAmount after tax of other comprehensive income (loss) attributable to parent entity. Reference 1: http://fasb.org/us-gaap/role/ref/legacyRef
-Topic 810
-SubTopic 10
-Name Accounting Standards Codification
-Section 45
-Paragraph 19
-Publisher FASB
-URI https://asc.fasb.org//1943274/2147481231/810-10-45-19
Reference 2: http://fasb.org/us-gaap/role/ref/legacyRef
-Name Accounting Standards Codification
-Section 45
-Paragraph 20
-SubTopic 10
-Topic 810
-Publisher FASB
-URI https://asc.fasb.org//1943274/2147481231/810-10-45-20
Reference 3: http://fasb.org/us-gaap/role/ref/legacyRef
-Name Accounting Standards Codification
-Section 50
-Paragraph 1A
-Subparagraph (c)(3)
-SubTopic 10
-Topic 810
-Publisher FASB
-URI https://asc.fasb.org//1943274/2147481203/810-10-50-1A
Reference 4: http://www.xbrl.org/2003/role/disclosureRef
-Topic 220
-SubTopic 10
-Name Accounting Standards Codification
-Section 45
-Paragraph 1B
-Subparagraph (b)
-Publisher FASB
-URI https://asc.fasb.org//1943274/2147482790/220-10-45-1B
Reference 5: http://www.xbrl.org/2003/role/disclosureRef
-Topic 220
-SubTopic 10
-Name Accounting Standards Codification
-Section 45
-Paragraph 1A
-Subparagraph (b)
-Publisher FASB
-URI https://asc.fasb.org//1943274/2147482790/220-10-45-1A
| Name: |
us-gaap_OtherComprehensiveIncomeLossNetOfTaxPortionAttributableToParent |
| Namespace Prefix: |
us-gaap_ |
| Data Type: |
xbrli:monetaryItemType |
| Balance Type: |
credit |
| Period Type: |
duration |
|
| X |
- DefinitionAmount, after tax, of reclassification adjustment from accumulated other comprehensive (income) loss for net periodic benefit cost (credit) of defined benefit plan. Reference 1: http://fasb.org/us-gaap/role/ref/legacyRef
-Name Accounting Standards Codification
-Section 45
-Paragraph 15
-SubTopic 10
-Topic 220
-Publisher FASB
-URI https://asc.fasb.org//1943274/2147482790/220-10-45-15
Reference 2: http://fasb.org/us-gaap/role/ref/legacyRef
-Topic 220
-SubTopic 10
-Name Accounting Standards Codification
-Section 45
-Paragraph 11
-Publisher FASB
-URI https://asc.fasb.org//1943274/2147482790/220-10-45-11
Reference 3: http://fasb.org/us-gaap/role/ref/legacyRef
-Topic 715
-SubTopic 20
-Name Accounting Standards Codification
-Section 50
-Paragraph 1
-Subparagraph (i)
-Publisher FASB
-URI https://asc.fasb.org//1943274/2147480506/715-20-50-1
Reference 4: http://www.xbrl.org/2003/role/disclosureRef
-Topic 220
-SubTopic 10
-Name Accounting Standards Codification
-Section 45
-Paragraph 17A
-Publisher FASB
-URI https://asc.fasb.org//1943274/2147482790/220-10-45-17A
| Name: |
us-gaap_OtherComprehensiveIncomeLossReclassificationAdjustmentFromAOCIPensionAndOtherPostretirementBenefitPlansNetOfTax |
| Namespace Prefix: |
us-gaap_ |
| Data Type: |
xbrli:monetaryItemType |
| Balance Type: |
credit |
| Period Type: |
duration |
|
| X |
- References
+ Details
| Name: |
us-gaap_StatementOfIncomeAndComprehensiveIncomeAbstract |
| Namespace Prefix: |
us-gaap_ |
| Data Type: |
xbrli:stringItemType |
| Balance Type: |
na |
| Period Type: |
duration |
|
v3.23.2
Consolidated Statements Of Comprehensive Income (Loss) (Parenthetical) - USD ($)
$ in Thousands |
3 Months Ended |
6 Months Ended |
Jun. 30, 2023 |
Jun. 30, 2022 |
Jun. 30, 2023 |
Jun. 30, 2022 |
| Statement of Comprehensive Income [Abstract] |
|
|
|
|
| Foreign currency translation adjustment, tax (benefit) |
$ (179)
|
$ (482)
|
$ (615)
|
$ (246)
|
| Other Comprehensive Income (Loss), Cash Flow Hedge, Gain (Loss), after Reclassification, Tax |
500
|
3,359
|
1,336
|
(443)
|
| Amortization of prior service costs and net gains or losses, tax |
$ 637
|
$ 712
|
$ 1,274
|
$ 1,424
|
| X |
- DefinitionAmount, after reclassification, of tax expense (benefit) for gain (loss) from derivative instrument designated and qualifying as cash flow hedge included in assessment of hedge effectiveness. Reference 1: http://www.xbrl.org/2003/role/disclosureRef
-Topic 220
-SubTopic 10
-Name Accounting Standards Codification
-Section 45
-Paragraph 12
-Publisher FASB
-URI https://asc.fasb.org//1943274/2147482790/220-10-45-12
| Name: |
us-gaap_OtherComprehensiveIncomeLossCashFlowHedgeGainLossAfterReclassificationTax |
| Namespace Prefix: |
us-gaap_ |
| Data Type: |
xbrli:monetaryItemType |
| Balance Type: |
debit |
| Period Type: |
duration |
|
| X |
- DefinitionAmount of tax expense (benefit), after reclassification adjustments of gain (loss) on foreign currency translation adjustments, foreign currency transactions designated and effective as economic hedges of a net investment in a foreign entity and intra-entity foreign currency transactions that are of a long-term-investment nature. Reference 1: http://fasb.org/us-gaap/role/ref/legacyRef
-Name Accounting Standards Codification
-Section 45
-Paragraph 10A
-Subparagraph (a)
-SubTopic 10
-Topic 220
-Publisher FASB
-URI https://asc.fasb.org//1943274/2147482790/220-10-45-10A
Reference 2: http://fasb.org/us-gaap/role/ref/legacyRef
-Name Accounting Standards Codification
-Section 45
-Paragraph 12
-SubTopic 10
-Topic 220
-Publisher FASB
-URI https://asc.fasb.org//1943274/2147482790/220-10-45-12
Reference 3: http://www.xbrl.org/2003/role/disclosureRef
-Topic 830
-SubTopic 20
-Name Accounting Standards Codification
-Section 45
-Paragraph 5
-Publisher FASB
-URI https://asc.fasb.org//1943274/2147481956/830-20-45-5
Reference 4: http://www.xbrl.org/2003/role/disclosureRef
-Topic 830
-SubTopic 30
-Name Accounting Standards Codification
-Section 45
-Paragraph 21
-Publisher FASB
-URI https://asc.fasb.org//1943274/2147481694/830-30-45-21
| Name: |
us-gaap_OtherComprehensiveIncomeLossForeignCurrencyTranslationAdjustmentTax |
| Namespace Prefix: |
us-gaap_ |
| Data Type: |
xbrli:monetaryItemType |
| Balance Type: |
debit |
| Period Type: |
duration |
|
| X |
- DefinitionAmount of tax (expense) benefit for reclassification adjustment from accumulated other comprehensive (income) loss of defined benefit plan. Reference 1: http://fasb.org/us-gaap/role/ref/legacyRef
-Name Accounting Standards Codification
-Section 45
-Paragraph 12
-SubTopic 10
-Topic 220
-Publisher FASB
-URI https://asc.fasb.org//1943274/2147482790/220-10-45-12
Reference 2: http://fasb.org/us-gaap/role/ref/legacyRef
-Topic 810
-SubTopic 10
-Name Accounting Standards Codification
-Section 45
-Paragraph 19
-Publisher FASB
-URI https://asc.fasb.org//1943274/2147481231/810-10-45-19
| Name: |
us-gaap_OtherComprehensiveIncomeLossReclassificationAdjustmentFromAOCIPensionAndOtherPostretirementBenefitPlansTax |
| Namespace Prefix: |
us-gaap_ |
| Data Type: |
xbrli:monetaryItemType |
| Balance Type: |
debit |
| Period Type: |
duration |
|
| X |
- References
+ Details
| Name: |
us-gaap_StatementOfIncomeAndComprehensiveIncomeAbstract |
| Namespace Prefix: |
us-gaap_ |
| Data Type: |
xbrli:stringItemType |
| Balance Type: |
na |
| Period Type: |
duration |
|
v3.23.2
Consolidated Statements Of Cash Flows - USD ($)
$ in Thousands |
6 Months Ended |
Jun. 30, 2023 |
Jun. 30, 2022 |
| Cash flows from operating activities: |
|
|
| Net Income (Loss) Attributable to Parent |
$ (19,934)
|
$ 31,292
|
| Adjustments for noncash items: |
|
|
| Depreciation |
12,387
|
11,536
|
| Amortization of identifiable intangibles |
968
|
1,329
|
| Reduction of right-of-use lease asset |
1,075
|
1,072
|
| Goodwill, Impairment Loss |
15,413
|
0
|
| Deferred income taxes |
(3,731)
|
2,516
|
| Accrued pension and post-retirement benefits |
6,837
|
7,013
|
| Stock-based compensation expense |
521
|
1,842
|
| Gain on investment in kaléo |
(262)
|
(1,406)
|
| Changes in assets and liabilities: |
|
|
| Accounts and other receivables |
6,190
|
(24,172)
|
| Inventories |
43,013
|
(31,495)
|
| Income taxes recoverable/payable |
(1,060)
|
(6,129)
|
| Prepaid expenses and other |
2,976
|
(516)
|
| Accounts payable and accrued expenses |
(39,629)
|
47,388
|
| Lease liability |
(1,095)
|
(1,166)
|
| Pension and postretirement benefit plan contributions |
(279)
|
(50,314)
|
| Other, net |
(692)
|
1,781
|
| Net Cash Provided by (Used in) Operating Activities |
22,698
|
(9,429)
|
| Cash flows from investing activities: |
|
|
| Capital expenditures |
(15,907)
|
(13,514)
|
| Proceeds from Sale of Investment Projects |
262
|
1,406
|
| Net cash provided by (used in) investing activities |
(15,645)
|
(12,108)
|
| Cash flows from financing activities: |
|
|
| Borrowings |
41,250
|
221,250
|
| Debt principal payments |
(37,250)
|
(192,750)
|
| Dividends paid |
(8,884)
|
(8,135)
|
| Payments of Financing Costs |
0
|
(1,245)
|
| Other |
0
|
(396)
|
| Net cash provided by (used in) financing activities |
(4,884)
|
18,724
|
| Effect of exchange rate changes on cash |
(208)
|
(246)
|
| Increase (decrease) in cash & cash equivalents |
1,961
|
(3,059)
|
| Cash, cash equivalents, and restricted cash at beginning of period |
19,232
|
30,521
|
| Cash, cash equivalents, and restricted cash at end of period |
$ 21,193
|
$ 27,462
|
| X |
- DefinitionIncrease decrease in net deferred taxes.
| Name: |
tg_IncreaseDecreaseInNetDeferredTaxes |
| Namespace Prefix: |
tg_ |
| Data Type: |
xbrli:monetaryItemType |
| Balance Type: |
debit |
| Period Type: |
duration |
|
| X |
- References
+ Details
| Name: |
us-gaap_AdjustmentsNoncashItemsToReconcileNetIncomeLossToCashProvidedByUsedInOperatingActivitiesAbstract |
| Namespace Prefix: |
us-gaap_ |
| Data Type: |
xbrli:stringItemType |
| Balance Type: |
na |
| Period Type: |
duration |
|
| X |
- DefinitionAmount of expense for award under share-based payment arrangement. Excludes amount capitalized. Reference 1: http://www.xbrl.org/2003/role/disclosureRef
-Topic 718
-SubTopic 10
-Name Accounting Standards Codification
-Section S99
-Paragraph 1
-Subparagraph (SAB Topic 14.F)
-Publisher FASB
-URI https://asc.fasb.org//1943274/2147479830/718-10-S99-1
Reference 2: http://www.xbrl.org/2003/role/disclosureRef
-Topic 718
-SubTopic 10
-Name Accounting Standards Codification
-Section 50
-Paragraph 2
-Subparagraph (h)(1)(i)
-Publisher FASB
-URI https://asc.fasb.org//1943274/2147480429/718-10-50-2
| Name: |
us-gaap_AllocatedShareBasedCompensationExpense |
| Namespace Prefix: |
us-gaap_ |
| Data Type: |
xbrli:monetaryItemType |
| Balance Type: |
debit |
| Period Type: |
duration |
|
| X |
- DefinitionThe aggregate expense charged against earnings to allocate the cost of intangible assets (nonphysical assets not used in production) in a systematic and rational manner to the periods expected to benefit from such assets. As a noncash expense, this element is added back to net income when calculating cash provided by or used in operations using the indirect method. Reference 1: http://fasb.org/us-gaap/role/ref/legacyRef
-Name Accounting Standards Codification
-Section 45
-Paragraph 28
-Subparagraph (b)
-SubTopic 10
-Topic 230
-Publisher FASB
-URI https://asc.fasb.org//1943274/2147482740/230-10-45-28
Reference 2: http://fasb.org/us-gaap/role/ref/legacyRef
-Name Accounting Standards Codification
-Topic 350
-SubTopic 30
-Section 45
-Paragraph 2
-Publisher FASB
-URI https://asc.fasb.org//1943274/2147482686/350-30-45-2
Reference 3: http://fasb.org/us-gaap/role/ref/legacyRef
-Name Accounting Standards Codification
-Topic 350
-SubTopic 30
-Section 50
-Paragraph 2
-Subparagraph (a)(2)
-Publisher FASB
-URI https://asc.fasb.org//1943274/2147482665/350-30-50-2
| Name: |
us-gaap_AmortizationOfIntangibleAssets |
| Namespace Prefix: |
us-gaap_ |
| Data Type: |
xbrli:monetaryItemType |
| Balance Type: |
debit |
| Period Type: |
duration |
|
| X |
- DefinitionAmount of cash and cash equivalents, and cash and cash equivalents restricted to withdrawal or usage. Excludes amount for disposal group and discontinued operations. Cash includes, but is not limited to, currency on hand, demand deposits with banks or financial institutions, and other accounts with general characteristics of demand deposits. Cash equivalents include, but are not limited to, short-term, highly liquid investments that are both readily convertible to known amounts of cash and so near their maturity that they present insignificant risk of changes in value because of changes in interest rates. Reference 1: http://www.xbrl.org/2003/role/disclosureRef
-Topic 230
-SubTopic 10
-Name Accounting Standards Codification
-Section 50
-Paragraph 8
-Publisher FASB
-URI https://asc.fasb.org//1943274/2147482913/230-10-50-8
Reference 2: http://fasb.org/us-gaap/role/ref/legacyRef
-Topic 230
-SubTopic 10
-Name Accounting Standards Codification
-Section 45
-Paragraph 24
-Publisher FASB
-URI https://asc.fasb.org//1943274/2147482740/230-10-45-24
Reference 3: http://fasb.org/us-gaap/role/ref/legacyRef
-Name Accounting Standards Codification
-Topic 230
-SubTopic 10
-Section 45
-Paragraph 4
-Publisher FASB
-URI https://asc.fasb.org//1943274/2147482740/230-10-45-4
| Name: |
us-gaap_CashCashEquivalentsRestrictedCashAndRestrictedCashEquivalents |
| Namespace Prefix: |
us-gaap_ |
| Data Type: |
xbrli:monetaryItemType |
| Balance Type: |
debit |
| Period Type: |
instant |
|
| X |
- DefinitionAmount of increase (decrease) in cash, cash equivalents, and cash and cash equivalents restricted to withdrawal or usage; including effect from exchange rate change. Cash includes, but is not limited to, currency on hand, demand deposits with banks or financial institutions, and other accounts with general characteristics of demand deposits. Cash equivalents include, but are not limited to, short-term, highly liquid investments that are both readily convertible to known amounts of cash and so near their maturity that they present insignificant risk of changes in value because of changes in interest rates. Reference 1: http://fasb.org/us-gaap/role/ref/legacyRef
-Topic 230
-SubTopic 10
-Name Accounting Standards Codification
-Section 45
-Paragraph 24
-Publisher FASB
-URI https://asc.fasb.org//1943274/2147482740/230-10-45-24
Reference 2: http://fasb.org/us-gaap/role/ref/legacyRef
-Name Accounting Standards Codification
-Section 45
-Paragraph 1
-SubTopic 230
-Topic 830
-Publisher FASB
-URI https://asc.fasb.org//1943274/2147481877/830-230-45-1
| Name: |
us-gaap_CashCashEquivalentsRestrictedCashAndRestrictedCashEquivalentsPeriodIncreaseDecreaseIncludingExchangeRateEffect |
| Namespace Prefix: |
us-gaap_ |
| Data Type: |
xbrli:monetaryItemType |
| Balance Type: |
debit |
| Period Type: |
duration |
|
| X |
- DefinitionThe amount of expense recognized in the current period that reflects the allocation of the cost of tangible assets over the assets' useful lives. Includes production and non-production related depreciation. Reference 1: http://fasb.org/us-gaap/role/ref/legacyRef
-Name Accounting Standards Codification
-Section 45
-Paragraph 28
-Subparagraph (b)
-SubTopic 10
-Topic 230
-Publisher FASB
-URI https://asc.fasb.org//1943274/2147482740/230-10-45-28
Reference 2: http://fasb.org/us-gaap/role/ref/legacyRef
-Name Accounting Standards Codification
-Topic 360
-SubTopic 10
-Section 50
-Paragraph 1
-Subparagraph (a)
-Publisher FASB
-URI https://asc.fasb.org//1943274/2147482099/360-10-50-1
| Name: |
us-gaap_Depreciation |
| Namespace Prefix: |
us-gaap_ |
| Data Type: |
xbrli:monetaryItemType |
| Balance Type: |
debit |
| Period Type: |
duration |
|
| X |
- DefinitionAmount of increase (decrease) from effect of exchange rate changes on cash and cash equivalents, and cash and cash equivalents restricted to withdrawal or usage; held in foreign currencies. Excludes amounts for disposal group and discontinued operations. Cash includes, but is not limited to, currency on hand, demand deposits with banks or financial institutions, and other accounts with general characteristics of demand deposits. Cash equivalents include, but are not limited to, short-term, highly liquid investments that are both readily convertible to known amounts of cash and so near their maturity that they present insignificant risk of changes in value because of changes in interest rates. Reference 1: http://www.xbrl.org/2003/role/disclosureRef
-Topic 830
-SubTopic 230
-Name Accounting Standards Codification
-Section 45
-Paragraph 1
-Publisher FASB
-URI https://asc.fasb.org//1943274/2147481877/830-230-45-1
| Name: |
us-gaap_EffectOfExchangeRateOnCashCashEquivalentsRestrictedCashAndRestrictedCashEquivalents |
| Namespace Prefix: |
us-gaap_ |
| Data Type: |
xbrli:monetaryItemType |
| Balance Type: |
debit |
| Period Type: |
duration |
|
| X |
- DefinitionAmount of loss from the write-down of an asset representing the future economic benefits arising from other assets acquired in a business combination that are not individually identified and separately recognized. Reference 1: http://fasb.org/us-gaap/role/ref/legacyRef
-Name Accounting Standards Codification
-Section 45
-Paragraph 28
-Subparagraph (b)
-SubTopic 10
-Topic 230
-Publisher FASB
-URI https://asc.fasb.org//1943274/2147482740/230-10-45-28
Reference 2: http://www.xbrl.org/2003/role/exampleRef
-Topic 350
-SubTopic 20
-Name Accounting Standards Codification
-Section 55
-Paragraph 24
-Publisher FASB
-URI https://asc.fasb.org//1943274/2147482548/350-20-55-24
Reference 3: http://www.xbrl.org/2003/role/disclosureRef
-Topic 350
-SubTopic 20
-Name Accounting Standards Codification
-Section 50
-Paragraph 1
-Subparagraph (e)
-Publisher FASB
-URI https://asc.fasb.org//1943274/2147482573/350-20-50-1
Reference 4: http://www.xbrl.org/2003/role/disclosureRef
-Topic 350
-SubTopic 20
-Name Accounting Standards Codification
-Section 50
-Paragraph 2
-Subparagraph (b)
-Publisher FASB
-URI https://asc.fasb.org//1943274/2147482573/350-20-50-2
Reference 5: http://www.xbrl.org/2003/role/disclosureRef
-Topic 350
-SubTopic 20
-Name Accounting Standards Codification
-Section 45
-Paragraph 2
-Publisher FASB
-URI https://asc.fasb.org//1943274/2147482598/350-20-45-2
| Name: |
us-gaap_GoodwillImpairmentLoss |
| Namespace Prefix: |
us-gaap_ |
| Data Type: |
xbrli:monetaryItemType |
| Balance Type: |
debit |
| Period Type: |
duration |
|
| X |
- DefinitionThe increase (decrease) during the reporting period in the amount due from customers for the credit sale of goods and services; includes accounts receivable and other types of receivables. Reference 1: http://fasb.org/us-gaap/role/ref/legacyRef
-Name Accounting Standards Codification
-Section 45
-Paragraph 28
-Subparagraph (a)
-SubTopic 10
-Topic 230
-Publisher FASB
-URI https://asc.fasb.org//1943274/2147482740/230-10-45-28
| Name: |
us-gaap_IncreaseDecreaseInAccountsAndOtherReceivables |
| Namespace Prefix: |
us-gaap_ |
| Data Type: |
xbrli:monetaryItemType |
| Balance Type: |
credit |
| Period Type: |
duration |
|
| X |
- DefinitionThe increase (decrease) during the reporting period in the amounts payable to vendors for goods and services received and the amount of obligations and expenses incurred but not paid. Reference 1: http://fasb.org/us-gaap/role/ref/legacyRef
-Name Accounting Standards Codification
-Section 45
-Paragraph 28
-Subparagraph (a)
-SubTopic 10
-Topic 230
-Publisher FASB
-URI https://asc.fasb.org//1943274/2147482740/230-10-45-28
| Name: |
us-gaap_IncreaseDecreaseInAccountsPayableAndAccruedLiabilities |
| Namespace Prefix: |
us-gaap_ |
| Data Type: |
xbrli:monetaryItemType |
| Balance Type: |
debit |
| Period Type: |
duration |
|
| X |
- DefinitionThe increase (decrease) during the reporting period in the aggregate value of all inventory held by the reporting entity, associated with underlying transactions that are classified as operating activities. Reference 1: http://fasb.org/us-gaap/role/ref/legacyRef
-Name Accounting Standards Codification
-Section 45
-Paragraph 28
-Subparagraph (a)
-SubTopic 10
-Topic 230
-Publisher FASB
-URI https://asc.fasb.org//1943274/2147482740/230-10-45-28
| Name: |
us-gaap_IncreaseDecreaseInInventories |
| Namespace Prefix: |
us-gaap_ |
| Data Type: |
xbrli:monetaryItemType |
| Balance Type: |
credit |
| Period Type: |
duration |
|
| X |
- References
+ Details
| Name: |
us-gaap_IncreaseDecreaseInOperatingCapitalAbstract |
| Namespace Prefix: |
us-gaap_ |
| Data Type: |
xbrli:stringItemType |
| Balance Type: |
na |
| Period Type: |
duration |
|
| X |
- DefinitionAmount of increase (decrease) in obligation for pension and other postretirement benefits. Includes, but is not limited to, defined benefit and defined contribution plans. Reference 1: http://fasb.org/us-gaap/role/ref/legacyRef
-Name Accounting Standards Codification
-Section 45
-Paragraph 28
-Subparagraph (a)
-SubTopic 10
-Topic 230
-Publisher FASB
-URI https://asc.fasb.org//1943274/2147482740/230-10-45-28
| Name: |
us-gaap_IncreaseDecreaseInPensionAndPostretirementObligations |
| Namespace Prefix: |
us-gaap_ |
| Data Type: |
xbrli:monetaryItemType |
| Balance Type: |
debit |
| Period Type: |
duration |
|
| X |
- DefinitionAmount of increase (decrease) in prepaid expenses, and assets classified as other. Reference 1: http://fasb.org/us-gaap/role/ref/legacyRef
-Name Accounting Standards Codification
-Section 45
-Paragraph 28
-Subparagraph (a)
-SubTopic 10
-Topic 230
-Publisher FASB
-URI https://asc.fasb.org//1943274/2147482740/230-10-45-28
| Name: |
us-gaap_IncreaseDecreaseInPrepaidDeferredExpenseAndOtherAssets |
| Namespace Prefix: |
us-gaap_ |
| Data Type: |
xbrli:monetaryItemType |
| Balance Type: |
credit |
| Period Type: |
duration |
|
| X |
- DefinitionAmount of cash inflow (outflow) from financing activities, including discontinued operations. Financing activity cash flows include obtaining resources from owners and providing them with a return on, and a return of, their investment; borrowing money and repaying amounts borrowed, or settling the obligation; and obtaining and paying for other resources obtained from creditors on long-term credit. Reference 1: http://www.xbrl.org/2003/role/disclosureRef
-Topic 230
-SubTopic 10
-Name Accounting Standards Codification
-Section 45
-Paragraph 24
-Publisher FASB
-URI https://asc.fasb.org//1943274/2147482740/230-10-45-24
| Name: |
us-gaap_NetCashProvidedByUsedInFinancingActivities |
| Namespace Prefix: |
us-gaap_ |
| Data Type: |
xbrli:monetaryItemType |
| Balance Type: |
debit |
| Period Type: |
duration |
|
| X |
- References
+ Details
| Name: |
us-gaap_NetCashProvidedByUsedInFinancingActivitiesAbstract |
| Namespace Prefix: |
us-gaap_ |
| Data Type: |
xbrli:stringItemType |
| Balance Type: |
na |
| Period Type: |
duration |
|
| X |
- DefinitionAmount of cash inflow (outflow) from investing activities, including discontinued operations. Investing activity cash flows include making and collecting loans and acquiring and disposing of debt or equity instruments and property, plant, and equipment and other productive assets. Reference 1: http://www.xbrl.org/2003/role/disclosureRef
-Topic 230
-SubTopic 10
-Name Accounting Standards Codification
-Section 45
-Paragraph 24
-Publisher FASB
-URI https://asc.fasb.org//1943274/2147482740/230-10-45-24
| Name: |
us-gaap_NetCashProvidedByUsedInInvestingActivities |
| Namespace Prefix: |
us-gaap_ |
| Data Type: |
xbrli:monetaryItemType |
| Balance Type: |
debit |
| Period Type: |
duration |
|
| X |
- References
+ Details
| Name: |
us-gaap_NetCashProvidedByUsedInInvestingActivitiesAbstract |
| Namespace Prefix: |
us-gaap_ |
| Data Type: |
xbrli:stringItemType |
| Balance Type: |
na |
| Period Type: |
duration |
|
| X |
- DefinitionAmount of cash inflow (outflow) from operating activities, including discontinued operations. Operating activity cash flows include transactions, adjustments, and changes in value not defined as investing or financing activities. Reference 1: http://fasb.org/us-gaap/role/ref/legacyRef
-Topic 230
-SubTopic 10
-Name Accounting Standards Codification
-Section 45
-Paragraph 28
-Publisher FASB
-URI https://asc.fasb.org//1943274/2147482740/230-10-45-28
Reference 2: http://fasb.org/us-gaap/role/ref/legacyRef
-Topic 230
-SubTopic 10
-Name Accounting Standards Codification
-Section 45
-Paragraph 24
-Publisher FASB
-URI https://asc.fasb.org//1943274/2147482740/230-10-45-24
Reference 3: http://fasb.org/us-gaap/role/ref/legacyRef
-Topic 230
-SubTopic 10
-Name Accounting Standards Codification
-Section 45
-Paragraph 25
-Publisher FASB
-URI https://asc.fasb.org//1943274/2147482740/230-10-45-25
| Name: |
us-gaap_NetCashProvidedByUsedInOperatingActivities |
| Namespace Prefix: |
us-gaap_ |
| Data Type: |
xbrli:monetaryItemType |
| Balance Type: |
na |
| Period Type: |
duration |
|
| X |
- References
+ Details
| Name: |
us-gaap_NetCashProvidedByUsedInOperatingActivitiesAbstract |
| Namespace Prefix: |
us-gaap_ |
| Data Type: |
xbrli:stringItemType |
| Balance Type: |
na |
| Period Type: |
duration |
|
| X |
- DefinitionThe portion of profit or loss for the period, net of income taxes, which is attributable to the parent. Reference 1: http://www.xbrl.org/2003/role/disclosureRef
-Topic 235
-SubTopic 10
-Name Accounting Standards Codification
-Section S99
-Paragraph 1
-Subparagraph (SX 210.4-08(g)(1)(ii))
-Publisher FASB
-URI https://asc.fasb.org//1943274/2147480678/235-10-S99-1
Reference 2: http://www.xbrl.org/2003/role/disclosureRef
-Topic 323
-SubTopic 10
-Name Accounting Standards Codification
-Section 50
-Paragraph 3
-Subparagraph (c)
-Publisher FASB
-URI https://asc.fasb.org//1943274/2147481687/323-10-50-3
Reference 3: http://www.xbrl.org/2003/role/disclosureRef
-Topic 825
-SubTopic 10
-Name Accounting Standards Codification
-Section 50
-Paragraph 28
-Subparagraph (f)
-Publisher FASB
-URI https://asc.fasb.org//1943274/2147482907/825-10-50-28
Reference 4: http://www.xbrl.org/2003/role/disclosureRef
-Topic 220
-SubTopic 10
-Name Accounting Standards Codification
-Section 50
-Paragraph 6
-Publisher FASB
-URI https://asc.fasb.org//1943274/2147482765/220-10-50-6
Reference 5: http://www.xbrl.org/2003/role/disclosureRef
-Topic 250
-SubTopic 10
-Name Accounting Standards Codification
-Section 50
-Paragraph 3
-Publisher FASB
-URI https://asc.fasb.org//1943274/2147483443/250-10-50-3
Reference 6: http://www.xbrl.org/2003/role/disclosureRef
-Topic 250
-SubTopic 10
-Name Accounting Standards Codification
-Section 50
-Paragraph 1
-Subparagraph (b)(2)
-Publisher FASB
-URI https://asc.fasb.org//1943274/2147483443/250-10-50-1
Reference 7: http://www.xbrl.org/2003/role/disclosureRef
-Topic 815
-SubTopic 40
-Name Accounting Standards Codification
-Section 65
-Paragraph 1
-Subparagraph (f)
-Publisher FASB
-URI https://asc.fasb.org//1943274/2147480175/815-40-65-1
Reference 8: http://www.xbrl.org/2003/role/disclosureRef
-Topic 250
-SubTopic 10
-Name Accounting Standards Codification
-Section 50
-Paragraph 8
-Publisher FASB
-URI https://asc.fasb.org//1943274/2147483443/250-10-50-8
Reference 9: http://www.xbrl.org/2003/role/disclosureRef
-Topic 250
-SubTopic 10
-Name Accounting Standards Codification
-Section 50
-Paragraph 9
-Publisher FASB
-URI https://asc.fasb.org//1943274/2147483443/250-10-50-9
Reference 10: http://www.xbrl.org/2003/role/disclosureRef
-Topic 250
-SubTopic 10
-Name Accounting Standards Codification
-Section 50
-Paragraph 11
-Subparagraph (a)
-Publisher FASB
-URI https://asc.fasb.org//1943274/2147483443/250-10-50-11
Reference 11: http://www.xbrl.org/2003/role/disclosureRef
-Topic 250
-SubTopic 10
-Name Accounting Standards Codification
-Section 50
-Paragraph 11
-Subparagraph (b)
-Publisher FASB
-URI https://asc.fasb.org//1943274/2147483443/250-10-50-11
Reference 12: http://www.xbrl.org/2003/role/disclosureRef
-Topic 250
-SubTopic 10
-Name Accounting Standards Codification
-Section 50
-Paragraph 4
-Publisher FASB
-URI https://asc.fasb.org//1943274/2147483443/250-10-50-4
Reference 13: http://www.xbrl.org/2003/role/exampleRef
-Topic 946
-SubTopic 830
-Name Accounting Standards Codification
-Section 55
-Paragraph 10
-Publisher FASB
-URI https://asc.fasb.org//1943274/2147480167/946-830-55-10
Reference 14: http://www.xbrl.org/2003/role/disclosureRef
-Topic 946
-SubTopic 220
-Name Accounting Standards Codification
-Section 45
-Paragraph 7
-Publisher FASB
-URI https://asc.fasb.org//1943274/2147483581/946-220-45-7
Reference 15: http://www.xbrl.org/2003/role/disclosureRef
-Topic 944
-SubTopic 220
-Name Accounting Standards Codification
-Section S99
-Paragraph 1
-Subparagraph (SX 210.7-04(18))
-Publisher FASB
-URI https://asc.fasb.org//1943274/2147483586/944-220-S99-1
Reference 16: http://www.xbrl.org/2003/role/disclosureRef
-Topic 280
-SubTopic 10
-Name Accounting Standards Codification
-Section 50
-Paragraph 22
-Publisher FASB
-URI https://asc.fasb.org//1943274/2147482810/280-10-50-22
Reference 17: http://www.xbrl.org/2003/role/disclosureRef
-Topic 946
-SubTopic 220
-Name Accounting Standards Codification
-Section S99
-Paragraph 1
-Subparagraph (SX 210.6-07(9))
-Publisher FASB
-URI https://asc.fasb.org//1943274/2147483575/946-220-S99-1
Reference 18: http://www.xbrl.org/2003/role/disclosureRef
-Topic 946
-SubTopic 220
-Name Accounting Standards Codification
-Section S99
-Paragraph 3
-Subparagraph (SX 210.6-09(1)(d))
-Publisher FASB
-URI https://asc.fasb.org//1943274/2147483575/946-220-S99-3
Reference 19: http://www.xbrl.org/2003/role/disclosureRef
-Topic 470
-SubTopic 10
-Name Accounting Standards Codification
-Section S99
-Paragraph 1A
-Subparagraph (SX 210.13-01(a)(4)(i))
-Publisher FASB
-URI https://asc.fasb.org//1943274/2147480097/470-10-S99-1A
Reference 20: http://www.xbrl.org/2009/role/commonPracticeRef
-Topic 470
-SubTopic 10
-Name Accounting Standards Codification
-Section S99
-Paragraph 1A
-Subparagraph (SX 210.13-01(a)(4)(ii))
-Publisher FASB
-URI https://asc.fasb.org//1943274/2147480097/470-10-S99-1A
Reference 21: http://www.xbrl.org/2003/role/disclosureRef
-Topic 470
-SubTopic 10
-Name Accounting Standards Codification
-Section S99
-Paragraph 1A
-Subparagraph (SX 210.13-01(a)(4)(iii)(A))
-Publisher FASB
-URI https://asc.fasb.org//1943274/2147480097/470-10-S99-1A
Reference 22: http://www.xbrl.org/2003/role/disclosureRef
-Topic 470
-SubTopic 10
-Name Accounting Standards Codification
-Section S99
-Paragraph 1A
-Subparagraph (SX 210.13-01(a)(4)(iv))
-Publisher FASB
-URI https://asc.fasb.org//1943274/2147480097/470-10-S99-1A
Reference 23: http://www.xbrl.org/2003/role/disclosureRef
-Topic 470
-SubTopic 10
-Name Accounting Standards Codification
-Section S99
-Paragraph 1A
-Subparagraph (SX 210.13-01(a)(5))
-Publisher FASB
-URI https://asc.fasb.org//1943274/2147480097/470-10-S99-1A
Reference 24: http://www.xbrl.org/2003/role/disclosureRef
-Topic 470
-SubTopic 10
-Name Accounting Standards Codification
-Section S99
-Paragraph 1B
-Subparagraph (SX 210.13-02(a)(4)(i))
-Publisher FASB
-URI https://asc.fasb.org//1943274/2147480097/470-10-S99-1B
Reference 25: http://www.xbrl.org/2003/role/disclosureRef
-Topic 470
-SubTopic 10
-Name Accounting Standards Codification
-Section S99
-Paragraph 1B
-Subparagraph (SX 210.13-02(a)(4)(iii)(A))
-Publisher FASB
-URI https://asc.fasb.org//1943274/2147480097/470-10-S99-1B
Reference 26: http://www.xbrl.org/2003/role/disclosureRef
-Topic 470
-SubTopic 10
-Name Accounting Standards Codification
-Section S99
-Paragraph 1B
-Subparagraph (SX 210.13-02(a)(4)(iii)(B))
-Publisher FASB
-URI https://asc.fasb.org//1943274/2147480097/470-10-S99-1B
Reference 27: http://www.xbrl.org/2003/role/disclosureRef
-Topic 470
-SubTopic 10
-Name Accounting Standards Codification
-Section S99
-Paragraph 1B
-Subparagraph (SX 210.13-02(a)(4)(iv))
-Publisher FASB
-URI https://asc.fasb.org//1943274/2147480097/470-10-S99-1B
Reference 28: http://www.xbrl.org/2003/role/disclosureRef
-Topic 470
-SubTopic 10
-Name Accounting Standards Codification
-Section S99
-Paragraph 1B
-Subparagraph (SX 210.13-02(a)(5))
-Publisher FASB
-URI https://asc.fasb.org//1943274/2147480097/470-10-S99-1B
Reference 29: http://www.xbrl.org/2003/role/disclosureRef
-Topic 280
-SubTopic 10
-Name Accounting Standards Codification
-Section 50
-Paragraph 30
-Subparagraph (b)
-Publisher FASB
-URI https://asc.fasb.org//1943274/2147482810/280-10-50-30
Reference 30: http://www.xbrl.org/2003/role/disclosureRef
-Topic 280
-SubTopic 10
-Name Accounting Standards Codification
-Section 50
-Paragraph 32
-Subparagraph (f)
-Publisher FASB
-URI https://asc.fasb.org//1943274/2147482810/280-10-50-32
Reference 31: http://www.xbrl.org/2003/role/disclosureRef
-Topic 260
-SubTopic 10
-Name Accounting Standards Codification
-Section 45
-Paragraph 60B
-Subparagraph (a)
-Publisher FASB
-URI https://asc.fasb.org//1943274/2147482689/260-10-45-60B
Reference 32: http://www.xbrl.org/2003/role/exampleRef
-Topic 280
-SubTopic 10
-Name Accounting Standards Codification
-Section 50
-Paragraph 31
-Publisher FASB
-URI https://asc.fasb.org//1943274/2147482810/280-10-50-31
Reference 33: http://www.xbrl.org/2003/role/disclosureRef
-Topic 280
-SubTopic 10
-Name Accounting Standards Codification
-Section 50
-Paragraph 32
-Subparagraph (c)
-Publisher FASB
-URI https://asc.fasb.org//1943274/2147482810/280-10-50-32
Reference 34: http://www.xbrl.org/2003/role/disclosureRef
-Topic 205
-SubTopic 20
-Name Accounting Standards Codification
-Section 50
-Paragraph 7
-Publisher FASB
-URI https://asc.fasb.org//1943274/2147483499/205-20-50-7
Reference 35: http://fasb.org/us-gaap/role/ref/legacyRef
-Topic 230
-SubTopic 10
-Name Accounting Standards Codification
-Section 45
-Paragraph 28
-Publisher FASB
-URI https://asc.fasb.org//1943274/2147482740/230-10-45-28
Reference 36: http://www.xbrl.org/2003/role/disclosureRef
-Topic 220
-SubTopic 10
-Name Accounting Standards Codification
-Section 45
-Paragraph 1A
-Subparagraph (a)
-Publisher FASB
-URI https://asc.fasb.org//1943274/2147482790/220-10-45-1A
Reference 37: http://www.xbrl.org/2003/role/disclosureRef
-Topic 220
-SubTopic 10
-Name Accounting Standards Codification
-Section 45
-Paragraph 1B
-Subparagraph (a)
-Publisher FASB
-URI https://asc.fasb.org//1943274/2147482790/220-10-45-1B
Reference 38: http://fasb.org/us-gaap/role/ref/legacyRef
-Topic 220
-SubTopic 10
-Name Accounting Standards Codification
-Section S99
-Paragraph 2
-Subparagraph (SX 210.5-03(20))
-Publisher FASB
-URI https://asc.fasb.org//1943274/2147483621/220-10-S99-2
Reference 39: http://fasb.org/us-gaap/role/ref/legacyRef
-Topic 942
-SubTopic 220
-Name Accounting Standards Codification
-Section S99
-Paragraph 1
-Subparagraph (SX 210.9-04(22))
-Publisher FASB
-URI https://asc.fasb.org//1943274/2147483589/942-220-S99-1
| Name: |
us-gaap_NetIncomeLoss |
| Namespace Prefix: |
us-gaap_ |
| Data Type: |
xbrli:monetaryItemType |
| Balance Type: |
credit |
| Period Type: |
duration |
|
| X |
- DefinitionAmount of periodic reduction over lease term of carrying amount of right-of-use asset from operating lease. Reference 1: http://www.xbrl.org/2009/role/commonPracticeRef
-Topic 230
-SubTopic 10
-Name Accounting Standards Codification
-Section 45
-Paragraph 28
-Subparagraph (b)
-Publisher FASB
-URI https://asc.fasb.org//1943274/2147482740/230-10-45-28
| Name: |
us-gaap_OperatingLeaseRightOfUseAssetAmortizationExpense |
| Namespace Prefix: |
us-gaap_ |
| Data Type: |
xbrli:monetaryItemType |
| Balance Type: |
debit |
| Period Type: |
duration |
|
| X |
- DefinitionOther cash or noncash adjustments to reconcile net income to cash provided by (used in) operating activities that are not separately disclosed in the statement of cash flows (for example, cash received or cash paid during the current period for miscellaneous operating activities, net change during the reporting period in other assets or other liabilities).
| Name: |
us-gaap_OtherOperatingActivitiesCashFlowStatement |
| Namespace Prefix: |
us-gaap_ |
| Data Type: |
xbrli:monetaryItemType |
| Balance Type: |
debit |
| Period Type: |
duration |
|
| X |
- DefinitionAmount of cash outflow in the form of ordinary dividends to common shareholders of the parent entity. Reference 1: http://fasb.org/us-gaap/role/ref/legacyRef
-Name Accounting Standards Codification
-Topic 230
-SubTopic 10
-Section 45
-Paragraph 15
-Subparagraph (a)
-Publisher FASB
-URI https://asc.fasb.org//1943274/2147482740/230-10-45-15
| Name: |
us-gaap_PaymentsOfDividendsCommonStock |
| Namespace Prefix: |
us-gaap_ |
| Data Type: |
xbrli:monetaryItemType |
| Balance Type: |
credit |
| Period Type: |
duration |
|
| X |
- DefinitionThe cash outflow for loan and debt issuance costs. Reference 1: http://fasb.org/us-gaap/role/ref/legacyRef
-Name Accounting Standards Codification
-Topic 230
-SubTopic 10
-Section 45
-Paragraph 15
-Publisher FASB
-URI https://asc.fasb.org//1943274/2147482740/230-10-45-15
| Name: |
us-gaap_PaymentsOfFinancingCosts |
| Namespace Prefix: |
us-gaap_ |
| Data Type: |
xbrli:monetaryItemType |
| Balance Type: |
credit |
| Period Type: |
duration |
|
| X |
- DefinitionThe cash outflow associated with the acquisition of long-lived, physical assets that are used in the normal conduct of business to produce goods and services and not intended for resale; includes cash outflows to pay for construction of self-constructed assets. Reference 1: http://fasb.org/us-gaap/role/ref/legacyRef
-Topic 230
-SubTopic 10
-Name Accounting Standards Codification
-Section 45
-Paragraph 13
-Subparagraph (c)
-Publisher FASB
-URI https://asc.fasb.org//1943274/2147482740/230-10-45-13
| Name: |
us-gaap_PaymentsToAcquirePropertyPlantAndEquipment |
| Namespace Prefix: |
us-gaap_ |
| Data Type: |
xbrli:monetaryItemType |
| Balance Type: |
credit |
| Period Type: |
duration |
|
| X |
- DefinitionAmount of cash outflow for pension and other postretirement benefits. Includes, but is not limited to, employer contribution to fund plan asset and payment to retiree. Reference 1: http://fasb.org/us-gaap/role/ref/legacyRef
-Name Accounting Standards Codification
-Section 45
-Paragraph 25
-Subparagraph (g)
-SubTopic 10
-Topic 230
-Publisher FASB
-URI https://asc.fasb.org//1943274/2147482740/230-10-45-25
| Name: |
us-gaap_PensionAndOtherPostretirementBenefitContributions |
| Namespace Prefix: |
us-gaap_ |
| Data Type: |
xbrli:monetaryItemType |
| Balance Type: |
credit |
| Period Type: |
duration |
|
| X |
- DefinitionThe cash inflow from a contractual arrangement with the lender, including letter of credit, standby letter of credit and revolving credit arrangements, under which borrowings can be made up to a specific amount at any point in time with maturities due beyond one year or the operating cycle, if longer. Reference 1: http://fasb.org/us-gaap/role/ref/legacyRef
-Name Accounting Standards Codification
-Topic 230
-SubTopic 10
-Section 45
-Paragraph 14
-Subparagraph (b)
-Publisher FASB
-URI https://asc.fasb.org//1943274/2147482740/230-10-45-14
| Name: |
us-gaap_ProceedsFromLongTermLinesOfCredit |
| Namespace Prefix: |
us-gaap_ |
| Data Type: |
xbrli:monetaryItemType |
| Balance Type: |
debit |
| Period Type: |
duration |
|
| X |
- DefinitionAmount of cash inflow (outflow) from financing activities classified as other. Reference 1: http://www.xbrl.org/2009/role/commonPracticeRef
-Topic 230
-SubTopic 10
-Name Accounting Standards Codification
-Section 45
-Paragraph 14
-Publisher FASB
-URI https://asc.fasb.org//1943274/2147482740/230-10-45-14
Reference 2: http://www.xbrl.org/2009/role/commonPracticeRef
-Name Accounting Standards Codification
-Section 45
-Paragraph 15
-SubTopic 10
-Topic 230
-Publisher FASB
-URI https://asc.fasb.org//1943274/2147482740/230-10-45-15
| Name: |
us-gaap_ProceedsFromPaymentsForOtherFinancingActivities |
| Namespace Prefix: |
us-gaap_ |
| Data Type: |
xbrli:monetaryItemType |
| Balance Type: |
debit |
| Period Type: |
duration |
|
| X |
- DefinitionThe cash inflow from the sale of investment projects held by an entity in hopes of getting a future return or interest from it. Reference 1: http://fasb.org/us-gaap/role/ref/legacyRef
-Name Accounting Standards Codification
-Topic 230
-SubTopic 10
-Section 45
-Paragraph 12
-Publisher FASB
-URI https://asc.fasb.org//1943274/2147482740/230-10-45-12
| Name: |
us-gaap_ProceedsFromSaleOfInvestmentProjects |
| Namespace Prefix: |
us-gaap_ |
| Data Type: |
xbrli:monetaryItemType |
| Balance Type: |
debit |
| Period Type: |
duration |
|
| X |
- DefinitionThe cash outflow for the settlement of obligation drawn from a contractual arrangement with the lender, including letter of credit, standby letter of credit and revolving credit arrangements, under which borrowings can be made up to a specific amount at any point in time with maturities due beyond one year or the operating cycle, if longer. Reference 1: http://fasb.org/us-gaap/role/ref/legacyRef
-Name Accounting Standards Codification
-Topic 230
-SubTopic 10
-Section 45
-Paragraph 15
-Subparagraph (b)
-Publisher FASB
-URI https://asc.fasb.org//1943274/2147482740/230-10-45-15
| Name: |
us-gaap_RepaymentsOfLongTermLinesOfCredit |
| Namespace Prefix: |
us-gaap_ |
| Data Type: |
xbrli:monetaryItemType |
| Balance Type: |
credit |
| Period Type: |
duration |
|
| X |
- DefinitionAmount of cash outflow for short-term lease payment excluded from lease liability. Reference 1: http://www.xbrl.org/2003/role/disclosureRef
-Topic 842
-SubTopic 20
-Name Accounting Standards Codification
-Section 45
-Paragraph 5
-Subparagraph (d)
-Publisher FASB
-URI https://asc.fasb.org//1943274/2147479041/842-20-45-5
| Name: |
us-gaap_ShortTermLeasePayments |
| Namespace Prefix: |
us-gaap_ |
| Data Type: |
xbrli:monetaryItemType |
| Balance Type: |
credit |
| Period Type: |
duration |
|
| X |
- DefinitionAmount of unrealized gain (loss) on investment. Reference 1: http://fasb.org/us-gaap/role/ref/legacyRef
-Name Accounting Standards Codification
-Section 45
-Paragraph 28
-Subparagraph (b)
-SubTopic 10
-Topic 230
-Publisher FASB
-URI https://asc.fasb.org//1943274/2147482740/230-10-45-28
| Name: |
us-gaap_UnrealizedGainLossOnInvestments |
| Namespace Prefix: |
us-gaap_ |
| Data Type: |
xbrli:monetaryItemType |
| Balance Type: |
credit |
| Period Type: |
duration |
|
v3.23.2
Consolidated Statements Of Shareholders' Equity - USD ($)
$ in Thousands |
Total |
Common Stock |
Retained Earnings |
Trust for Savings Restoration Plan |
Accumulated Other Comprehensive Income (Loss) |
| Beginning Balance at Dec. 31, 2021 |
$ 184,722
|
$ 55,174
|
$ 281,187
|
$ (2,135)
|
$ (149,504)
|
| Net income (loss) |
31,292
|
|
|
|
|
| Foreign currency translation adjustment |
306
|
|
|
|
306
|
| Derivative financial instruments adjustment |
(3,231)
|
|
|
|
(3,231)
|
| Amortization of prior service costs and net gains or losses |
5,094
|
|
|
|
5,094
|
| Cash dividends declared ($0.26 per share) |
(8,135)
|
|
(8,135)
|
|
|
| Stock-based compensation expense |
2,133
|
2,133
|
|
|
|
| Repurchase of employee common stock for tax withholdings |
(396)
|
(396)
|
|
|
|
| Tredegar common stock purchased by trust for savings restoration plan |
|
|
26
|
(26)
|
|
| Ending Balance at Jun. 30, 2022 |
$ 211,785
|
56,911
|
304,370
|
(2,161)
|
(147,335)
|
| Cash dividends declared, per share |
$ 0.24
|
|
|
|
|
| Beginning Balance at Mar. 31, 2022 |
$ 211,868
|
55,953
|
293,563
|
(2,148)
|
(135,500)
|
| Net income (loss) |
14,869
|
|
|
|
|
| Foreign currency translation adjustment |
(5,230)
|
|
|
|
(5,230)
|
| Derivative financial instruments adjustment |
(9,161)
|
|
|
|
(9,161)
|
| Amortization of prior service costs and net gains or losses |
2,556
|
|
|
|
2,556
|
| Cash dividends declared ($0.26 per share) |
(4,075)
|
|
(4,075)
|
|
|
| Stock-based compensation expense |
958
|
958
|
|
|
|
| Tredegar common stock purchased by trust for savings restoration plan |
|
|
13
|
(13)
|
|
| Ending Balance at Jun. 30, 2022 |
$ 211,785
|
56,911
|
304,370
|
(2,161)
|
(147,335)
|
| Cash dividends declared, per share |
$ 0.12
|
|
|
|
|
| Beginning Balance at Dec. 31, 2022 |
$ 201,762
|
58,824
|
292,721
|
(2,188)
|
(147,595)
|
| Net income (loss) |
(19,934)
|
|
(19,934)
|
|
|
| Foreign currency translation adjustment |
2,741
|
|
|
|
2,741
|
| Derivative financial instruments adjustment |
1,637
|
|
|
|
1,637
|
| Amortization of prior service costs and net gains or losses |
4,573
|
|
|
|
4,573
|
| Cash dividends declared ($0.26 per share) |
(8,884)
|
|
(8,884)
|
|
|
| Stock-based compensation expense |
1,508
|
1,508
|
|
|
|
| Repurchase of employee common stock for tax withholdings |
(254)
|
(254)
|
|
|
|
| Tredegar common stock purchased by trust for savings restoration plan |
|
|
30
|
(30)
|
|
| Ending Balance at Jun. 30, 2023 |
$ 183,149
|
60,078
|
263,933
|
(2,218)
|
(138,644)
|
| Cash dividends declared, per share |
$ 0.26
|
|
|
|
|
| Beginning Balance at Mar. 31, 2023 |
$ 201,609
|
59,423
|
287,308
|
(2,203)
|
(142,919)
|
| Net income (loss) |
(18,922)
|
|
(18,922)
|
|
|
| Foreign currency translation adjustment |
1,621
|
|
|
|
1,621
|
| Derivative financial instruments adjustment |
368
|
|
|
|
368
|
| Amortization of prior service costs and net gains or losses |
2,286
|
|
|
|
2,286
|
| Cash dividends declared ($0.26 per share) |
(4,468)
|
|
(4,468)
|
|
|
| Stock-based compensation expense |
655
|
655
|
|
|
|
| Tredegar common stock purchased by trust for savings restoration plan |
|
|
15
|
(15)
|
|
| Ending Balance at Jun. 30, 2023 |
$ 183,149
|
$ 60,078
|
$ 263,933
|
$ (2,218)
|
$ (138,644)
|
| Cash dividends declared, per share |
$ 0.13
|
|
|
|
|
| X |
- DefinitionRepresents the expense recognized during the period arising from equity-based compensation arrangements (for example, stock options, restricted stock or other equity instruments) with employees, directors and certain consultants qualifying for treatment as employees.
| Name: |
tg_ShareBasedCompensationExpenseValue |
| Namespace Prefix: |
tg_ |
| Data Type: |
xbrli:monetaryItemType |
| Balance Type: |
credit |
| Period Type: |
duration |
|
| X |
- DefinitionValue of stock issued during the period as a result of the exercise of stock options and other miscellaneous stock transactions, including but not limited to shares forfeited to pay payroll taxes and excess tax benefits from issuance of stock from share-based compensation plans.
| Name: |
tg_StockIssuedDuringPeriodForStockOptionsExercisedAndOtherMiscellaneousStockTransactions |
| Namespace Prefix: |
tg_ |
| Data Type: |
xbrli:monetaryItemType |
| Balance Type: |
credit |
| Period Type: |
duration |
|
| X |
- DefinitionTredegar Common Stock Purchased By Trust For Savings Restoration Plan
| Name: |
tg_TredegarCommonStockPurchasedByTrustForSavingsRestorationPlan |
| Namespace Prefix: |
tg_ |
| Data Type: |
xbrli:monetaryItemType |
| Balance Type: |
debit |
| Period Type: |
duration |
|
| X |
- DefinitionAggregate dividends declared during the period for each share of common stock outstanding. Reference 1: http://fasb.org/us-gaap/role/ref/legacyRef
-Topic 505
-SubTopic 10
-Name Accounting Standards Codification
-Section S99
-Paragraph 1
-Subparagraph (SX 210.3-04)
-Publisher FASB
-URI https://asc.fasb.org//1943274/2147480008/505-10-S99-1
| Name: |
us-gaap_CommonStockDividendsPerShareDeclared |
| Namespace Prefix: |
us-gaap_ |
| Data Type: |
dtr-types:perShareItemType |
| Balance Type: |
na |
| Period Type: |
duration |
|
| X |
- DefinitionAmount of paid and unpaid common stock dividends declared with the form of settlement in cash. Reference 1: http://fasb.org/us-gaap/role/ref/legacyRef
-Topic 505
-SubTopic 10
-Name Accounting Standards Codification
-Section S99
-Paragraph 1
-Subparagraph (SX 210.3-04)
-Publisher FASB
-URI https://asc.fasb.org//1943274/2147480008/505-10-S99-1
| Name: |
us-gaap_DividendsCommonStockCash |
| Namespace Prefix: |
us-gaap_ |
| Data Type: |
xbrli:monetaryItemType |
| Balance Type: |
debit |
| Period Type: |
duration |
|
| X |
- DefinitionThe portion of profit or loss for the period, net of income taxes, which is attributable to the parent. Reference 1: http://www.xbrl.org/2003/role/disclosureRef
-Topic 235
-SubTopic 10
-Name Accounting Standards Codification
-Section S99
-Paragraph 1
-Subparagraph (SX 210.4-08(g)(1)(ii))
-Publisher FASB
-URI https://asc.fasb.org//1943274/2147480678/235-10-S99-1
Reference 2: http://www.xbrl.org/2003/role/disclosureRef
-Topic 323
-SubTopic 10
-Name Accounting Standards Codification
-Section 50
-Paragraph 3
-Subparagraph (c)
-Publisher FASB
-URI https://asc.fasb.org//1943274/2147481687/323-10-50-3
Reference 3: http://www.xbrl.org/2003/role/disclosureRef
-Topic 825
-SubTopic 10
-Name Accounting Standards Codification
-Section 50
-Paragraph 28
-Subparagraph (f)
-Publisher FASB
-URI https://asc.fasb.org//1943274/2147482907/825-10-50-28
Reference 4: http://www.xbrl.org/2003/role/disclosureRef
-Topic 220
-SubTopic 10
-Name Accounting Standards Codification
-Section 50
-Paragraph 6
-Publisher FASB
-URI https://asc.fasb.org//1943274/2147482765/220-10-50-6
Reference 5: http://www.xbrl.org/2003/role/disclosureRef
-Topic 250
-SubTopic 10
-Name Accounting Standards Codification
-Section 50
-Paragraph 3
-Publisher FASB
-URI https://asc.fasb.org//1943274/2147483443/250-10-50-3
Reference 6: http://www.xbrl.org/2003/role/disclosureRef
-Topic 250
-SubTopic 10
-Name Accounting Standards Codification
-Section 50
-Paragraph 1
-Subparagraph (b)(2)
-Publisher FASB
-URI https://asc.fasb.org//1943274/2147483443/250-10-50-1
Reference 7: http://www.xbrl.org/2003/role/disclosureRef
-Topic 815
-SubTopic 40
-Name Accounting Standards Codification
-Section 65
-Paragraph 1
-Subparagraph (f)
-Publisher FASB
-URI https://asc.fasb.org//1943274/2147480175/815-40-65-1
Reference 8: http://www.xbrl.org/2003/role/disclosureRef
-Topic 250
-SubTopic 10
-Name Accounting Standards Codification
-Section 50
-Paragraph 8
-Publisher FASB
-URI https://asc.fasb.org//1943274/2147483443/250-10-50-8
Reference 9: http://www.xbrl.org/2003/role/disclosureRef
-Topic 250
-SubTopic 10
-Name Accounting Standards Codification
-Section 50
-Paragraph 9
-Publisher FASB
-URI https://asc.fasb.org//1943274/2147483443/250-10-50-9
Reference 10: http://www.xbrl.org/2003/role/disclosureRef
-Topic 250
-SubTopic 10
-Name Accounting Standards Codification
-Section 50
-Paragraph 11
-Subparagraph (a)
-Publisher FASB
-URI https://asc.fasb.org//1943274/2147483443/250-10-50-11
Reference 11: http://www.xbrl.org/2003/role/disclosureRef
-Topic 250
-SubTopic 10
-Name Accounting Standards Codification
-Section 50
-Paragraph 11
-Subparagraph (b)
-Publisher FASB
-URI https://asc.fasb.org//1943274/2147483443/250-10-50-11
Reference 12: http://www.xbrl.org/2003/role/disclosureRef
-Topic 250
-SubTopic 10
-Name Accounting Standards Codification
-Section 50
-Paragraph 4
-Publisher FASB
-URI https://asc.fasb.org//1943274/2147483443/250-10-50-4
Reference 13: http://www.xbrl.org/2003/role/exampleRef
-Topic 946
-SubTopic 830
-Name Accounting Standards Codification
-Section 55
-Paragraph 10
-Publisher FASB
-URI https://asc.fasb.org//1943274/2147480167/946-830-55-10
Reference 14: http://www.xbrl.org/2003/role/disclosureRef
-Topic 946
-SubTopic 220
-Name Accounting Standards Codification
-Section 45
-Paragraph 7
-Publisher FASB
-URI https://asc.fasb.org//1943274/2147483581/946-220-45-7
Reference 15: http://www.xbrl.org/2003/role/disclosureRef
-Topic 944
-SubTopic 220
-Name Accounting Standards Codification
-Section S99
-Paragraph 1
-Subparagraph (SX 210.7-04(18))
-Publisher FASB
-URI https://asc.fasb.org//1943274/2147483586/944-220-S99-1
Reference 16: http://www.xbrl.org/2003/role/disclosureRef
-Topic 280
-SubTopic 10
-Name Accounting Standards Codification
-Section 50
-Paragraph 22
-Publisher FASB
-URI https://asc.fasb.org//1943274/2147482810/280-10-50-22
Reference 17: http://www.xbrl.org/2003/role/disclosureRef
-Topic 946
-SubTopic 220
-Name Accounting Standards Codification
-Section S99
-Paragraph 1
-Subparagraph (SX 210.6-07(9))
-Publisher FASB
-URI https://asc.fasb.org//1943274/2147483575/946-220-S99-1
Reference 18: http://www.xbrl.org/2003/role/disclosureRef
-Topic 946
-SubTopic 220
-Name Accounting Standards Codification
-Section S99
-Paragraph 3
-Subparagraph (SX 210.6-09(1)(d))
-Publisher FASB
-URI https://asc.fasb.org//1943274/2147483575/946-220-S99-3
Reference 19: http://www.xbrl.org/2003/role/disclosureRef
-Topic 470
-SubTopic 10
-Name Accounting Standards Codification
-Section S99
-Paragraph 1A
-Subparagraph (SX 210.13-01(a)(4)(i))
-Publisher FASB
-URI https://asc.fasb.org//1943274/2147480097/470-10-S99-1A
Reference 20: http://www.xbrl.org/2009/role/commonPracticeRef
-Topic 470
-SubTopic 10
-Name Accounting Standards Codification
-Section S99
-Paragraph 1A
-Subparagraph (SX 210.13-01(a)(4)(ii))
-Publisher FASB
-URI https://asc.fasb.org//1943274/2147480097/470-10-S99-1A
Reference 21: http://www.xbrl.org/2003/role/disclosureRef
-Topic 470
-SubTopic 10
-Name Accounting Standards Codification
-Section S99
-Paragraph 1A
-Subparagraph (SX 210.13-01(a)(4)(iii)(A))
-Publisher FASB
-URI https://asc.fasb.org//1943274/2147480097/470-10-S99-1A
Reference 22: http://www.xbrl.org/2003/role/disclosureRef
-Topic 470
-SubTopic 10
-Name Accounting Standards Codification
-Section S99
-Paragraph 1A
-Subparagraph (SX 210.13-01(a)(4)(iv))
-Publisher FASB
-URI https://asc.fasb.org//1943274/2147480097/470-10-S99-1A
Reference 23: http://www.xbrl.org/2003/role/disclosureRef
-Topic 470
-SubTopic 10
-Name Accounting Standards Codification
-Section S99
-Paragraph 1A
-Subparagraph (SX 210.13-01(a)(5))
-Publisher FASB
-URI https://asc.fasb.org//1943274/2147480097/470-10-S99-1A
Reference 24: http://www.xbrl.org/2003/role/disclosureRef
-Topic 470
-SubTopic 10
-Name Accounting Standards Codification
-Section S99
-Paragraph 1B
-Subparagraph (SX 210.13-02(a)(4)(i))
-Publisher FASB
-URI https://asc.fasb.org//1943274/2147480097/470-10-S99-1B
Reference 25: http://www.xbrl.org/2003/role/disclosureRef
-Topic 470
-SubTopic 10
-Name Accounting Standards Codification
-Section S99
-Paragraph 1B
-Subparagraph (SX 210.13-02(a)(4)(iii)(A))
-Publisher FASB
-URI https://asc.fasb.org//1943274/2147480097/470-10-S99-1B
Reference 26: http://www.xbrl.org/2003/role/disclosureRef
-Topic 470
-SubTopic 10
-Name Accounting Standards Codification
-Section S99
-Paragraph 1B
-Subparagraph (SX 210.13-02(a)(4)(iii)(B))
-Publisher FASB
-URI https://asc.fasb.org//1943274/2147480097/470-10-S99-1B
Reference 27: http://www.xbrl.org/2003/role/disclosureRef
-Topic 470
-SubTopic 10
-Name Accounting Standards Codification
-Section S99
-Paragraph 1B
-Subparagraph (SX 210.13-02(a)(4)(iv))
-Publisher FASB
-URI https://asc.fasb.org//1943274/2147480097/470-10-S99-1B
Reference 28: http://www.xbrl.org/2003/role/disclosureRef
-Topic 470
-SubTopic 10
-Name Accounting Standards Codification
-Section S99
-Paragraph 1B
-Subparagraph (SX 210.13-02(a)(5))
-Publisher FASB
-URI https://asc.fasb.org//1943274/2147480097/470-10-S99-1B
Reference 29: http://www.xbrl.org/2003/role/disclosureRef
-Topic 280
-SubTopic 10
-Name Accounting Standards Codification
-Section 50
-Paragraph 30
-Subparagraph (b)
-Publisher FASB
-URI https://asc.fasb.org//1943274/2147482810/280-10-50-30
Reference 30: http://www.xbrl.org/2003/role/disclosureRef
-Topic 280
-SubTopic 10
-Name Accounting Standards Codification
-Section 50
-Paragraph 32
-Subparagraph (f)
-Publisher FASB
-URI https://asc.fasb.org//1943274/2147482810/280-10-50-32
Reference 31: http://www.xbrl.org/2003/role/disclosureRef
-Topic 260
-SubTopic 10
-Name Accounting Standards Codification
-Section 45
-Paragraph 60B
-Subparagraph (a)
-Publisher FASB
-URI https://asc.fasb.org//1943274/2147482689/260-10-45-60B
Reference 32: http://www.xbrl.org/2003/role/exampleRef
-Topic 280
-SubTopic 10
-Name Accounting Standards Codification
-Section 50
-Paragraph 31
-Publisher FASB
-URI https://asc.fasb.org//1943274/2147482810/280-10-50-31
Reference 33: http://www.xbrl.org/2003/role/disclosureRef
-Topic 280
-SubTopic 10
-Name Accounting Standards Codification
-Section 50
-Paragraph 32
-Subparagraph (c)
-Publisher FASB
-URI https://asc.fasb.org//1943274/2147482810/280-10-50-32
Reference 34: http://www.xbrl.org/2003/role/disclosureRef
-Topic 205
-SubTopic 20
-Name Accounting Standards Codification
-Section 50
-Paragraph 7
-Publisher FASB
-URI https://asc.fasb.org//1943274/2147483499/205-20-50-7
Reference 35: http://fasb.org/us-gaap/role/ref/legacyRef
-Topic 230
-SubTopic 10
-Name Accounting Standards Codification
-Section 45
-Paragraph 28
-Publisher FASB
-URI https://asc.fasb.org//1943274/2147482740/230-10-45-28
Reference 36: http://www.xbrl.org/2003/role/disclosureRef
-Topic 220
-SubTopic 10
-Name Accounting Standards Codification
-Section 45
-Paragraph 1A
-Subparagraph (a)
-Publisher FASB
-URI https://asc.fasb.org//1943274/2147482790/220-10-45-1A
Reference 37: http://www.xbrl.org/2003/role/disclosureRef
-Topic 220
-SubTopic 10
-Name Accounting Standards Codification
-Section 45
-Paragraph 1B
-Subparagraph (a)
-Publisher FASB
-URI https://asc.fasb.org//1943274/2147482790/220-10-45-1B
Reference 38: http://fasb.org/us-gaap/role/ref/legacyRef
-Topic 220
-SubTopic 10
-Name Accounting Standards Codification
-Section S99
-Paragraph 2
-Subparagraph (SX 210.5-03(20))
-Publisher FASB
-URI https://asc.fasb.org//1943274/2147483621/220-10-S99-2
Reference 39: http://fasb.org/us-gaap/role/ref/legacyRef
-Topic 942
-SubTopic 220
-Name Accounting Standards Codification
-Section S99
-Paragraph 1
-Subparagraph (SX 210.9-04(22))
-Publisher FASB
-URI https://asc.fasb.org//1943274/2147483589/942-220-S99-1
| Name: |
us-gaap_NetIncomeLoss |
| Namespace Prefix: |
us-gaap_ |
| Data Type: |
xbrli:monetaryItemType |
| Balance Type: |
credit |
| Period Type: |
duration |
|
| X |
- DefinitionAmount, after tax and reclassification, of gain (loss) from derivative instrument designated and qualifying as cash flow hedge included in assessment of hedge effectiveness. Reference 1: http://www.xbrl.org/2003/role/disclosureRef
-Topic 220
-SubTopic 10
-Name Accounting Standards Codification
-Section 45
-Paragraph 11
-Publisher FASB
-URI https://asc.fasb.org//1943274/2147482790/220-10-45-11
Reference 2: http://www.xbrl.org/2003/role/disclosureRef
-Topic 220
-SubTopic 10
-Name Accounting Standards Codification
-Section 45
-Paragraph 10A
-Subparagraph (d)
-Publisher FASB
-URI https://asc.fasb.org//1943274/2147482790/220-10-45-10A
| Name: |
us-gaap_OtherComprehensiveIncomeLossCashFlowHedgeGainLossAfterReclassificationAndTax |
| Namespace Prefix: |
us-gaap_ |
| Data Type: |
xbrli:monetaryItemType |
| Balance Type: |
credit |
| Period Type: |
duration |
|
| X |
- DefinitionAmount after tax and reclassification adjustments of gain (loss) on foreign currency translation adjustments, foreign currency transactions designated and effective as economic hedges of a net investment in a foreign entity and intra-entity foreign currency transactions that are of a long-term-investment nature. Reference 1: http://fasb.org/us-gaap/role/ref/legacyRef
-Name Accounting Standards Codification
-Section 45
-Paragraph 10A
-Subparagraph (a)
-SubTopic 10
-Topic 220
-Publisher FASB
-URI https://asc.fasb.org//1943274/2147482790/220-10-45-10A
| Name: |
us-gaap_OtherComprehensiveIncomeLossForeignCurrencyTransactionAndTranslationAdjustmentNetOfTax |
| Namespace Prefix: |
us-gaap_ |
| Data Type: |
xbrli:monetaryItemType |
| Balance Type: |
credit |
| Period Type: |
duration |
|
| X |
- DefinitionAmount, after tax, of reclassification adjustment from accumulated other comprehensive (income) loss for net periodic benefit cost (credit) of defined benefit plan. Reference 1: http://fasb.org/us-gaap/role/ref/legacyRef
-Name Accounting Standards Codification
-Section 45
-Paragraph 15
-SubTopic 10
-Topic 220
-Publisher FASB
-URI https://asc.fasb.org//1943274/2147482790/220-10-45-15
Reference 2: http://fasb.org/us-gaap/role/ref/legacyRef
-Topic 220
-SubTopic 10
-Name Accounting Standards Codification
-Section 45
-Paragraph 11
-Publisher FASB
-URI https://asc.fasb.org//1943274/2147482790/220-10-45-11
Reference 3: http://fasb.org/us-gaap/role/ref/legacyRef
-Topic 715
-SubTopic 20
-Name Accounting Standards Codification
-Section 50
-Paragraph 1
-Subparagraph (i)
-Publisher FASB
-URI https://asc.fasb.org//1943274/2147480506/715-20-50-1
Reference 4: http://www.xbrl.org/2003/role/disclosureRef
-Topic 220
-SubTopic 10
-Name Accounting Standards Codification
-Section 45
-Paragraph 17A
-Publisher FASB
-URI https://asc.fasb.org//1943274/2147482790/220-10-45-17A
| Name: |
us-gaap_OtherComprehensiveIncomeLossReclassificationAdjustmentFromAOCIPensionAndOtherPostretirementBenefitPlansNetOfTax |
| Namespace Prefix: |
us-gaap_ |
| Data Type: |
xbrli:monetaryItemType |
| Balance Type: |
credit |
| Period Type: |
duration |
|
| X |
- DefinitionValue of stock issued as a result of the exercise of stock options. Reference 1: http://fasb.org/us-gaap/role/ref/legacyRef
-Name Accounting Standards Codification
-Section 50
-Paragraph 2
-SubTopic 10
-Topic 505
-Publisher FASB
-URI https://asc.fasb.org//1943274/2147481112/505-10-50-2
Reference 2: http://fasb.org/us-gaap/role/ref/legacyRef
-Topic 505
-SubTopic 10
-Name Accounting Standards Codification
-Section S99
-Paragraph 1
-Subparagraph (SX 210.3-04)
-Publisher FASB
-URI https://asc.fasb.org//1943274/2147480008/505-10-S99-1
Reference 3: http://fasb.org/us-gaap/role/ref/legacyRef
-Name Accounting Standards Codification
-Topic 210
-SubTopic 10
-Section S99
-Paragraph 1
-Subparagraph (SX 210.5-02.29-31)
-Publisher FASB
-URI https://asc.fasb.org//1943274/2147480566/210-10-S99-1
| Name: |
us-gaap_StockIssuedDuringPeriodValueStockOptionsExercised |
| Namespace Prefix: |
us-gaap_ |
| Data Type: |
xbrli:monetaryItemType |
| Balance Type: |
credit |
| Period Type: |
duration |
|
| X |
- DefinitionAmount of equity (deficit) attributable to parent. Excludes temporary equity and equity attributable to noncontrolling interest. Reference 1: http://www.xbrl.org/2003/role/exampleRef
-Topic 852
-SubTopic 10
-Name Accounting Standards Codification
-Section 55
-Paragraph 10
-Publisher FASB
-URI https://asc.fasb.org//1943274/2147481372/852-10-55-10
Reference 2: http://www.xbrl.org/2003/role/exampleRef
-Topic 946
-SubTopic 830
-Name Accounting Standards Codification
-Section 55
-Paragraph 12
-Publisher FASB
-URI https://asc.fasb.org//1943274/2147480167/946-830-55-12
Reference 3: http://www.xbrl.org/2003/role/disclosureRef
-Topic 946
-SubTopic 210
-Name Accounting Standards Codification
-Section S99
-Paragraph 1
-Subparagraph (SX 210.6-04(19))
-Publisher FASB
-URI https://asc.fasb.org//1943274/2147479617/946-210-S99-1
Reference 4: http://www.xbrl.org/2003/role/disclosureRef
-Topic 946
-SubTopic 210
-Name Accounting Standards Codification
-Section S99
-Paragraph 2
-Subparagraph (SX 210.6-05(4))
-Publisher FASB
-URI https://asc.fasb.org//1943274/2147479617/946-210-S99-2
Reference 5: http://www.xbrl.org/2009/role/commonPracticeRef
-Topic 946
-SubTopic 220
-Name Accounting Standards Codification
-Section S99
-Paragraph 3
-Subparagraph (SX 210.6-09(4)(b))
-Publisher FASB
-URI https://asc.fasb.org//1943274/2147483575/946-220-S99-3
Reference 6: http://www.xbrl.org/2003/role/disclosureRef
-Topic 946
-SubTopic 220
-Name Accounting Standards Codification
-Section S99
-Paragraph 3
-Subparagraph (SX 210.6-09(6))
-Publisher FASB
-URI https://asc.fasb.org//1943274/2147483575/946-220-S99-3
Reference 7: http://www.xbrl.org/2003/role/disclosureRef
-Topic 946
-SubTopic 220
-Name Accounting Standards Codification
-Section S99
-Paragraph 3
-Subparagraph (SX 210.6-09(7))
-Publisher FASB
-URI https://asc.fasb.org//1943274/2147483575/946-220-S99-3
Reference 8: http://www.xbrl.org/2009/role/commonPracticeRef
-Topic 235
-SubTopic 10
-Name Accounting Standards Codification
-Section S99
-Paragraph 1
-Subparagraph (SX 210.4-08(g)(1)(ii))
-Publisher FASB
-URI https://asc.fasb.org//1943274/2147480678/235-10-S99-1
Reference 9: http://www.xbrl.org/2009/role/commonPracticeRef
-Topic 323
-SubTopic 10
-Name Accounting Standards Codification
-Section 50
-Paragraph 3
-Subparagraph (c)
-Publisher FASB
-URI https://asc.fasb.org//1943274/2147481687/323-10-50-3
Reference 10: http://www.xbrl.org/2009/role/commonPracticeRef
-Topic 825
-SubTopic 10
-Name Accounting Standards Codification
-Section 50
-Paragraph 28
-Subparagraph (f)
-Publisher FASB
-URI https://asc.fasb.org//1943274/2147482907/825-10-50-28
Reference 11: http://fasb.org/us-gaap/role/ref/legacyRef
-Topic 210
-SubTopic 10
-Name Accounting Standards Codification
-Section S99
-Paragraph 1
-Subparagraph (SX 210.5-02(29))
-Publisher FASB
-URI https://asc.fasb.org//1943274/2147480566/210-10-S99-1
Reference 12: http://fasb.org/us-gaap/role/ref/legacyRef
-Topic 210
-SubTopic 10
-Name Accounting Standards Codification
-Section S99
-Paragraph 1
-Subparagraph (SX 210.5-02(31))
-Publisher FASB
-URI https://asc.fasb.org//1943274/2147480566/210-10-S99-1
Reference 13: http://fasb.org/us-gaap/role/ref/legacyRef
-Topic 210
-SubTopic 10
-Name Accounting Standards Codification
-Section S99
-Paragraph 1
-Subparagraph (SX 210.5-02(30))
-Publisher FASB
-URI https://asc.fasb.org//1943274/2147480566/210-10-S99-1
Reference 14: http://fasb.org/us-gaap/role/ref/legacyRef
-Topic 310
-SubTopic 10
-Name Accounting Standards Codification
-Section S99
-Paragraph 2
-Subparagraph (SAB Topic 4.E)
-Publisher FASB
-URI https://asc.fasb.org//1943274/2147480418/310-10-S99-2
| Name: |
us-gaap_StockholdersEquity |
| Namespace Prefix: |
us-gaap_ |
| Data Type: |
xbrli:monetaryItemType |
| Balance Type: |
credit |
| Period Type: |
instant |
|
v3.23.2
| X |
- DefinitionAggregate dividends declared during the period for each share of common stock outstanding. Reference 1: http://fasb.org/us-gaap/role/ref/legacyRef
-Topic 505
-SubTopic 10
-Name Accounting Standards Codification
-Section S99
-Paragraph 1
-Subparagraph (SX 210.3-04)
-Publisher FASB
-URI https://asc.fasb.org//1943274/2147480008/505-10-S99-1
| Name: |
us-gaap_CommonStockDividendsPerShareDeclared |
| Namespace Prefix: |
us-gaap_ |
| Data Type: |
dtr-types:perShareItemType |
| Balance Type: |
na |
| Period Type: |
duration |
|
| X |
- References
+ Details
| Name: |
us-gaap_StatementOfStockholdersEquityAbstract |
| Namespace Prefix: |
us-gaap_ |
| Data Type: |
xbrli:stringItemType |
| Balance Type: |
na |
| Period Type: |
duration |
|
v3.23.2
Basis Of Presentation
|
6 Months Ended |
Jun. 30, 2023 |
|---|
| Basis Of Presentation [Abstract] |
|
| Basis Of Presentation |
In the opinion of management, the accompanying condensed consolidated financial statements of Tredegar Corporation and its subsidiaries (“Tredegar,” “the Company,” “we,” “us” or “our”) contain all adjustments necessary to state fairly, in all material respects, Tredegar’s condensed consolidated financial position as of June 30, 2023, the condensed consolidated results of operations for the three and six months ended June 30, 2023 and 2022, the condensed consolidated cash flows for the six months ended June 30, 2023 and 2022, and the condensed consolidated changes in shareholders’ equity for the six months ended June 30, 2023 and 2022, in accordance with U.S. generally accepted accounting principles (“GAAP”). All such adjustments, unless otherwise detailed in the notes to the condensed consolidated financial statements, are deemed to be of a normal, recurring nature. The Company operates on a calendar fiscal year except for the Aluminum Extrusions segment, which operates on a 52/53-week fiscal year basis. As such, the fiscal second quarter for 2023 and 2022 for this segment references 13-week periods ended June 25, 2023 and June 26, 2022, respectively. The Company does not believe the impact of reporting the results of this segment as stated above is material to the consolidated financial results. The Company may fund or receive cash from the Aluminum Extrusions segment based on Aluminum Extrusion’s cash flows from operations during the intervening period from Aluminum Extrusion’s fiscal quarter end and the Company’s fiscal quarter end. There was no intercompany funding with Aluminum Extrusions between June 25, 2023 and June 30, 2023. The condensed consolidated financial statements as of December 31, 2022 that is included herein was derived from the audited consolidated financial statements provided in the Company’s Annual Report on Form 10-K for the year ended December 31, 2022 (“2022 Form 10-K”) but does not include all disclosures required by GAAP. These financial statements should be read in conjunction with the audited consolidated financial statements and related notes included in the 2022 Form 10-K. The results of operations for the three and six months ended June 30, 2023, are not necessarily indicative of the results to be expected for the full year. Impairment of Goodwill The Company assesses goodwill for impairment when events or circumstances indicate that the carrying value may not be recoverable, or, at a minimum, on an annual basis (December 1st of each year). As of June 30, 2023, the Company’s reporting units with goodwill were Surface Protection in PE Films ("Surface Protection") and Futura in Aluminum Extrusions (“Futura”). No events or circumstances were identified during the second quarter of 2023 that indicate that Futura’s fair value is more likely than not less than its carrying amount. However, manufacturers in the supply chain for consumer electronics continue to experience reduced capacity utilization and inventory corrections. In light of the continued uncertainty about the timing of a recovery for this market and the expected adverse future impact to the Surface Protection business, the Company performed a Step 1 goodwill impairment analysis of the Surface Protection component of PE Films using projections that contemplate the expected market recovery and business conditions, as these events indicated Surface Protection’s fair value is more likely than not less than its carrying amount. The Company estimated the fair value of Surface Protection at June 30, 2023 by: (i) computing an estimated enterprise value (“EV”) utilizing the discounted cash flow method (the “DCF Method”), (ii) applying adjustments for any surplus or deficient working capital, (iii) adding cash and cash equivalents, and (iv) subtracting interest-bearing debt. The DCF Method was used since Surface Protection’s projections reflect the expected recovery from the weak market demand, competitive pricing and cash flows associated with new surface protection products, applications, customers, production efficiencies, and cost savings. The analysis concluded that the fair value of Surface Protection was less than its carrying value, thus a non-cash partial goodwill impairment of $15.4 million ($11.9 million after deferred income tax benefits) was recognized during the second quarter of 2023. Given the uncertain demand for Surface Protections products, it is reasonably possible that the cash flow estimates used in deriving such fair value measurements may change in the future. The Surface Protection reporting unit had goodwill of $41.9 million and $57.3 million as of June 30, 2023 and December 31, 2022, respectively. Accounting Standards Adopted No Accounting Standard Updates issued by the Financial Accounting Standards Board were adopted during the second quarter of 2023.
|
| X |
- DefinitionBasis Of Presentation [Abstract]
| Name: |
tg_BasisOfPresentationAbstract |
| Namespace Prefix: |
tg_ |
| Data Type: |
xbrli:stringItemType |
| Balance Type: |
na |
| Period Type: |
duration |
|
| X |
- DefinitionThe entire disclosure for the basis of accounting, or basis of presentation, used to prepare the financial statements (for example, US Generally Accepted Accounting Principles, Other Comprehensive Basis of Accounting, IFRS). Reference 1: http://fasb.org/us-gaap/role/ref/legacyRef
-Topic 235
-Name Accounting Standards Codification
-Publisher FASB
-URI https://asc.fasb.org//235/tableOfContent
| Name: |
us-gaap_BasisOfAccounting |
| Namespace Prefix: |
us-gaap_ |
| Data Type: |
dtr-types:textBlockItemType |
| Balance Type: |
na |
| Period Type: |
duration |
|
v3.23.2
Accounts and Other Receivables
|
6 Months Ended |
Jun. 30, 2023 |
|---|
| Receivables [Abstract] |
|
| Accounts and Other Receivables |
As of June 30, 2023 and December 31, 2022, accounts receivable and other receivables, net include the following: | | | | | | | | | | | | | (In thousands) | June 30, 2023 | | December 31, 2022 | | Customer receivables | $ | 79,112 | | | $ | 83,667 | | | Other receivables | 2,233 | | | 3,874 | | | Total accounts and other receivables | 81,345 | | | 87,541 | | | Less: Allowance for bad debts | (2,206) | | | (2,997) | | | Total accounts and other receivables, net | $ | 79,139 | | | $ | 84,544 | |
|
| X |
- DefinitionThe entire disclosure for financing receivable. Reference 1: http://www.xbrl.org/2003/role/disclosureRef
-Topic 310
-SubTopic 10
-Name Accounting Standards Codification
-Section 50
-Paragraph 42
-Subparagraph (a)(2)
-Publisher FASB
-URI https://asc.fasb.org//1943274/2147481962/310-10-50-42
Reference 2: http://www.xbrl.org/2003/role/exampleRef
-Topic 310
-SubTopic 10
-Name Accounting Standards Codification
-Section 55
-Paragraph 12A
-Publisher FASB
-URI https://asc.fasb.org//1943274/2147481933/310-10-55-12A
Reference 3: http://www.xbrl.org/2003/role/disclosureRef
-Topic 310
-SubTopic 10
-Name Accounting Standards Codification
-Section 50
-Paragraph 44
-Subparagraph (a)(1)
-Publisher FASB
-URI https://asc.fasb.org//1943274/2147481962/310-10-50-44
Reference 4: http://www.xbrl.org/2003/role/disclosureRef
-Topic 310
-SubTopic 10
-Name Accounting Standards Codification
-Publisher FASB
-URI https://asc.fasb.org//310-10/tableOfContent
Reference 5: http://www.xbrl.org/2003/role/disclosureRef
-Topic 310
-SubTopic 20
-Name Accounting Standards Codification
-Publisher FASB
-URI https://asc.fasb.org//310-20/tableOfContent
| Name: |
us-gaap_FinancingReceivablesTextBlock |
| Namespace Prefix: |
us-gaap_ |
| Data Type: |
dtr-types:textBlockItemType |
| Balance Type: |
na |
| Period Type: |
duration |
|
| X |
- References
+ Details
| Name: |
us-gaap_ReceivablesAbstract |
| Namespace Prefix: |
us-gaap_ |
| Data Type: |
xbrli:stringItemType |
| Balance Type: |
na |
| Period Type: |
duration |
|
v3.23.2
Inventories
|
6 Months Ended |
Jun. 30, 2023 |
|---|
| Inventory, Net [Abstract] |
|
| Inventories |
The components of inventories are as follows: | | | | | | | | | | | | | (In thousands) | June 30, 2023 | | December 31, 2022 | | Finished goods | $ | 29,677 | | | $ | 34,686 | | | Work-in-process | 12,678 | | | 15,604 | | | Raw materials | 23,897 | | | 58,262 | | | Stores, supplies and other | 20,440 | | | 19,219 | | | Total | $ | 86,692 | | | $ | 127,771 | |
|
| X |
- DefinitionThe entire disclosure for inventory. Includes, but is not limited to, the basis of stating inventory, the method of determining inventory cost, the classes of inventory, and the nature of the cost elements included in inventory. Reference 1: http://www.xbrl.org/2003/role/disclosureRef
-Topic 330
-Name Accounting Standards Codification
-Publisher FASB
-URI https://asc.fasb.org//330/tableOfContent
| Name: |
us-gaap_InventoryDisclosureTextBlock |
| Namespace Prefix: |
us-gaap_ |
| Data Type: |
dtr-types:textBlockItemType |
| Balance Type: |
na |
| Period Type: |
duration |
|
| X |
- References
+ Details
| Name: |
us-gaap_InventoryNetAbstract |
| Namespace Prefix: |
us-gaap_ |
| Data Type: |
xbrli:stringItemType |
| Balance Type: |
na |
| Period Type: |
duration |
|
v3.23.2
Pension And Other Post-Retirement Benefits
|
6 Months Ended |
Jun. 30, 2023 |
|---|
| Retirement Benefits [Abstract] |
|
| Pension And Other Post-Retirement Benefits |
Tredegar sponsors a noncontributory defined benefit (pension) plan covering certain current and former U.S. employees. As of January 31, 2018, the plan no longer accrued benefits associated with crediting employees for service, thereby freezing all future benefits under the plan. On February 10, 2022, Tredegar announced the initiation of a process to terminate and settle its frozen defined benefit pension plan. In connection therewith, on February 9, 2022, the Company contributed $50 million to the pension plan (the “Special Contribution”). The Company estimates that, with the Special Contribution, there will be no required minimum contributions to the pension plan until final settlement. Tredegar also has a non-qualified supplemental pension plan covering certain employees. Effective December 31, 2005, further participation in this plan was terminated and benefit accruals for existing participants were frozen. Pension expense recognized for this plan was immaterial in the three and six months ended June 30, 2023 and 2022. This information has been included in the pension benefit table below. The components of net periodic benefit cost for the pension and other postretirement benefit programs reflected in the condensed consolidated statements of income for the three and six months ended June 30, 2023 and 2022, are shown below: | | | | | | | | | | | | | | | | | | | | | | | | | Pension Benefits | | Other Post-Retirement Benefits | | | Three Months Ended June 30, | | Three Months Ended June 30, | | (In thousands) | 2023 | | 2022 | | 2023 | | 2022 | | Service cost | $ | — | | | $ | — | | | $ | 3 | | | $ | 5 | | | Interest cost | 3,028 | | | 2,225 | | | 71 | | | 51 | | | Expected return on plan assets | (2,607) | | | (2,043) | | | — | | | — | | | Amortization of prior service costs, (gains) losses and net transition asset | 2,982 | | | 3,302 | | | (59) | | | (34) | | | Net periodic benefit cost | $ | 3,403 | | | $ | 3,484 | | | $ | 15 | | | $ | 22 | | | | | | | | | | | Pension Benefits | | Other Post-Retirement Benefits | | | Six Months Ended June 30, | | Six Months Ended June 30, | | (In thousands) | 2023 | | 2022 | | 2023 | | 2022 | | Service cost | $ | — | | | $ | — | | | $ | 6 | | | $ | 10 | | | Interest cost | 6,056 | | | 4,450 | | | 142 | | | 102 | | | Expected return on plan assets | (5,214) | | | (4,098) | | | — | | | — | | | Amortization of prior service costs, (gains) losses and net transition asset | 5,965 | | | 6,586 | | | (118) | | | (68) | | | Net periodic benefit cost | $ | 6,807 | | | $ | 6,938 | | | $ | 30 | | | $ | 44 | |
Pension and other postretirement liabilities were $36.4 million and $35.7 million at June 30, 2023 and December 31, 2022, respectively ($0.7 million included in “Accrued expenses” at June 30, 2023 and December 31, 2022, respectively, with the remainder included in “Pension and other postretirement benefit obligations, net” in the condensed consolidated balance sheets). Tredegar funds its other postretirement benefits on a claims-made basis; for 2023, the Company anticipates the amount will be consistent with amounts paid for the year ended December 31, 2022, or approximately $0.5 million.
|
| X |
- References
+ Details
| Name: |
us-gaap_CompensationAndRetirementDisclosureAbstract |
| Namespace Prefix: |
us-gaap_ |
| Data Type: |
xbrli:stringItemType |
| Balance Type: |
na |
| Period Type: |
duration |
|
| X |
- DefinitionThe entire disclosure for retirement benefits. Reference 1: http://www.xbrl.org/2003/role/disclosureRef
-Topic 715
-SubTopic 70
-Name Accounting Standards Codification
-Section 50
-Paragraph 1
-Publisher FASB
-URI https://asc.fasb.org//1943274/2147480794/715-70-50-1
Reference 2: http://www.xbrl.org/2003/role/exampleRef
-Topic 715
-SubTopic 20
-Name Accounting Standards Codification
-Section 55
-Paragraph 17
-Publisher FASB
-URI https://asc.fasb.org//1943274/2147480482/715-20-55-17
Reference 3: http://www.xbrl.org/2003/role/disclosureRef
-Topic 715
-SubTopic 20
-Name Accounting Standards Codification
-Section 50
-Paragraph 1
-Subparagraph (d)(iv)(03)
-Publisher FASB
-URI https://asc.fasb.org//1943274/2147480506/715-20-50-1
Reference 4: http://www.xbrl.org/2003/role/disclosureRef
-Topic 715
-SubTopic 20
-Name Accounting Standards Codification
-Section 50
-Paragraph 1
-Subparagraph (d)(i)
-Publisher FASB
-URI https://asc.fasb.org//1943274/2147480506/715-20-50-1
Reference 5: http://www.xbrl.org/2003/role/disclosureRef
-Topic 715
-SubTopic 20
-Name Accounting Standards Codification
-Section 50
-Paragraph 1
-Subparagraph (q)
-Publisher FASB
-URI https://asc.fasb.org//1943274/2147480506/715-20-50-1
Reference 6: http://www.xbrl.org/2003/role/disclosureRef
-Topic 715
-SubTopic 20
-Name Accounting Standards Codification
-Section 50
-Paragraph 1
-Subparagraph (l)
-Publisher FASB
-URI https://asc.fasb.org//1943274/2147480506/715-20-50-1
Reference 7: http://www.xbrl.org/2003/role/disclosureRef
-Topic 715
-Name Accounting Standards Codification
-Publisher FASB
-URI https://asc.fasb.org//715/tableOfContent
Reference 8: http://www.xbrl.org/2003/role/disclosureRef
-Topic 715
-SubTopic 20
-Name Accounting Standards Codification
-Section 50
-Paragraph 1
-Subparagraph (d)(iii)
-Publisher FASB
-URI https://asc.fasb.org//1943274/2147480506/715-20-50-1
Reference 9: http://www.xbrl.org/2003/role/disclosureRef
-Topic 715
-SubTopic 20
-Name Accounting Standards Codification
-Section 50
-Paragraph 1
-Subparagraph (o)
-Publisher FASB
-URI https://asc.fasb.org//1943274/2147480506/715-20-50-1
Reference 10: http://www.xbrl.org/2003/role/disclosureRef
-Topic 715
-SubTopic 20
-Name Accounting Standards Codification
-Section 50
-Paragraph 1
-Subparagraph (p)
-Publisher FASB
-URI https://asc.fasb.org//1943274/2147480506/715-20-50-1
Reference 11: http://www.xbrl.org/2003/role/disclosureRef
-Topic 715
-SubTopic 20
-Name Accounting Standards Codification
-Section 50
-Paragraph 1
-Subparagraph (r)(1)
-Publisher FASB
-URI https://asc.fasb.org//1943274/2147480506/715-20-50-1
Reference 12: http://www.xbrl.org/2003/role/disclosureRef
-Topic 715
-SubTopic 20
-Name Accounting Standards Codification
-Section 50
-Paragraph 1
-Subparagraph (r)(2)
-Publisher FASB
-URI https://asc.fasb.org//1943274/2147480506/715-20-50-1
Reference 13: http://www.xbrl.org/2003/role/disclosureRef
-Topic 715
-SubTopic 20
-Name Accounting Standards Codification
-Section S99
-Paragraph 2
-Publisher FASB
-URI https://asc.fasb.org//1943274/2147480126/715-20-S99-2
Reference 14: http://www.xbrl.org/2003/role/disclosureRef
-Topic 715
-SubTopic 60
-Name Accounting Standards Codification
-Section 50
-Paragraph 3
-Subparagraph (c)
-Publisher FASB
-URI https://asc.fasb.org//1943274/2147480266/715-60-50-3
| Name: |
us-gaap_PensionAndOtherPostretirementBenefitsDisclosureTextBlock |
| Namespace Prefix: |
us-gaap_ |
| Data Type: |
dtr-types:textBlockItemType |
| Balance Type: |
na |
| Period Type: |
duration |
|
v3.23.2
Other Income (Expense), Net (Notes)
|
6 Months Ended |
Jun. 30, 2023 |
|---|
| Other Income and Expenses [Abstract] |
|
| Other Income and Other Expense Disclosure [Text Block] |
Other income (expense), net consists of the following: | | | | | | | | | | | | | | | | | | | | | | | | | Three Months Ended June 30, | | Six Months Ended June 30, | | (In thousands) | 2023 | | 2022 | | 2023 | | 2022 | Gain on investment in kaléo(a) | $ | — | | | $ | 1,406 | | | $ | 262 | | | $ | 1,406 | | COVID-19-related expenses, net of relief (b) | — | | | (96) | | | — | | | (308) | | | | | | | | | | | | | | | | | | | | | | | | | | | | | | | | | | | Other | (20) | | | 32 | | | (2) | | | (57) | | | Total | $ | (20) | | | $ | 1,342 | | | $ | 260 | | | $ | 1,041 | | (a) In January 2023, additional cash consideration of $0.3 million was received related to the customary post-closing adjustments on the sale of the investment in kaleo, Inc ("kaléo"), which was sold in December 2021. (b) Costs associated with operating under COVID-19 conditions include employee overtime expenses associated with absenteeism, personal protective equipment supplies and facility maintenance. |
|
| X |
- References
+ Details
| Name: |
us-gaap_OtherIncomeAndExpensesAbstract |
| Namespace Prefix: |
us-gaap_ |
| Data Type: |
xbrli:stringItemType |
| Balance Type: |
na |
| Period Type: |
duration |
|
| X |
- DefinitionThe entire disclosure for other income or other expense items (both operating and nonoperating). Sources of nonoperating income or nonoperating expense that may be disclosed, include amounts earned from dividends, interest on securities, profits (losses) on securities, net and miscellaneous other income or income deductions. Reference 1: http://fasb.org/us-gaap/role/ref/legacyRef
-Topic 610
-Name Accounting Standards Codification
-Publisher FASB
-URI https://asc.fasb.org//610/tableOfContent
Reference 2: http://fasb.org/us-gaap/role/ref/legacyRef
-Topic 720
-Name Accounting Standards Codification
-Publisher FASB
-URI https://asc.fasb.org//720/tableOfContent
| Name: |
us-gaap_OtherIncomeAndOtherExpenseDisclosureTextBlock |
| Namespace Prefix: |
us-gaap_ |
| Data Type: |
dtr-types:textBlockItemType |
| Balance Type: |
na |
| Period Type: |
duration |
|
v3.23.2
Earnings Per Share
|
6 Months Ended |
Jun. 30, 2023 |
|---|
| Earnings Per Share [Abstract] |
|
| Earnings Per Share |
Basic earnings per share is computed by dividing net income (loss) by the weighted average number of shares of common stock outstanding. Diluted earnings per share is computed by dividing net income (loss) by the weighted average common and potentially dilutive common equivalent shares outstanding, determined as follows: | | | | | | | | | | | | | | | | | | | | | | | | | Three Months Ended | | Six Months Ended | | | June 30, | | June 30, | | (In thousands) | 2023 | | 2022 | | 2023 | | 2022 | | Weighted average shares outstanding used to compute basic earnings per share | 34,079 | | | 33,814 | | | 33,988 | | | 33,734 | | | Incremental dilutive shares attributable to stock options and restricted stock | — | | | 40 | | | — | | | 42 | | | Shares used to compute diluted earnings per share | 34,079 | | | 33,854 | | | 33,988 | | | 33,776 | |
Incremental shares attributable to stock options and restricted stock are computed under the treasury stock method using the average market price during the related period. The Company had a net loss for the three and six months ended June 30, 2023, so there is no dilutive impact for such shares. If the Company had reported net income for the three and six months ended June 30, 2023, average out-of-the-money options to purchase shares that were excluded from the calculation of incremental shares attributable to stock options and restricted stock would have been 3,019,333 and 2,830,849, respectively. The average out-of-the-money options to purchase shares that were excluded from the calculation of incremental shares attributable to stock options and restricted stock were 2,525,104 and 2,501,406 for the three and six months ended June 30, 2022, respectively.
|
| X |
- References
+ Details
| Name: |
us-gaap_EarningsPerShareAbstract |
| Namespace Prefix: |
us-gaap_ |
| Data Type: |
xbrli:stringItemType |
| Balance Type: |
na |
| Period Type: |
duration |
|
| X |
- DefinitionThe entire disclosure for earnings per share. Reference 1: http://www.xbrl.org/2003/role/disclosureRef
-Topic 260
-SubTopic 10
-Name Accounting Standards Codification
-Section 50
-Paragraph 1
-Subparagraph (c)
-Publisher FASB
-URI https://asc.fasb.org//1943274/2147482662/260-10-50-1
Reference 2: http://www.xbrl.org/2003/role/disclosureRef
-Topic 260
-Name Accounting Standards Codification
-Publisher FASB
-URI https://asc.fasb.org//260/tableOfContent
Reference 3: http://www.xbrl.org/2003/role/disclosureRef
-Topic 260
-SubTopic 10
-Name Accounting Standards Codification
-Section 50
-Paragraph 2
-Publisher FASB
-URI https://asc.fasb.org//1943274/2147482662/260-10-50-2
Reference 4: http://www.xbrl.org/2003/role/disclosureRef
-Topic 260
-SubTopic 10
-Name Accounting Standards Codification
-Section 50
-Paragraph 3
-Publisher FASB
-URI https://asc.fasb.org//1943274/2147482662/260-10-50-3
| Name: |
us-gaap_EarningsPerShareTextBlock |
| Namespace Prefix: |
us-gaap_ |
| Data Type: |
dtr-types:textBlockItemType |
| Balance Type: |
na |
| Period Type: |
duration |
|
v3.23.2
Accumulated Other Comprehensive Income (Loss)
|
6 Months Ended |
Jun. 30, 2022 |
|---|
| Other Comprehensive Income (Loss), Net of Tax [Abstract] |
|
| Comprehensive Income (Loss) Note [Text Block] |
The changes in accumulated other comprehensive income (loss) by component for the three months ended June 30, 2023. | | | | | | | | | | | | | | | | | | | | | | | | | (In thousands) | Foreign Currency Translation | | Gain (Loss) on Derivative Financial Instruments | | Pension & Other Postretirement Benefit Adjust | | Total Accumulated Other Comprehensive Income (Loss) | | Balance at April 1, 2023 | $ | (84,959) | | | $ | (1,211) | | | $ | (56,749) | | | $ | (142,919) | | | Other comprehensive income (loss) | 1,800 | | | 2,488 | | | — | | | 4,288 | | | Income tax (expense) benefit | (179) | | | (945) | | | — | | | (1,124) | | | Other comprehensive income (loss), net of tax | 1,621 | | | 1,543 | | | — | | | 3,164 | | | Reclassification adjustment to net income (loss) | — | | | (1,621) | | | 2,923 | | | 1,302 | | | Income tax (expense) benefit | — | | | 446 | | | (637) | | | (191) | | | Reclassification adjustment to net income (loss), net of tax | — | | | (1,175) | | | 2,286 | | | 1,111 | | | Other comprehensive income (loss), net of tax | 1,621 | | | 368 | | | 2,286 | | | 4,275 | | Balance at June 30, 2023 | $ | (83,338) | | | $ | (843) | | | $ | (54,463) | | | $ | (138,644) | |
The changes in accumulated other comprehensive income (loss) by component for the six months ended June 30, 2023. | | | | | | | | | | | | | | | | | | | | | | | | | (In thousands) | Foreign Currency Translation | | Gain (Loss) on Derivative Financial Instruments | | Pension & Other Postretirement Benefit Adjust | | Total Accumulated Other Comprehensive Income (Loss) | | Balance at January 1, 2023 | $ | (86,079) | | | $ | (2,480) | | | $ | (59,036) | | | $ | (147,595) | | | Other comprehensive income (loss) | 3,356 | | | 5,565 | | | — | | | 8,921 | | | Income tax (expense) benefit | (615) | | | (2,031) | | | — | | | (2,646) | | | Other comprehensive income (loss), net of tax | 2,741 | | | 3,534 | | | — | | | 6,275 | | | Reclassification adjustment to net income (loss) | — | | | (2,594) | | | 5,847 | | | 3,253 | | | Income tax (expense) benefit | — | | | 697 | | | (1,274) | | | (577) | | | Reclassification adjustment to net income (loss), net of tax | — | | | (1,897) | | | 4,573 | | | 2,676 | | | Other comprehensive income (loss), net of tax | 2,741 | | | 1,637 | | | 4,573 | | | 8,951 | | Balance at June 30, 2023 | $ | (83,338) | | | $ | (843) | | | $ | (54,463) | | | $ | (138,644) | |
The changes in accumulated other comprehensive income (loss) by component for the three months ended June 30, 2022. | | | | | | | | | | | | | | | | | | | | | | | | | (In thousands) | Foreign Currency Translation | | Gain (Loss) on Derivative Financial Instruments | | Pension & Other Postretirement Benefit Adjust | | Total Accumulated Other Comprehensive Income (Loss) | | Balance at April 1, 2022 | $ | (80,256) | | | $ | 6,831 | | | $ | (62,075) | | | $ | (135,500) | | | Other comprehensive income (loss) | (5,712) | | | (11,681) | | | — | | | (17,393) | | | Income tax (expense) benefit | 482 | | | 3,110 | | | — | | | 3,592 | | | Other comprehensive income (loss), net of tax | (5,230) | | | (8,571) | | | — | | | (13,801) | | | Reclassification adjustment to net income (loss) | — | | | (840) | | | 3,268 | | | 2,428 | | | Income tax (expense) benefit | — | | | 250 | | | (712) | | | (462) | | | Reclassification adjustment to net income (loss), net of tax | — | | | (590) | | | 2,556 | | | 1,966 | | | Other comprehensive income (loss), net of tax | (5,230) | | | (9,161) | | | 2,556 | | | (11,835) | | Balance at June 30, 2022 | $ | (85,486) | | | $ | (2,330) | | | $ | (59,519) | | | $ | (147,335) | |
The changes in accumulated other comprehensive income (loss) by component for the six months ended June 30, 2022. | | | | | | | | | | | | | | | | | | | | | | | | | (In thousands) | Foreign Currency Translation | | Gain (Loss) on Derivative Financial Instruments | | Pension & Other Postretirement Benefit Adjust | | Total Accumulated Other Comprehensive Income (Loss) | | Balance at January 1, 2022 | $ | (85,792) | | | $ | 901 | | | $ | (64,613) | | | $ | (149,504) | | | Other comprehensive income (loss) | 552 | | | (1,678) | | | — | | | (1,126) | | | Income tax (expense) benefit | (246) | | | (80) | | | — | | | (326) | | | Other comprehensive income (loss), net of tax | 306 | | | (1,758) | | | — | | | (1,452) | | | Reclassification adjustment to net income (loss) | — | | | (1,997) | | | 6,518 | | | 4,521 | | | Income tax (expense) benefit | — | | | 524 | | | (1,424) | | | (900) | | | Reclassification adjustment to net income (loss), net of tax | — | | | (1,473) | | | 5,094 | | | 3,621 | | | Other comprehensive income (loss), net of tax | 306 | | | (3,231) | | | 5,094 | | | 2,169 | | Balance at June 30, 2022 | $ | (85,486) | | | $ | (2,330) | | | $ | (59,519) | | | $ | (147,335) | |
|
| X |
- DefinitionThe entire disclosure for comprehensive income, which includes, but is not limited to, 1) the amount of income tax expense or benefit allocated to each component of other comprehensive income, including reclassification adjustments, 2) the reclassification adjustments for each classification of other comprehensive income and 3) the ending accumulated balances for each component of comprehensive income. Reference 1: http://www.xbrl.org/2003/role/disclosureRef
-Topic 944
-SubTopic 220
-Name Accounting Standards Codification
-Section S99
-Paragraph 1
-Subparagraph (SX 210.7-04(19))
-Publisher FASB
-URI https://asc.fasb.org//1943274/2147483586/944-220-S99-1
Reference 2: http://www.xbrl.org/2003/role/disclosureRef
-Topic 220
-SubTopic 10
-Name Accounting Standards Codification
-Section S99
-Paragraph 2
-Subparagraph (SX 210.5-03(21))
-Publisher FASB
-URI https://asc.fasb.org//1943274/2147483621/220-10-S99-2
Reference 3: http://www.xbrl.org/2003/role/disclosureRef
-Topic 942
-SubTopic 220
-Name Accounting Standards Codification
-Section S99
-Paragraph 1
-Subparagraph (SX 210.9-04(23))
-Publisher FASB
-URI https://asc.fasb.org//1943274/2147483589/942-220-S99-1
Reference 4: http://fasb.org/us-gaap/role/ref/legacyRef
-Topic 220
-Name Accounting Standards Codification
-Publisher FASB
-URI https://asc.fasb.org//220/tableOfContent
| Name: |
us-gaap_ComprehensiveIncomeNoteTextBlock |
| Namespace Prefix: |
us-gaap_ |
| Data Type: |
dtr-types:textBlockItemType |
| Balance Type: |
na |
| Period Type: |
duration |
|
| X |
- References
+ Details
| Name: |
us-gaap_OtherComprehensiveIncomeLossNetOfTaxPeriodIncreaseDecreaseAbstract |
| Namespace Prefix: |
us-gaap_ |
| Data Type: |
xbrli:stringItemType |
| Balance Type: |
na |
| Period Type: |
duration |
|
v3.23.2
Derivative Financial Instruments
|
6 Months Ended |
Jun. 30, 2023 |
|---|
| Summary of Derivative Instruments [Abstract] |
|
| Derivative Financial Instruments |
Tredegar uses derivative financial instruments for the purpose of hedging margin exposure from fixed-price forward sales contracts in Aluminum Extrusions and exposure from currency volatility that exists as part of ongoing business operations in Flexible Packaging Films. These derivative financial instruments are designated as and qualify as cash flow hedges and are recognized in the condensed consolidated balance sheet at fair value. If individual derivative instruments with the same counterparty can be settled on a net basis, the Company records the corresponding derivative fair values as a net asset or net liability. In the normal course of business, Aluminum Extrusions enters into fixed-price forward sales contracts with certain customers for the future sale of fixed quantities of aluminum extrusions at scheduled intervals. In order to hedge margin exposure created from the fixing of future sales prices relative to volatile raw material (aluminum) costs, Aluminum Extrusions enters into a combination of forward purchase commitments and futures contracts to acquire or hedge aluminum, based on the scheduled purchases for the firm sales commitments. The fixed-price firm sales commitments and related hedging instruments have durations generally no longer than 12 months. The notional amount of aluminum futures contracts that hedged future purchases of aluminum to meet fixed-price forward sales contract obligations was $17.0 million (11.1 million pounds of aluminum) at June 30, 2023 and $30.7 million (20.3 million pounds of aluminum) at December 31, 2022. The table below summarizes the location and gross amounts of aluminum futures contract fair values (Level 2) in the condensed consolidated balance sheets as of June 30, 2023 and December 31, 2022: | | | | | | | | | | | | | | | | | | | | | | | | | | June 30, 2023 | | December 31, 2022 | | (In thousands) | Balance Sheet
Account | | Fair
Value | | Balance Sheet
Account | | Fair
Value | | Derivatives Designated as Hedging Instruments | | | | | | | | Asset derivatives: Aluminum futures contracts | Prepaid expenses and other | | $ | — | | | Prepaid expenses and other | | $ | 48 | | | | | | | | | | Liability derivatives: Aluminum futures contracts | Accrued expenses | | (3,050) | | | Accrued expenses | | (3,260) | | | Aluminum futures contracts | Other non-current liabilities | | (255) | | | Other non-current liabilities | | (369) | | | Net asset (liability) | | | $ | (3,305) | | | | | $ | (3,581) | |
In the event that a counterparty to an aluminum fixed-price forward sales contract chooses not to take delivery of its aluminum extrusions, the customer is contractually obligated to compensate Aluminum Extrusions for any losses on the related aluminum futures and/or forward contracts through the date of cancellation. The Company's earnings are exposed to foreign currency exchange risk primarily through the translation of the financial statements of subsidiaries that have a functional currency other than the U.S. Dollar. The Company estimates that the net mismatch translation exposure for the Flexible Packaging Film's business unit in Brazil (“Terphane Ltda.”) of its sales and raw materials quoted or priced in U.S. Dollars and its variable conversion, fixed conversion and sales, general and administrative costs (before depreciation and amortization) quoted or priced in Brazilian Real ("R$") will result in an annual net cost of R$177 million for the full year of 2023. Terphane Ltda. had the following outstanding foreign exchange average forward rate contracts to purchase Brazilian Real and sell U.S. Dollars as of June 30, 2023: | | | | | | | | | | | | | | | | USD Notional Amount (000s) | Average Forward Rate Contracted on USD/BRL | R$ Equivalent Amount (000s) | Applicable Month | Estimated % of Terphane Ltda. R$ Operating Cost Exposure Hedged | | | | | | | | | | | | | | | | | $2,154 | 5.6378 | R$12,144 | Jul-23 | 83% | | $2,020 | 5.6831 | R$11,480 | Aug-23 | 78% | | $2,071 | 5.7174 | R$11,841 | Sep-23 | 80% | | $2,013 | 5.7556 | R$11,586 | Oct-23 | 79% | | $2,018 | 5.7836 | R$11,671 | Nov-23 | 79% | | $1,786 | 5.8312 | R$10,414 | Dec-23 | 71% | | $659 | 5.7360 | R$3,780 | Jan-24 | 23% | | $659 | 5.7562 | R$3,793 | Feb-24 | 23% | | $659 | 5.7774 | R$3,807 | Mar-24 | 23% | | $659 | 5.8000 | R$3,822 | Apr-24 | 23% | | $659 | 5.8207 | R$3,836 | May-24 | 24% | | $659 | 5.8419 | R$3,850 | Jun-24 | 24% | | $659 | 5.8636 | R$3,864 | Jul-24 | 24% | | $659 | 5.8872 | R$3,880 | Aug-24 | 24% | | $659 | 5.9118 | R$3,896 | Sep-24 | 24% | | $659 | 5.9350 | R$3,911 | Oct-24 | 24% | | $659 | 5.9581 | R$3,926 | Nov-24 | 24% | | $659 | 5.9813 | R$3,942 | Dec-24 | 24% | | $19,970 | 5.7808 | R$115,443 | | 40% |
These foreign currency exchange contracts have been designated and qualify as cash flow hedges of Terphane Ltda.’s forecasted sales to customers quoted or priced in U.S. Dollars over that period. By changing the currency risk associated with these U.S. Dollar sales, the derivatives have the effect of offsetting operating costs quoted or priced in Brazilian Real and decreasing the net exposure to Brazilian Real in the condensed consolidated statements of income. The table below summarizes the location and gross amounts of foreign currency forward contract fair values (Level 2) in the condensed consolidated balance sheets as of June 30, 2023 and December 31, 2022: | | | | | | | | | | | | | | | | | | | | | | | | | | | June 30, 2023 | | December 31, 2022 | | (In thousands) | Balance Sheet
Account | | Fair
Value | | Balance Sheet
Account | | | Fair
Value | | Derivatives Designated as Hedging Instruments | | | | | | | | | Asset derivatives: Foreign currency forward contracts | Prepaid expenses and other | | $ | 2,974 | | | Prepaid expenses and other | | | $ | 781 | | | Foreign currency forward contracts | Other assets | | 723 | | | Other assets | | | 33 | | Liability derivatives: Foreign currency forward contracts | Accrued expenses | | — | | | Other non-current liabilities | | | (3) | | | Net asset (liability) | | | $ | 3,697 | | | | | | $ | 811 | |
These derivative contracts involve elements of market risk that are not reflected on the condensed consolidated balance sheet, including the risk of dealing with counterparties and their ability to meet the terms of the contracts. The counterparties to any forward purchase commitments are major aluminum brokers and suppliers, and the counterparties to any aluminum futures contracts are major financial institutions. Fixed-price forward sales contracts are only made available to the best and most credit-worthy customers. The counterparties to the Company’s foreign currency cash flow hedge contracts are major financial institutions. The pre-tax effect on net income (loss) and other comprehensive income (loss) of derivative instruments classified as cash flow hedges and described in the previous paragraphs for the three and six month periods ended June 30, 2023 and 2022 is summarized in the table below: | | | | | | | | | | | | | | | | | | | | | | | | | | | | | | | | | | Cash Flow Derivative Hedges | | | Three Months Ended June 30, | | | Aluminum Futures Contracts | | Foreign Currency Forwards | | (In thousands) | 2023 | | 2022 | | 2023 | | 2022 | | Amount of pre-tax gain (loss) recognized in other comprehensive income (loss) | $ | 557 | | | $ | (9,923) | | | $ | — | | $ | 1,931 | | | $ | — | | | $ | (1,758) | | | Location of gain (loss) reclassified from accumulated other comprehensive income (loss) into net income (effective portion) | Cost of goods sold | | Cost of goods sold | | Cost of goods sold | Selling, general & admin | | Cost of goods sold | | Selling, general & admin | | Amount of pre-tax gain (loss) reclassified from accumulated other comprehensive income (loss) to net income (effective portion) | $ | 885 | | | $ | 293 | | | $ | 15 | | $ | 721 | | | $ | 15 | | | $ | 532 | | | | Six Months Ended June 30, | | | Aluminum Futures Contracts | | Foreign Currency Forwards | | | 2023 | | 2022 | | 2023 | | 2022 | | Amount of pre-tax gain (loss) recognized in other comprehensive income (loss) | $ | 1,959 | | | $ | (3,741) | | | $ | — | | $ | 3,606 | | | $ | — | | | $ | 2,063 | | | Location of gain (loss) reclassified from accumulated other comprehensive income (loss) into net income (effective portion) | Cost of goods sold | | Cost of goods sold | | Cost of goods sold | Selling, general & admin | | Cost of goods sold | | Selling, general & admin | | Amount of pre-tax gain (loss) reclassified from accumulated other comprehensive income (loss) to net income (effective portion) | $ | 1,557 | | | $ | 1,298 | | | $ | 30 | | $ | 1,007 | | | $ | 30 | | | $ | 669 | |
As of June 30, 2023, the Company expects $1.8 million of unrealized after-tax losses on aluminum and foreign currency derivative instruments reported in accumulated other comprehensive income (loss) to be reclassified to earnings within the next 12 months. For the three and six month periods ended June 30, 2023 and 2022, net gains or losses realized, from previously unrealized net gains or losses on hedges that had been discontinued, were not material.
|
| X |
- DefinitionThe entire disclosure for derivative instruments and hedging activities including, but not limited to, risk management strategies, non-hedging derivative instruments, assets, liabilities, revenue and expenses, and methodologies and assumptions used in determining the amounts. Reference 1: http://www.xbrl.org/2003/role/disclosureRef
-Topic 815
-SubTopic 40
-Name Accounting Standards Codification
-Section 50
-Paragraph 5
-Subparagraph (f)
-Publisher FASB
-URI https://asc.fasb.org//1943274/2147480237/815-40-50-5
Reference 2: http://www.xbrl.org/2003/role/disclosureRef
-Topic 815
-SubTopic 10
-Name Accounting Standards Codification
-Section 50
-Paragraph 5C
-Subparagraph (b)
-Publisher FASB
-URI https://asc.fasb.org//1943274/2147480434/815-10-50-5C
Reference 3: http://fasb.org/us-gaap/role/ref/legacyRef
-Topic 815
-Name Accounting Standards Codification
-Publisher FASB
-URI https://asc.fasb.org//815/tableOfContent
| Name: |
us-gaap_DerivativeInstrumentsAndHedgingActivitiesDisclosureTextBlock |
| Namespace Prefix: |
us-gaap_ |
| Data Type: |
dtr-types:textBlockItemType |
| Balance Type: |
na |
| Period Type: |
duration |
|
| X |
- References
+ Details
| Name: |
us-gaap_SummaryOfDerivativeInstrumentsAbstract |
| Namespace Prefix: |
us-gaap_ |
| Data Type: |
xbrli:stringItemType |
| Balance Type: |
na |
| Period Type: |
duration |
|
v3.23.2
Income Taxes
|
6 Months Ended |
Jun. 30, 2023 |
|---|
| Income Tax Disclosure [Abstract] |
|
| Income Taxes |
Tredegar recorded tax benefit of $3.0 million on pre-tax loss of $22.9 million in the first six months of 2023. Therefore, the effective tax rate in the first six months of 2023 was 13.1%, compared to 16.9% in the first six months of 2022. The change in the effective tax rate is primarily due to a pre-tax loss in first six months of 2023 versus pre-tax income in first six months of 2022, lower Brazil tax incentives, a discrete charge in the second quarter of 2023 for a Brazil tax law change and a large discrete benefit recorded in the first quarter of 2022, resulting from the implementation of new U.S. tax regulations associated with foreign tax credits published by the U.S. Treasury and Internal Revenue Service on January 4, 2022. These regulations overhauled various components of the foreign tax credit regime including the determination of creditable foreign taxes and limit the amount of foreign taxes that are creditable against U.S. income taxes. As the result of these regulations, future Brazilian income tax under Brazil tax law in place at that time would have been deductible, but not creditable, in the U.S. The accounting rules require a reduction of the U.S. deferred tax liability previously established related to anticipated future income from Brazil. The tax effect of the reduction of the U.S. deferred tax liability resulted in the discrete tax benefit described above. In the second quarter of 2023, Brazil enacted new tax legislation which will likely cause the Brazil income tax to once again be creditable after 2023. This law change caused a partial reversal of the discrete tax benefit recognized in the first quarter of 2022 described above, which increased the deferred tax liability related to anticipated future income from Brazil. Total deferred tax assets increased during the second quarter of 2023 compared to December 31, 2022 primarily due to changes in other comprehensive income, increase in net operational loss and decrease in deferred tax liability related to the goodwill impairment that took place in second quarter of 2023. Tredegar accrues U.S. federal income taxes on unremitted earnings of foreign subsidiaries where required. However, due to changes in the taxation of dividends under the U.S. Tax Cuts and Jobs Act of 2017, Tredegar will only record U.S. federal income taxes on unremitted earnings of its foreign subsidiaries where Tredegar cannot take steps to eliminate any potential tax on future distributions from its foreign subsidiaries. The Brazilian federal statutory income tax rate is a composite of 34.0% (25.0% of income tax and 9.0% of social contribution on income). Terphane Ltda.’s manufacturing facility in Brazil is the beneficiary of certain income tax incentives that allow for a reduction in the statutory Brazilian federal income tax rate to 15.25% levied on the operating profit on certain of its products. The incentives have been granted for a 10-year period, from the commencement date of January 1, 2015 and expiring at the end of 2024. The benefit from the tax incentives was $0.4 million and $2.6 million in the first six months of 2023 and 2022, respectively. Tredegar and its subsidiaries file income tax returns in the U.S., various states, and jurisdictions outside the U.S. With exceptions for some U.S. states and non-U.S. jurisdictions, Tredegar and its subsidiaries as of June 30, 2023 are no longer subject to U.S. federal, state or non-U.S. income tax examinations by tax authorities for years before 2018
|
| X |
- DefinitionThe entire disclosure for income taxes. Disclosures may include net deferred tax liability or asset recognized in an enterprise's statement of financial position, net change during the year in the total valuation allowance, approximate tax effect of each type of temporary difference and carryforward that gives rise to a significant portion of deferred tax liabilities and deferred tax assets, utilization of a tax carryback, and tax uncertainties information. Reference 1: http://www.xbrl.org/2003/role/disclosureRef
-Topic 946
-SubTopic 20
-Name Accounting Standards Codification
-Section 50
-Paragraph 13
-Publisher FASB
-URI https://asc.fasb.org//1943274/2147480990/946-20-50-13
Reference 2: http://www.xbrl.org/2003/role/disclosureRef
-Topic 235
-SubTopic 10
-Name Accounting Standards Codification
-Section S99
-Paragraph 1
-Subparagraph (SX 210.4-08(h)(2))
-Publisher FASB
-URI https://asc.fasb.org//1943274/2147480678/235-10-S99-1
Reference 3: http://www.xbrl.org/2003/role/disclosureRef
-Topic 740
-Name Accounting Standards Codification
-Publisher FASB
-URI https://asc.fasb.org//740/tableOfContent
Reference 4: http://www.xbrl.org/2003/role/disclosureRef
-Topic 740
-SubTopic 10
-Name Accounting Standards Codification
-Section 50
-Paragraph 14
-Publisher FASB
-URI https://asc.fasb.org//1943274/2147482685/740-10-50-14
Reference 5: http://www.xbrl.org/2003/role/disclosureRef
-Topic 740
-SubTopic 10
-Name Accounting Standards Codification
-Section 50
-Paragraph 21
-Publisher FASB
-URI https://asc.fasb.org//1943274/2147482685/740-10-50-21
Reference 6: http://www.xbrl.org/2003/role/disclosureRef
-Topic 740
-SubTopic 270
-Name Accounting Standards Codification
-Section 50
-Paragraph 1
-Publisher FASB
-URI https://asc.fasb.org//1943274/2147482526/740-270-50-1
Reference 7: http://www.xbrl.org/2003/role/disclosureRef
-Topic 740
-SubTopic 10
-Name Accounting Standards Codification
-Section 50
-Paragraph 17
-Subparagraph (b)
-Publisher FASB
-URI https://asc.fasb.org//1943274/2147482685/740-10-50-17
Reference 8: http://www.xbrl.org/2003/role/disclosureRef
-Topic 740
-SubTopic 10
-Name Accounting Standards Codification
-Section S99
-Paragraph 1
-Subparagraph (SAB TOPIC 6.I.5.Q1)
-Publisher FASB
-URI https://asc.fasb.org//1943274/2147479360/740-10-S99-1
Reference 9: http://www.xbrl.org/2003/role/disclosureRef
-Topic 740
-SubTopic 10
-Name Accounting Standards Codification
-Section S99
-Paragraph 2
-Subparagraph (SAB Topic 11.C)
-Publisher FASB
-URI https://asc.fasb.org//1943274/2147479360/740-10-S99-2
Reference 10: http://www.xbrl.org/2003/role/disclosureRef
-Topic 740
-SubTopic 30
-Name Accounting Standards Codification
-Section 50
-Paragraph 2
-Subparagraph (a)
-Publisher FASB
-URI https://asc.fasb.org//1943274/2147482603/740-30-50-2
| Name: |
us-gaap_IncomeTaxDisclosureTextBlock |
| Namespace Prefix: |
us-gaap_ |
| Data Type: |
dtr-types:textBlockItemType |
| Balance Type: |
na |
| Period Type: |
duration |
|
v3.23.2
Segment Reporting
|
6 Months Ended |
Jun. 30, 2023 |
|---|
| Segment Reporting [Abstract] |
|
| Segment Reporting |
The Company’s business segments are Aluminum Extrusions, PE Films, and Flexible Packaging Films. Information by business segment is reported below. There are no accounting transactions between segments and no allocations to segments. The Company’s reportable segments are based on its method of internal reporting, which is generally segregated by differences in products. Accounting standards for presentation of segments require an approach based on the way the Company organizes the segments for making operating decisions and how the chief operating decision maker (“CODM”) assesses performance. EBITDA from ongoing operations is the key profitability measure used by the CODM (Tredegar’s President and Chief Executive Officer) for purposes of assessing financial performance. The Company uses sales less freight (“net sales”) as its measure of revenues from external customers at the segment level. This measure is separately included in the financial information regularly provided to the CODM. The following table presents net sales and EBITDA from ongoing operations by segment for the three and six months ended June 30, 2023 and 2022: | | | | | | | | | | | | | | | | | | | | | | | | | Three Months Ended June 30, | | Six Months Ended June 30, | | (In thousands) | 2023 | | 2022 | | 2023 | | 2022 | | Net Sales | | | | | | | | | Aluminum Extrusions | $ | 121,827 | | | $ | 190,308 | | | $ | 255,197 | | | $ | 348,417 | | | PE Films | 15,918 | | | 31,424 | | | 36,099 | | | 62,555 | | | Flexible Packaging Films | 33,223 | | | 41,595 | | | 64,750 | | | 80,839 | | | Total net sales | 170,968 | | | 263,327 | | | 356,046 | | | 491,811 | | | Add back freight | 7,199 | | | 11,036 | | | 13,243 | | | 19,118 | | | Sales as shown in the condensed consolidated statements of income (loss) | $ | 178,167 | | | $ | 274,363 | | | $ | 369,289 | | | $ | 510,929 | | | EBITDA from Ongoing Operations | | | | | | | | | Aluminum Extrusions: | | | | | | | | | Ongoing operations: | | | | | | | | | EBITDA | $ | 10,217 | | | $ | 21,895 | | | $ | 24,855 | | | $ | 45,814 | | | Depreciation & amortization | (4,158) | | | (4,169) | | | (8,569) | | | (8,430) | | | EBIT | 6,059 | | | 17,726 | | | 16,286 | | | 37,384 | | | Plant shutdowns, asset impairments, restructurings and other | 155 | | | 16 | | | (339) | | | (89) | | | PE Films: | | | | | | | | | Ongoing operations: | | | | | | | | | EBITDA | 814 | | | 7,065 | | | 2,663 | | | 14,112 | | | Depreciation & amortization | (1,552) | | | (1,559) | | | (3,195) | | | (3,154) | | | EBIT | (738) | | | 5,506 | | | (532) | | | 10,958 | | | Plant shutdowns, asset impairments, restructurings and other | — | | | (50) | | | 2 | | | (153) | | | Goodwill impairment | (15,413) | | | — | | | (15,413) | | | — | | | Flexible Packaging Films: | | | | | | | | | Ongoing operations: | | | | | | | | | EBITDA | 249 | | | 7,631 | | | 1,599 | | | 12,665 | | | Depreciation & amortization | (711) | | | (583) | | | (1,411) | | | (1,132) | | | EBIT | (462) | | | 7,048 | | | 188 | | | 11,533 | | | Plant shutdowns, asset impairments, restructurings and other | (1) | | | (37) | | | (79) | | | (80) | | | Total | (10,400) | | | 30,209 | | | 113 | | | 59,553 | | | Interest income | 30 | | | 3 | | | 74 | | | 32 | | | Interest expense | 2,374 | | | 1,234 | | | 4,686 | | | 2,020 | | | Gain on investment in kaléo | — | | | 1,406 | | | 262 | | | 1,406 | | | Stock option-based compensation costs | — | | | 251 | | | 231 | | | 882 | | | Corporate expenses, net | 9,509 | | | 9,708 | | | 18,466 | | | 20,463 | | | Income (loss) before income taxes | (22,253) | | | 20,425 | | | (22,934) | | | 37,626 | | | Income tax expense (benefit) | (3,331) | | | 5,556 | | | (3,000) | | | 6,334 | | | Net income (loss) | $ | (18,922) | | | $ | 14,869 | | | $ | (19,934) | | | $ | 31,292 | |
The following table presents identifiable assets by segment at June 30, 2023 and December 31, 2022: | | | | | | | | | | | | | (In thousands) | June 30, 2023 | | December 31, 2022 | | Aluminum Extrusions | $ | 266,426 | | | $ | 293,308 | | | PE Films | 82,191 | | | 102,431 | | | Flexible Packaging Films | 91,568 | | | 103,448 | | | Subtotal | 440,185 | | | 499,187 | | | General corporate | 23,491 | | | 23,674 | | | Cash and cash equivalents | 21,193 | | | 19,232 | | | Total | $ | 484,869 | | | $ | 542,093 | |
The following tables disaggregate the Company’s revenue by geographic area and product group for the three and six months ended June 30, 2023 and 2022: | | | | | | | | | | | | | | | | | | | | | | | | | Net Sales by Geographic Area (a) | | Three Months Ended June 30, | | Six Months Ended June 30, | | (In thousands) | 2023 | | 2022 | | 2023 | | 2022 | | United States | $ | 133,417 | | | $ | 213,955 | | | $ | 284,027 | | | $ | 396,092 | | | Exports from the United States to: | | | | | | | | | Asia | 5,477 | | | 14,680 | | | 11,209 | | | 27,145 | | | Latin America | 1,817 | | | 1,245 | | | 3,676 | | | 2,686 | | | Canada | 4,955 | | | 4,173 | | | 9,239 | | | 8,366 | | | Europe | 272 | | | 1,085 | | | 1,132 | | | 2,448 | | | Operations outside the United States: | | | | | | | | | Brazil | 24,975 | | | 28,189 | | | 46,603 | | | 55,074 | | | Asia | 55 | | | — | | | 160 | | | — | | | Total | $ | 170,968 | | | $ | 263,327 | | | $ | 356,046 | | | $ | 491,811 | | (a) Export sales relate mostly to PE Films. Operations in Brazil relate to Flexible Packaging Films. |
The Company’s facilities in Pottsville, PA (“PV”) and Guangzhou, China (“GZ”) have a tolling arrangement whereby certain surface protection films are manufactured in GZ for a fee with raw materials supplied from PV that are then shipped by GZ directly to customers principally in the Asian market, but paid by customers directly to PV. Amounts associated with this intercompany tolling arrangement are reported in the table above as export sales from the U.S. to Asia, and include net sales of $3.4 million and $5.3 million in the second quarter of 2023 and 2022, respectively, and $6.8 million and $11.7 million in the first six months of 2023 and 2022, respectively. | | | | | | | | | | | | | | | | | | | | | | | | | Net Sales by Product Group | | Three Months Ended June 30, | | Six Months Ended June 30, | | (In thousands) | 2023 | | 2022 | | 2023 | | 2022 | | Aluminum Extrusions: | | | | | | | | | Nonresidential building & construction | $ | 65,784 | | | $ | 99,302 | | | $ | 144,413 | | | $ | 180,223 | | | Consumer durables | 11,714 | | | 18,805 | | | 22,061 | | | 35,695 | | | Automotive | 11,769 | | | 14,473 | | | 23,891 | | | 28,314 | | | Residential building & construction | 10,056 | | | 20,948 | | | 21,659 | | | 37,413 | | | Electrical | 6,078 | | | 9,687 | | | 14,207 | | | 16,974 | | | Machinery & equipment | 11,082 | | | 15,929 | | | 21,806 | | | 28,874 | | | Distribution | 5,344 | | | 11,164 | | | 7,160 | | | 20,924 | | | Subtotal | 121,827 | | | 190,308 | | | 255,197 | | | 348,417 | | | PE Films: | | | | | | | | | Surface protection films | 8,643 | | | 23,674 | | | 21,497 | | | 45,822 | | | Overwrap packaging | 7,275 | | | 7,750 | | | 14,602 | | | 16,733 | | | Subtotal | 15,918 | | | 31,424 | | | 36,099 | | | 62,555 | | | Flexible Packaging Films | 33,223 | | | 41,595 | | | 64,750 | | | 80,839 | | | Total | $ | 170,968 | | | $ | 263,327 | | | $ | 356,046 | | | $ | 491,811 | |
|
| X |
- References
+ Details
| Name: |
us-gaap_SegmentReportingAbstract |
| Namespace Prefix: |
us-gaap_ |
| Data Type: |
xbrli:stringItemType |
| Balance Type: |
na |
| Period Type: |
duration |
|
| X |
- DefinitionThe entire disclosure for reporting segments including data and tables. Reportable segments include those that meet any of the following quantitative thresholds a) it's reported revenue, including sales to external customers and intersegment sales or transfers is 10 percent or more of the combined revenue, internal and external, of all operating segments b) the absolute amount of its reported profit or loss is 10 percent or more of the greater, in absolute amount of 1) the combined reported profit of all operating segments that did not report a loss or 2) the combined reported loss of all operating segments that did report a loss c) its assets are 10 percent or more of the combined assets of all operating segments. Reference 1: http://www.xbrl.org/2003/role/disclosureRef
-Topic 280
-SubTopic 10
-Name Accounting Standards Codification
-Section 50
-Paragraph 22
-Publisher FASB
-URI https://asc.fasb.org//1943274/2147482810/280-10-50-22
Reference 2: http://www.xbrl.org/2003/role/disclosureRef
-Topic 280
-SubTopic 10
-Name Accounting Standards Codification
-Section 50
-Paragraph 15
-Publisher FASB
-URI https://asc.fasb.org//1943274/2147482810/280-10-50-15
Reference 3: http://www.xbrl.org/2003/role/disclosureRef
-Topic 280
-SubTopic 10
-Name Accounting Standards Codification
-Section 50
-Paragraph 31
-Publisher FASB
-URI https://asc.fasb.org//1943274/2147482810/280-10-50-31
Reference 4: http://www.xbrl.org/2003/role/disclosureRef
-Topic 280
-SubTopic 10
-Name Accounting Standards Codification
-Section 50
-Paragraph 32
-Subparagraph (d)
-Publisher FASB
-URI https://asc.fasb.org//1943274/2147482810/280-10-50-32
Reference 5: http://www.xbrl.org/2003/role/disclosureRef
-Topic 280
-SubTopic 10
-Name Accounting Standards Codification
-Section 50
-Paragraph 42
-Publisher FASB
-URI https://asc.fasb.org//1943274/2147482810/280-10-50-42
Reference 6: http://www.xbrl.org/2003/role/disclosureRef
-Topic 280
-SubTopic 10
-Name Accounting Standards Codification
-Section 50
-Paragraph 32
-Subparagraph (f)
-Publisher FASB
-URI https://asc.fasb.org//1943274/2147482810/280-10-50-32
Reference 7: http://www.xbrl.org/2003/role/disclosureRef
-Topic 280
-SubTopic 10
-Name Accounting Standards Codification
-Section 50
-Paragraph 40
-Publisher FASB
-URI https://asc.fasb.org//1943274/2147482810/280-10-50-40
Reference 8: http://www.xbrl.org/2003/role/disclosureRef
-Topic 280
-Name Accounting Standards Codification
-Publisher FASB
-URI https://asc.fasb.org//280/tableOfContent
Reference 9: http://www.xbrl.org/2003/role/disclosureRef
-Topic 280
-SubTopic 10
-Name Accounting Standards Codification
-Section 50
-Paragraph 26
-Publisher FASB
-URI https://asc.fasb.org//1943274/2147482810/280-10-50-26
Reference 10: http://www.xbrl.org/2003/role/disclosureRef
-Topic 280
-SubTopic 10
-Name Accounting Standards Codification
-Section 50
-Paragraph 34
-Publisher FASB
-URI https://asc.fasb.org//1943274/2147482810/280-10-50-34
Reference 11: http://www.xbrl.org/2003/role/disclosureRef
-Topic 280
-SubTopic 10
-Name Accounting Standards Codification
-Section 50
-Paragraph 41
-Publisher FASB
-URI https://asc.fasb.org//1943274/2147482810/280-10-50-41
Reference 12: http://www.xbrl.org/2003/role/disclosureRef
-Topic 280
-SubTopic 10
-Name Accounting Standards Codification
-Section 50
-Paragraph 21
-Subparagraph (a)
-Publisher FASB
-URI https://asc.fasb.org//1943274/2147482810/280-10-50-21
Reference 13: http://www.xbrl.org/2003/role/disclosureRef
-Topic 280
-SubTopic 10
-Name Accounting Standards Codification
-Section 50
-Paragraph 21
-Subparagraph (b)
-Publisher FASB
-URI https://asc.fasb.org//1943274/2147482810/280-10-50-21
Reference 14: http://www.xbrl.org/2003/role/disclosureRef
-Topic 280
-SubTopic 10
-Name Accounting Standards Codification
-Section 50
-Paragraph 32
-Subparagraph (e)
-Publisher FASB
-URI https://asc.fasb.org//1943274/2147482810/280-10-50-32
| Name: |
us-gaap_SegmentReportingDisclosureTextBlock |
| Namespace Prefix: |
us-gaap_ |
| Data Type: |
dtr-types:textBlockItemType |
| Balance Type: |
na |
| Period Type: |
duration |
|
v3.23.2
Restructuring and Related Activities
|
6 Months Ended |
Jun. 30, 2023 |
|---|
| Restructuring and Related Activities [Abstract] |
|
| Supply Chain Financing |
11. SUPPLY CHAIN FINANCING The Company has supply chain finance service agreements with third-party financial institutions to provide platforms that facilitate the ability of participating suppliers to finance payment obligations from the Company with the third-party financial institution. The Company’s obligations to its suppliers, including amounts due and scheduled payment dates, are not affected by suppliers’ decisions to finance amounts under the supply chain finance agreements. As of June 30, 2023 and December 31, 2022, $14.6 million and $25.9 million, respectively, of the Company’s accounts payable were financed by participating suppliers through third-party financial institutions.
|
| X |
- Definition
+ References
+ Details
| Name: |
tg_SupplyChainFinancingTextBlock |
| Namespace Prefix: |
tg_ |
| Data Type: |
dtr-types1:textBlockItemType |
| Balance Type: |
na |
| Period Type: |
duration |
|
v3.23.2
Subsequent Events (Notes)
|
6 Months Ended |
Jun. 30, 2023 |
|---|
| Subsequent Events [Abstract] |
|
| Subsequent Events [Text Block] |
12. SUBSEQUENT EVENTS Closure of PE Films Technical Center On August 3, 2023, the Company adopted a plan to close the PE Films technical center in Richmond, VA and reduce its efforts to develop and sell films supporting the semiconductor market. Future research & development activities for PE Films will be performed at the facility in Pottsville, PA. PE Films continues to have new business opportunities primarily relating to surface protection films that protect components of flat panel and flexible displays. The Company anticipates all activities to cease at the PE Films technical center in Richmond, VA, by the end of 2023. The Company expects to recognize cash costs associated with exit activities of $1.8 million for: (i) severance and related costs ($0.9 million), (ii) vacating the facility lease ($0.6 million payable through June 2025), and (iii) building closure costs ($0.3 million). In addition, the Company expects non-cash asset write-offs and accelerated depreciation of up to $4.5 million. Net annual cash savings of $3.4 million are anticipated, beginning in the fourth quarter of 2023. Entry into an Amendment to the Credit Agreement and Suspension of Regular Quarterly Dividend Subsequent to June 30, 2023, to reduce the risk of potential violations of the primary financial restrictive covenants in its five-year, revolving, secured credit facility that matures on June 29, 2027 (the "Credit Agreement"), the Company (i) suspended its regular quarterly dividend (which had an annual cash outlay of approximately $17.7 million) and (ii) amended the Credit Agreement, effective August 3, 2023, to: a.Change the fiscal quarter maximum Total Net Leverage Ratio covenant from 4.0x to: (i) 5.0x for the quarters ending September 30, 2023 through March 31, 2024, (ii) 4.75x for the quarter ending June 30, 2024, (iii) 4.25 for the quarter ending September 30, 2024, and (iv) 4.0x for the quarter ending December 31, 2024 and thereafter. b.Change the fiscal quarter minimum Interest Coverage Ratio covenant from 3.0x to: (i) 2.50x for the quarters ending September 30, 2023 through June 30, 2024, (ii) 2.75x for the quarter ending September 30, 2024, and (iii) 3.0x for the quarter ending December 31, 2024 and thereafter. c.Reduce the maximum borrowing availability from $375 million to $200 million. d.Increase the drawn spread by 25 basis points across all levels of the interest rate pricing grid, beginning the quarter ending September 30, 2023. e.Amend the restricted payments covenant to prohibit dividends and share repurchases during fiscal quarters ending September 30, 2023 through December 31, 2024.
|
| X |
- References
+ Details
| Name: |
us-gaap_SubsequentEventsAbstract |
| Namespace Prefix: |
us-gaap_ |
| Data Type: |
xbrli:stringItemType |
| Balance Type: |
na |
| Period Type: |
duration |
|
| X |
- DefinitionThe entire disclosure for significant events or transactions that occurred after the balance sheet date through the date the financial statements were issued or the date the financial statements were available to be issued. Examples include: the sale of a capital stock issue, purchase of a business, settlement of litigation, catastrophic loss, significant foreign exchange rate changes, loans to insiders or affiliates, and transactions not in the ordinary course of business. Reference 1: http://www.xbrl.org/2003/role/disclosureRef
-Topic 855
-Name Accounting Standards Codification
-Publisher FASB
-URI https://asc.fasb.org//855/tableOfContent
Reference 2: http://www.xbrl.org/2003/role/disclosureRef
-Topic 855
-SubTopic 10
-Name Accounting Standards Codification
-Section 50
-Paragraph 2
-Subparagraph (a)
-Publisher FASB
-URI https://asc.fasb.org//1943274/2147483399/855-10-50-2
| Name: |
us-gaap_SubsequentEventsTextBlock |
| Namespace Prefix: |
us-gaap_ |
| Data Type: |
dtr-types:textBlockItemType |
| Balance Type: |
na |
| Period Type: |
duration |
|
v3.23.2
Accounts and Other Receivables (Tables)
|
6 Months Ended |
Jun. 30, 2023 |
|---|
| Receivables [Abstract] |
|
| Schedule of Accounts, Notes, Loans and Financing Receivable [Table Text Block] |
As of June 30, 2023 and December 31, 2022, accounts receivable and other receivables, net include the following: | | | | | | | | | | | | | (In thousands) | June 30, 2023 | | December 31, 2022 | | Customer receivables | $ | 79,112 | | | $ | 83,667 | | | Other receivables | 2,233 | | | 3,874 | | | Total accounts and other receivables | 81,345 | | | 87,541 | | | Less: Allowance for bad debts | (2,206) | | | (2,997) | | | Total accounts and other receivables, net | $ | 79,139 | | | $ | 84,544 | |
|
| X |
- References
+ Details
| Name: |
us-gaap_ReceivablesAbstract |
| Namespace Prefix: |
us-gaap_ |
| Data Type: |
xbrli:stringItemType |
| Balance Type: |
na |
| Period Type: |
duration |
|
| X |
- DefinitionTabular disclosure of the various types of trade accounts and notes receivable and for each the gross carrying value, allowance, and net carrying value as of the balance sheet date. Presentation is categorized by current, noncurrent and unclassified receivables. Reference 1: http://fasb.org/us-gaap/role/ref/legacyRef
-Name Accounting Standards Codification
-Topic 210
-SubTopic 10
-Section S99
-Paragraph 1
-Subparagraph (SX 210.5-02.3,4)
-Publisher FASB
-URI https://asc.fasb.org//1943274/2147480566/210-10-S99-1
| Name: |
us-gaap_ScheduleOfAccountsNotesLoansAndFinancingReceivableTextBlock |
| Namespace Prefix: |
us-gaap_ |
| Data Type: |
dtr-types:textBlockItemType |
| Balance Type: |
na |
| Period Type: |
duration |
|
v3.23.2
Inventories (Tables)
|
6 Months Ended |
Jun. 30, 2023 |
|---|
| Inventory, Net [Abstract] |
|
| Schedule of Inventory, Current |
The components of inventories are as follows: | | | | | | | | | | | | | (In thousands) | June 30, 2023 | | December 31, 2022 | | Finished goods | $ | 29,677 | | | $ | 34,686 | | | Work-in-process | 12,678 | | | 15,604 | | | Raw materials | 23,897 | | | 58,262 | | | Stores, supplies and other | 20,440 | | | 19,219 | | | Total | $ | 86,692 | | | $ | 127,771 | |
|
| X |
- References
+ Details
| Name: |
us-gaap_InventoryNetAbstract |
| Namespace Prefix: |
us-gaap_ |
| Data Type: |
xbrli:stringItemType |
| Balance Type: |
na |
| Period Type: |
duration |
|
| X |
- DefinitionTabular disclosure of the carrying amount as of the balance sheet date of merchandise, goods, commodities, or supplies held for future sale or to be used in manufacturing, servicing or production process. Reference 1: http://fasb.org/us-gaap/role/ref/legacyRef
-Topic 210
-SubTopic 10
-Name Accounting Standards Codification
-Section S99
-Paragraph 1
-Subparagraph (SX 210.5-02(6)(a))
-Publisher FASB
-URI https://asc.fasb.org//1943274/2147480566/210-10-S99-1
Reference 2: http://fasb.org/us-gaap/role/ref/legacyRef
-Topic 210
-SubTopic 10
-Name Accounting Standards Codification
-Section S99
-Paragraph 1
-Subparagraph (SX 210.5-02(6)(b))
-Publisher FASB
-URI https://asc.fasb.org//1943274/2147480566/210-10-S99-1
Reference 3: http://fasb.org/us-gaap/role/ref/legacyRef
-Topic 210
-SubTopic 10
-Name Accounting Standards Codification
-Section S99
-Paragraph 1
-Subparagraph (SX 210.5-02(6)(c))
-Publisher FASB
-URI https://asc.fasb.org//1943274/2147480566/210-10-S99-1
Reference 4: http://fasb.org/us-gaap/role/ref/legacyRef
-Name Accounting Standards Codification
-Topic 210
-SubTopic 10
-Section 50
-Paragraph 1
-Publisher FASB
-URI https://asc.fasb.org//1943274/2147483489/210-10-50-1
| Name: |
us-gaap_ScheduleOfInventoryCurrentTableTextBlock |
| Namespace Prefix: |
us-gaap_ |
| Data Type: |
dtr-types:textBlockItemType |
| Balance Type: |
na |
| Period Type: |
duration |
|
v3.23.2
Pension And Other Post-Retirement Benefits (Tables)
|
6 Months Ended |
Jun. 30, 2023 |
|---|
| Retirement Benefits [Abstract] |
|
| Schedule Of Components Of Net Periodic Benefit Cost For Pension And Other Post-Retirement Benefit Programs |
The components of net periodic benefit cost for the pension and other postretirement benefit programs reflected in the condensed consolidated statements of income for the three and six months ended June 30, 2023 and 2022, are shown below: | | | | | | | | | | | | | | | | | | | | | | | | | Pension Benefits | | Other Post-Retirement Benefits | | | Three Months Ended June 30, | | Three Months Ended June 30, | | (In thousands) | 2023 | | 2022 | | 2023 | | 2022 | | Service cost | $ | — | | | $ | — | | | $ | 3 | | | $ | 5 | | | Interest cost | 3,028 | | | 2,225 | | | 71 | | | 51 | | | Expected return on plan assets | (2,607) | | | (2,043) | | | — | | | — | | | Amortization of prior service costs, (gains) losses and net transition asset | 2,982 | | | 3,302 | | | (59) | | | (34) | | | Net periodic benefit cost | $ | 3,403 | | | $ | 3,484 | | | $ | 15 | | | $ | 22 | | | | | | | | | | | Pension Benefits | | Other Post-Retirement Benefits | | | Six Months Ended June 30, | | Six Months Ended June 30, | | (In thousands) | 2023 | | 2022 | | 2023 | | 2022 | | Service cost | $ | — | | | $ | — | | | $ | 6 | | | $ | 10 | | | Interest cost | 6,056 | | | 4,450 | | | 142 | | | 102 | | | Expected return on plan assets | (5,214) | | | (4,098) | | | — | | | — | | | Amortization of prior service costs, (gains) losses and net transition asset | 5,965 | | | 6,586 | | | (118) | | | (68) | | | Net periodic benefit cost | $ | 6,807 | | | $ | 6,938 | | | $ | 30 | | | $ | 44 | |
|
| X |
- DefinitionSchedule Of Components Of Net Periodic Benefit Cost For Pension And Other Post-Retirement Benefit Programs [Table Text Block]
| Name: |
tg_ScheduleOfComponentsOfNetPeriodicBenefitCostForPensionAndOtherPostRetirementBenefitProgramsTableTextBlock |
| Namespace Prefix: |
tg_ |
| Data Type: |
dtr-types1:textBlockItemType |
| Balance Type: |
na |
| Period Type: |
duration |
|
| X |
- References
+ Details
| Name: |
us-gaap_CompensationAndRetirementDisclosureAbstract |
| Namespace Prefix: |
us-gaap_ |
| Data Type: |
xbrli:stringItemType |
| Balance Type: |
na |
| Period Type: |
duration |
|
v3.23.2
Other Income (Expense), Net Other Income (Expense), Net Summary Table (Tables)
|
6 Months Ended |
Jun. 30, 2023 |
|---|
| Other Income and Expenses [Abstract] |
|
| Schedule of Other Nonoperating Income (Expense) [Table Text Block] |
| | | | | | | | | | | | | | | | | | | | | | | | | Three Months Ended June 30, | | Six Months Ended June 30, | | (In thousands) | 2023 | | 2022 | | 2023 | | 2022 | Gain on investment in kaléo(a) | $ | — | | | $ | 1,406 | | | $ | 262 | | | $ | 1,406 | | COVID-19-related expenses, net of relief (b) | — | | | (96) | | | — | | | (308) | | | | | | | | | | | | | | | | | | | | | | | | | | | | | | | | | | | Other | (20) | | | 32 | | | (2) | | | (57) | | | Total | $ | (20) | | | $ | 1,342 | | | $ | 260 | | | $ | 1,041 | | (a) In January 2023, additional cash consideration of $0.3 million was received related to the customary post-closing adjustments on the sale of the investment in kaleo, Inc ("kaléo"), which was sold in December 2021. (b) Costs associated with operating under COVID-19 conditions include employee overtime expenses associated with absenteeism, personal protective equipment supplies and facility maintenance. |
|
| X |
- References
+ Details
| Name: |
us-gaap_OtherIncomeAndExpensesAbstract |
| Namespace Prefix: |
us-gaap_ |
| Data Type: |
xbrli:stringItemType |
| Balance Type: |
na |
| Period Type: |
duration |
|
| X |
- DefinitionTabular disclosure of the components of non-operating income or non-operating expense that may include amounts earned from dividends, interest on securities, gains (losses) on securities sold, equity earnings of unconsolidated affiliates, net gain (loss) on sales of business, interest expense and other miscellaneous income or expense items.
| Name: |
us-gaap_ScheduleOfOtherNonoperatingIncomeExpenseTableTextBlock |
| Namespace Prefix: |
us-gaap_ |
| Data Type: |
dtr-types:textBlockItemType |
| Balance Type: |
na |
| Period Type: |
duration |
|
v3.23.2
Earnings Per Share (Tables)
|
6 Months Ended |
Jun. 30, 2023 |
|---|
| Earnings Per Share [Abstract] |
|
| Schedule of Earnings Per Share, Basic and Diluted |
Diluted earnings per share is computed by dividing net income (loss) by the weighted average common and potentially dilutive common equivalent shares outstanding, determined as follows: | | | | | | | | | | | | | | | | | | | | | | | | | Three Months Ended | | Six Months Ended | | | June 30, | | June 30, | | (In thousands) | 2023 | | 2022 | | 2023 | | 2022 | | Weighted average shares outstanding used to compute basic earnings per share | 34,079 | | | 33,814 | | | 33,988 | | | 33,734 | | | Incremental dilutive shares attributable to stock options and restricted stock | — | | | 40 | | | — | | | 42 | | | Shares used to compute diluted earnings per share | 34,079 | | | 33,854 | | | 33,988 | | | 33,776 | |
|
| X |
- References
+ Details
| Name: |
us-gaap_EarningsPerShareAbstract |
| Namespace Prefix: |
us-gaap_ |
| Data Type: |
xbrli:stringItemType |
| Balance Type: |
na |
| Period Type: |
duration |
|
| X |
- DefinitionTabular disclosure of an entity's basic and diluted earnings per share calculations, including a reconciliation of numerators and denominators of the basic and diluted per-share computations for income from continuing operations. Reference 1: http://www.xbrl.org/2009/role/commonPracticeRef
-Topic 260
-SubTopic 10
-Name Accounting Standards Codification
-Section 50
-Paragraph 1
-Subparagraph (a)
-Publisher FASB
-URI https://asc.fasb.org//1943274/2147482662/260-10-50-1
| Name: |
us-gaap_ScheduleOfEarningsPerShareBasicAndDilutedTableTextBlock |
| Namespace Prefix: |
us-gaap_ |
| Data Type: |
dtr-types:textBlockItemType |
| Balance Type: |
na |
| Period Type: |
duration |
|
v3.23.2
Accumulated Other Comprehensive Income (Loss) (Tables)
|
3 Months Ended |
Jun. 30, 2022 |
|---|
| Other Comprehensive Income (Loss), Net of Tax [Abstract] |
|
| Schedule Of Reclassifications Of Balances Out Of Accumulated Other Comprehensive Income (Loss) Into Net Income |
The changes in accumulated other comprehensive income (loss) by component for the six months ended June 30, 2023. | | | | | | | | | | | | | | | | | | | | | | | | | (In thousands) | Foreign Currency Translation | | Gain (Loss) on Derivative Financial Instruments | | Pension & Other Postretirement Benefit Adjust | | Total Accumulated Other Comprehensive Income (Loss) | | Balance at January 1, 2023 | $ | (86,079) | | | $ | (2,480) | | | $ | (59,036) | | | $ | (147,595) | | | Other comprehensive income (loss) | 3,356 | | | 5,565 | | | — | | | 8,921 | | | Income tax (expense) benefit | (615) | | | (2,031) | | | — | | | (2,646) | | | Other comprehensive income (loss), net of tax | 2,741 | | | 3,534 | | | — | | | 6,275 | | | Reclassification adjustment to net income (loss) | — | | | (2,594) | | | 5,847 | | | 3,253 | | | Income tax (expense) benefit | — | | | 697 | | | (1,274) | | | (577) | | | Reclassification adjustment to net income (loss), net of tax | — | | | (1,897) | | | 4,573 | | | 2,676 | | | Other comprehensive income (loss), net of tax | 2,741 | | | 1,637 | | | 4,573 | | | 8,951 | | Balance at June 30, 2023 | $ | (83,338) | | | $ | (843) | | | $ | (54,463) | | | $ | (138,644) | |
The changes in accumulated other comprehensive income (loss) by component for the three months ended June 30, 2022. | | | | | | | | | | | | | | | | | | | | | | | | | (In thousands) | Foreign Currency Translation | | Gain (Loss) on Derivative Financial Instruments | | Pension & Other Postretirement Benefit Adjust | | Total Accumulated Other Comprehensive Income (Loss) | | Balance at April 1, 2022 | $ | (80,256) | | | $ | 6,831 | | | $ | (62,075) | | | $ | (135,500) | | | Other comprehensive income (loss) | (5,712) | | | (11,681) | | | — | | | (17,393) | | | Income tax (expense) benefit | 482 | | | 3,110 | | | — | | | 3,592 | | | Other comprehensive income (loss), net of tax | (5,230) | | | (8,571) | | | — | | | (13,801) | | | Reclassification adjustment to net income (loss) | — | | | (840) | | | 3,268 | | | 2,428 | | | Income tax (expense) benefit | — | | | 250 | | | (712) | | | (462) | | | Reclassification adjustment to net income (loss), net of tax | — | | | (590) | | | 2,556 | | | 1,966 | | | Other comprehensive income (loss), net of tax | (5,230) | | | (9,161) | | | 2,556 | | | (11,835) | | Balance at June 30, 2022 | $ | (85,486) | | | $ | (2,330) | | | $ | (59,519) | | | $ | (147,335) | |
The changes in accumulated other comprehensive income (loss) by component for the six months ended June 30, 2022. | | | | | | | | | | | | | | | | | | | | | | | | | (In thousands) | Foreign Currency Translation | | Gain (Loss) on Derivative Financial Instruments | | Pension & Other Postretirement Benefit Adjust | | Total Accumulated Other Comprehensive Income (Loss) | | Balance at January 1, 2022 | $ | (85,792) | | | $ | 901 | | | $ | (64,613) | | | $ | (149,504) | | | Other comprehensive income (loss) | 552 | | | (1,678) | | | — | | | (1,126) | | | Income tax (expense) benefit | (246) | | | (80) | | | — | | | (326) | | | Other comprehensive income (loss), net of tax | 306 | | | (1,758) | | | — | | | (1,452) | | | Reclassification adjustment to net income (loss) | — | | | (1,997) | | | 6,518 | | | 4,521 | | | Income tax (expense) benefit | — | | | 524 | | | (1,424) | | | (900) | | | Reclassification adjustment to net income (loss), net of tax | — | | | (1,473) | | | 5,094 | | | 3,621 | | | Other comprehensive income (loss), net of tax | 306 | | | (3,231) | | | 5,094 | | | 2,169 | | Balance at June 30, 2022 | $ | (85,486) | | | $ | (2,330) | | | $ | (59,519) | | | $ | (147,335) | |
|
| X |
- DefinitionSchedule Of Reclassifications Of Balances Out Of Accumulated Other Comprehensive Income (Loss) Into Net Income [Table Text Block]
| Name: |
tg_ScheduleOfReclassificationsOfBalancesOutOfAccumulatedOtherComprehensiveIncomeLossIntoNetIncomeTableTextBlock |
| Namespace Prefix: |
tg_ |
| Data Type: |
dtr-types1:textBlockItemType |
| Balance Type: |
na |
| Period Type: |
duration |
|
| X |
- References
+ Details
| Name: |
us-gaap_OtherComprehensiveIncomeLossNetOfTaxPeriodIncreaseDecreaseAbstract |
| Namespace Prefix: |
us-gaap_ |
| Data Type: |
xbrli:stringItemType |
| Balance Type: |
na |
| Period Type: |
duration |
|
v3.23.2
Derivative Financial Instruments (Tables)
|
6 Months Ended |
Jun. 30, 2023 |
|---|
| Summary of Derivative Instruments [Abstract] |
|
| Summary Of Location And Fair Value Of Derivative Financial Instruments |
The table below summarizes the location and gross amounts of aluminum futures contract fair values (Level 2) in the condensed consolidated balance sheets as of June 30, 2023 and December 31, 2022: | | | | | | | | | | | | | | | | | | | | | | | | | | June 30, 2023 | | December 31, 2022 | | (In thousands) | Balance Sheet
Account | | Fair
Value | | Balance Sheet
Account | | Fair
Value | | Derivatives Designated as Hedging Instruments | | | | | | | | Asset derivatives: Aluminum futures contracts | Prepaid expenses and other | | $ | — | | | Prepaid expenses and other | | $ | 48 | | | | | | | | | | Liability derivatives: Aluminum futures contracts | Accrued expenses | | (3,050) | | | Accrued expenses | | (3,260) | | | Aluminum futures contracts | Other non-current liabilities | | (255) | | | Other non-current liabilities | | (369) | | | Net asset (liability) | | | $ | (3,305) | | | | | $ | (3,581) | |
The table below summarizes the location and gross amounts of foreign currency forward contract fair values (Level 2) in the condensed consolidated balance sheets as of June 30, 2023 and December 31, 2022: | | | | | | | | | | | | | | | | | | | | | | | | | | | June 30, 2023 | | December 31, 2022 | | (In thousands) | Balance Sheet
Account | | Fair
Value | | Balance Sheet
Account | | | Fair
Value | | Derivatives Designated as Hedging Instruments | | | | | | | | | Asset derivatives: Foreign currency forward contracts | Prepaid expenses and other | | $ | 2,974 | | | Prepaid expenses and other | | | $ | 781 | | | Foreign currency forward contracts | Other assets | | 723 | | | Other assets | | | 33 | | Liability derivatives: Foreign currency forward contracts | Accrued expenses | | — | | | Other non-current liabilities | | | (3) | | | Net asset (liability) | | | $ | 3,697 | | | | | | $ | 811 | |
|
| Derivative, Description of Hedged Item |
Terphane Ltda. had the following outstanding foreign exchange average forward rate contracts to purchase Brazilian Real and sell U.S. Dollars as of June 30, 2023: | | | | | | | | | | | | | | | | USD Notional Amount (000s) | Average Forward Rate Contracted on USD/BRL | R$ Equivalent Amount (000s) | Applicable Month | Estimated % of Terphane Ltda. R$ Operating Cost Exposure Hedged | | | | | | | | | | | | | | | | | $2,154 | 5.6378 | R$12,144 | Jul-23 | 83% | | $2,020 | 5.6831 | R$11,480 | Aug-23 | 78% | | $2,071 | 5.7174 | R$11,841 | Sep-23 | 80% | | $2,013 | 5.7556 | R$11,586 | Oct-23 | 79% | | $2,018 | 5.7836 | R$11,671 | Nov-23 | 79% | | $1,786 | 5.8312 | R$10,414 | Dec-23 | 71% | | $659 | 5.7360 | R$3,780 | Jan-24 | 23% | | $659 | 5.7562 | R$3,793 | Feb-24 | 23% | | $659 | 5.7774 | R$3,807 | Mar-24 | 23% | | $659 | 5.8000 | R$3,822 | Apr-24 | 23% | | $659 | 5.8207 | R$3,836 | May-24 | 24% | | $659 | 5.8419 | R$3,850 | Jun-24 | 24% | | $659 | 5.8636 | R$3,864 | Jul-24 | 24% | | $659 | 5.8872 | R$3,880 | Aug-24 | 24% | | $659 | 5.9118 | R$3,896 | Sep-24 | 24% | | $659 | 5.9350 | R$3,911 | Oct-24 | 24% | | $659 | 5.9581 | R$3,926 | Nov-24 | 24% | | $659 | 5.9813 | R$3,942 | Dec-24 | 24% | | $19,970 | 5.7808 | R$115,443 | | 40% |
|
| Schedule of Derivative Instruments in Statement of Financial Position, Fair Value [Table Text Block] |
The table below summarizes the location and gross amounts of aluminum futures contract fair values (Level 2) in the condensed consolidated balance sheets as of June 30, 2023 and December 31, 2022: | | | | | | | | | | | | | | | | | | | | | | | | | | June 30, 2023 | | December 31, 2022 | | (In thousands) | Balance Sheet
Account | | Fair
Value | | Balance Sheet
Account | | Fair
Value | | Derivatives Designated as Hedging Instruments | | | | | | | | Asset derivatives: Aluminum futures contracts | Prepaid expenses and other | | $ | — | | | Prepaid expenses and other | | $ | 48 | | | | | | | | | | Liability derivatives: Aluminum futures contracts | Accrued expenses | | (3,050) | | | Accrued expenses | | (3,260) | | | Aluminum futures contracts | Other non-current liabilities | | (255) | | | Other non-current liabilities | | (369) | | | Net asset (liability) | | | $ | (3,305) | | | | | $ | (3,581) | |
The table below summarizes the location and gross amounts of foreign currency forward contract fair values (Level 2) in the condensed consolidated balance sheets as of June 30, 2023 and December 31, 2022: | | | | | | | | | | | | | | | | | | | | | | | | | | | June 30, 2023 | | December 31, 2022 | | (In thousands) | Balance Sheet
Account | | Fair
Value | | Balance Sheet
Account | | | Fair
Value | | Derivatives Designated as Hedging Instruments | | | | | | | | | Asset derivatives: Foreign currency forward contracts | Prepaid expenses and other | | $ | 2,974 | | | Prepaid expenses and other | | | $ | 781 | | | Foreign currency forward contracts | Other assets | | 723 | | | Other assets | | | 33 | | Liability derivatives: Foreign currency forward contracts | Accrued expenses | | — | | | Other non-current liabilities | | | (3) | | | Net asset (liability) | | | $ | 3,697 | | | | | | $ | 811 | |
|
| Schedule Of Pretax Effect On Net Income (Loss) And Other Comprehensive Income (Loss) Of Derivative Instruments Classified As Cash Flow Hedges |
The pre-tax effect on net income (loss) and other comprehensive income (loss) of derivative instruments classified as cash flow hedges and described in the previous paragraphs for the three and six month periods ended June 30, 2023 and 2022 is summarized in the table below: | | | | | | | | | | | | | | | | | | | | | | | | | | | | | | | | | | Cash Flow Derivative Hedges | | | Three Months Ended June 30, | | | Aluminum Futures Contracts | | Foreign Currency Forwards | | (In thousands) | 2023 | | 2022 | | 2023 | | 2022 | | Amount of pre-tax gain (loss) recognized in other comprehensive income (loss) | $ | 557 | | | $ | (9,923) | | | $ | — | | $ | 1,931 | | | $ | — | | | $ | (1,758) | | | Location of gain (loss) reclassified from accumulated other comprehensive income (loss) into net income (effective portion) | Cost of goods sold | | Cost of goods sold | | Cost of goods sold | Selling, general & admin | | Cost of goods sold | | Selling, general & admin | | Amount of pre-tax gain (loss) reclassified from accumulated other comprehensive income (loss) to net income (effective portion) | $ | 885 | | | $ | 293 | | | $ | 15 | | $ | 721 | | | $ | 15 | | | $ | 532 | | | | Six Months Ended June 30, | | | Aluminum Futures Contracts | | Foreign Currency Forwards | | | 2023 | | 2022 | | 2023 | | 2022 | | Amount of pre-tax gain (loss) recognized in other comprehensive income (loss) | $ | 1,959 | | | $ | (3,741) | | | $ | — | | $ | 3,606 | | | $ | — | | | $ | 2,063 | | | Location of gain (loss) reclassified from accumulated other comprehensive income (loss) into net income (effective portion) | Cost of goods sold | | Cost of goods sold | | Cost of goods sold | Selling, general & admin | | Cost of goods sold | | Selling, general & admin | | Amount of pre-tax gain (loss) reclassified from accumulated other comprehensive income (loss) to net income (effective portion) | $ | 1,557 | | | $ | 1,298 | | | $ | 30 | | $ | 1,007 | | | $ | 30 | | | $ | 669 | |
|
| X |
- DefinitionTabular disclosure of the effective portion of the gains and losses on derivative instruments designated (and non-derivative instruments) designated and qualifying in cash flow hedges and net investment hedges that was recognized in other comprehensive income (loss) during the current period. Reference 1: http://fasb.org/us-gaap/role/ref/legacyRef
-Name Accounting Standards Codification
-Topic 815
-SubTopic 10
-Section 50
-Paragraph 4C
-Subparagraph (b)
-Publisher FASB
-URI https://asc.fasb.org//1943274/2147480434/815-10-50-4C
| Name: |
us-gaap_ScheduleOfDerivativeInstrumentsEffectOnOtherComprehensiveIncomeLossTableTextBlock |
| Namespace Prefix: |
us-gaap_ |
| Data Type: |
dtr-types:textBlockItemType |
| Balance Type: |
na |
| Period Type: |
duration |
|
| X |
- DefinitionTabular disclosure of the location and fair value amounts of derivative instruments (and nonderivative instruments that are designated and qualify as hedging instruments) reported in the statement of financial position. Reference 1: http://fasb.org/us-gaap/role/ref/legacyRef
-Name Accounting Standards Codification
-Topic 815
-SubTopic 10
-Section 50
-Paragraph 4B
-Publisher FASB
-URI https://asc.fasb.org//1943274/2147480434/815-10-50-4B
| Name: |
us-gaap_ScheduleOfDerivativeInstrumentsInStatementOfFinancialPositionFairValueTextBlock |
| Namespace Prefix: |
us-gaap_ |
| Data Type: |
dtr-types:textBlockItemType |
| Balance Type: |
na |
| Period Type: |
duration |
|
| X |
- DefinitionTabular disclosure of pertinent information about a derivative or group of derivatives on a disaggregated basis, such as for individual instruments, or small groups of similar instruments. May include a combination of the type of instrument, risks being hedged, notional amount, hedge designation, related hedged item, inception date, maturity date, or other relevant item. Reference 1: http://fasb.org/us-gaap/role/ref/legacyRef
-Name Accounting Standards Codification
-Section 50
-Paragraph 2
-SubTopic 10
-Topic 815
-Publisher FASB
-URI https://asc.fasb.org//1943274/2147480434/815-10-50-2
Reference 2: http://fasb.org/us-gaap/role/ref/legacyRef
-Name Accounting Standards Codification
-Topic 815
-SubTopic 10
-Section 50
-Paragraph 1A
-Publisher FASB
-URI https://asc.fasb.org//1943274/2147480434/815-10-50-1A
Reference 3: http://fasb.org/us-gaap/role/ref/legacyRef
-Name Accounting Standards Codification
-Topic 815
-SubTopic 10
-Section 50
-Paragraph 1B
-Publisher FASB
-URI https://asc.fasb.org//1943274/2147480434/815-10-50-1B
Reference 4: http://fasb.org/us-gaap/role/ref/legacyRef
-Name Accounting Standards Codification
-Topic 815
-SubTopic 10
-Section 50
-Paragraph 8
-Publisher FASB
-URI https://asc.fasb.org//1943274/2147480434/815-10-50-8
Reference 5: http://fasb.org/us-gaap/role/ref/legacyRef
-Name Accounting Standards Codification
-Topic 815
-SubTopic 10
-Section 50
-Paragraph 4B
-Publisher FASB
-URI https://asc.fasb.org//1943274/2147480434/815-10-50-4B
Reference 6: http://fasb.org/us-gaap/role/ref/legacyRef
-Name Accounting Standards Codification
-Topic 815
-SubTopic 10
-Section 50
-Paragraph 1
-Publisher FASB
-URI https://asc.fasb.org//1943274/2147480434/815-10-50-1
Reference 7: http://fasb.org/us-gaap/role/ref/legacyRef
-Name Accounting Standards Codification
-Topic 815
-SubTopic 10
-Section 50
-Paragraph 4
-Publisher FASB
-URI https://asc.fasb.org//1943274/2147480434/815-10-50-4
Reference 8: http://fasb.org/us-gaap/role/ref/legacyRef
-Name Accounting Standards Codification
-Topic 815
-SubTopic 10
-Section 50
-Paragraph 5
-Publisher FASB
-URI https://asc.fasb.org//1943274/2147480434/815-10-50-5
Reference 9: http://fasb.org/us-gaap/role/ref/legacyRef
-Name Accounting Standards Codification
-Topic 815
-SubTopic 10
-Section 50
-Paragraph 4C
-Publisher FASB
-URI https://asc.fasb.org//1943274/2147480434/815-10-50-4C
| Name: |
us-gaap_ScheduleOfDerivativeInstrumentsTextBlock |
| Namespace Prefix: |
us-gaap_ |
| Data Type: |
dtr-types:textBlockItemType |
| Balance Type: |
na |
| Period Type: |
duration |
|
| X |
- References
+ Details
| Name: |
us-gaap_SummaryOfDerivativeInstrumentsAbstract |
| Namespace Prefix: |
us-gaap_ |
| Data Type: |
xbrli:stringItemType |
| Balance Type: |
na |
| Period Type: |
duration |
|
v3.23.2
Segment Reporting (Tables)
|
6 Months Ended |
Jun. 30, 2023 |
|---|
| Segment Reporting [Abstract] |
|
| Schedule Of Segment Reporting Information By Segment |
The following table presents net sales and EBITDA from ongoing operations by segment for the three and six months ended June 30, 2023 and 2022: | | | | | | | | | | | | | | | | | | | | | | | | | Three Months Ended June 30, | | Six Months Ended June 30, | | (In thousands) | 2023 | | 2022 | | 2023 | | 2022 | | Net Sales | | | | | | | | | Aluminum Extrusions | $ | 121,827 | | | $ | 190,308 | | | $ | 255,197 | | | $ | 348,417 | | | PE Films | 15,918 | | | 31,424 | | | 36,099 | | | 62,555 | | | Flexible Packaging Films | 33,223 | | | 41,595 | | | 64,750 | | | 80,839 | | | Total net sales | 170,968 | | | 263,327 | | | 356,046 | | | 491,811 | | | Add back freight | 7,199 | | | 11,036 | | | 13,243 | | | 19,118 | | | Sales as shown in the condensed consolidated statements of income (loss) | $ | 178,167 | | | $ | 274,363 | | | $ | 369,289 | | | $ | 510,929 | | | EBITDA from Ongoing Operations | | | | | | | | | Aluminum Extrusions: | | | | | | | | | Ongoing operations: | | | | | | | | | EBITDA | $ | 10,217 | | | $ | 21,895 | | | $ | 24,855 | | | $ | 45,814 | | | Depreciation & amortization | (4,158) | | | (4,169) | | | (8,569) | | | (8,430) | | | EBIT | 6,059 | | | 17,726 | | | 16,286 | | | 37,384 | | | Plant shutdowns, asset impairments, restructurings and other | 155 | | | 16 | | | (339) | | | (89) | | | PE Films: | | | | | | | | | Ongoing operations: | | | | | | | | | EBITDA | 814 | | | 7,065 | | | 2,663 | | | 14,112 | | | Depreciation & amortization | (1,552) | | | (1,559) | | | (3,195) | | | (3,154) | | | EBIT | (738) | | | 5,506 | | | (532) | | | 10,958 | | | Plant shutdowns, asset impairments, restructurings and other | — | | | (50) | | | 2 | | | (153) | | | Goodwill impairment | (15,413) | | | — | | | (15,413) | | | — | | | Flexible Packaging Films: | | | | | | | | | Ongoing operations: | | | | | | | | | EBITDA | 249 | | | 7,631 | | | 1,599 | | | 12,665 | | | Depreciation & amortization | (711) | | | (583) | | | (1,411) | | | (1,132) | | | EBIT | (462) | | | 7,048 | | | 188 | | | 11,533 | | | Plant shutdowns, asset impairments, restructurings and other | (1) | | | (37) | | | (79) | | | (80) | | | Total | (10,400) | | | 30,209 | | | 113 | | | 59,553 | | | Interest income | 30 | | | 3 | | | 74 | | | 32 | | | Interest expense | 2,374 | | | 1,234 | | | 4,686 | | | 2,020 | | | Gain on investment in kaléo | — | | | 1,406 | | | 262 | | | 1,406 | | | Stock option-based compensation costs | — | | | 251 | | | 231 | | | 882 | | | Corporate expenses, net | 9,509 | | | 9,708 | | | 18,466 | | | 20,463 | | | Income (loss) before income taxes | (22,253) | | | 20,425 | | | (22,934) | | | 37,626 | | | Income tax expense (benefit) | (3,331) | | | 5,556 | | | (3,000) | | | 6,334 | | | Net income (loss) | $ | (18,922) | | | $ | 14,869 | | | $ | (19,934) | | | $ | 31,292 | |
|
| Schedule Of Identifiable Assets By Segment |
The following table presents identifiable assets by segment at June 30, 2023 and December 31, 2022: | | | | | | | | | | | | | (In thousands) | June 30, 2023 | | December 31, 2022 | | Aluminum Extrusions | $ | 266,426 | | | $ | 293,308 | | | PE Films | 82,191 | | | 102,431 | | | Flexible Packaging Films | 91,568 | | | 103,448 | | | Subtotal | 440,185 | | | 499,187 | | | General corporate | 23,491 | | | 23,674 | | | Cash and cash equivalents | 21,193 | | | 19,232 | | | Total | $ | 484,869 | | | $ | 542,093 | |
|
| Disaggregation of Revenue [Table Text Block] |
The following tables disaggregate the Company’s revenue by geographic area and product group for the three and six months ended June 30, 2023 and 2022: | | | | | | | | | | | | | | | | | | | | | | | | | Net Sales by Geographic Area (a) | | Three Months Ended June 30, | | Six Months Ended June 30, | | (In thousands) | 2023 | | 2022 | | 2023 | | 2022 | | United States | $ | 133,417 | | | $ | 213,955 | | | $ | 284,027 | | | $ | 396,092 | | | Exports from the United States to: | | | | | | | | | Asia | 5,477 | | | 14,680 | | | 11,209 | | | 27,145 | | | Latin America | 1,817 | | | 1,245 | | | 3,676 | | | 2,686 | | | Canada | 4,955 | | | 4,173 | | | 9,239 | | | 8,366 | | | Europe | 272 | | | 1,085 | | | 1,132 | | | 2,448 | | | Operations outside the United States: | | | | | | | | | Brazil | 24,975 | | | 28,189 | | | 46,603 | | | 55,074 | | | Asia | 55 | | | — | | | 160 | | | — | | | Total | $ | 170,968 | | | $ | 263,327 | | | $ | 356,046 | | | $ | 491,811 | | (a) Export sales relate mostly to PE Films. Operations in Brazil relate to Flexible Packaging Films. |
The Company’s facilities in Pottsville, PA (“PV”) and Guangzhou, China (“GZ”) have a tolling arrangement whereby certain surface protection films are manufactured in GZ for a fee with raw materials supplied from PV that are then shipped by GZ directly to customers principally in the Asian market, but paid by customers directly to PV. Amounts associated with this intercompany tolling arrangement are reported in the table above as export sales from the U.S. to Asia, and include net sales of $3.4 million and $5.3 million in the second quarter of 2023 and 2022, respectively, and $6.8 million and $11.7 million in the first six months of 2023 and 2022, respectively. | | | | | | | | | | | | | | | | | | | | | | | | | Net Sales by Product Group | | Three Months Ended June 30, | | Six Months Ended June 30, | | (In thousands) | 2023 | | 2022 | | 2023 | | 2022 | | Aluminum Extrusions: | | | | | | | | | Nonresidential building & construction | $ | 65,784 | | | $ | 99,302 | | | $ | 144,413 | | | $ | 180,223 | | | Consumer durables | 11,714 | | | 18,805 | | | 22,061 | | | 35,695 | | | Automotive | 11,769 | | | 14,473 | | | 23,891 | | | 28,314 | | | Residential building & construction | 10,056 | | | 20,948 | | | 21,659 | | | 37,413 | | | Electrical | 6,078 | | | 9,687 | | | 14,207 | | | 16,974 | | | Machinery & equipment | 11,082 | | | 15,929 | | | 21,806 | | | 28,874 | | | Distribution | 5,344 | | | 11,164 | | | 7,160 | | | 20,924 | | | Subtotal | 121,827 | | | 190,308 | | | 255,197 | | | 348,417 | | | PE Films: | | | | | | | | | Surface protection films | 8,643 | | | 23,674 | | | 21,497 | | | 45,822 | | | Overwrap packaging | 7,275 | | | 7,750 | | | 14,602 | | | 16,733 | | | Subtotal | 15,918 | | | 31,424 | | | 36,099 | | | 62,555 | | | Flexible Packaging Films | 33,223 | | | 41,595 | | | 64,750 | | | 80,839 | | | Total | $ | 170,968 | | | $ | 263,327 | | | $ | 356,046 | | | $ | 491,811 | |
|
| X |
- DefinitionSchedule of identifiable assets by segment.
| Name: |
tg_ScheduleOfIdentifiableAssetsBySegmentTableTextBlock |
| Namespace Prefix: |
tg_ |
| Data Type: |
dtr-types1:textBlockItemType |
| Balance Type: |
na |
| Period Type: |
duration |
|
| X |
- DefinitionTabular disclosure of disaggregation of revenue into categories depicting how nature, amount, timing, and uncertainty of revenue and cash flows are affected by economic factor. Reference 1: http://www.xbrl.org/2009/role/commonPracticeRef
-Topic 606
-SubTopic 10
-Name Accounting Standards Codification
-Section 50
-Paragraph 5
-Publisher FASB
-URI https://asc.fasb.org//1943274/2147479806/606-10-50-5
| Name: |
us-gaap_DisaggregationOfRevenueTableTextBlock |
| Namespace Prefix: |
us-gaap_ |
| Data Type: |
dtr-types:textBlockItemType |
| Balance Type: |
na |
| Period Type: |
duration |
|
| X |
- DefinitionTabular disclosure of the profit or loss and total assets for each reportable segment. An entity discloses certain information on each reportable segment if the amounts (a) are included in the measure of segment profit or loss reviewed by the chief operating decision maker or (b) are otherwise regularly provided to the chief operating decision maker, even if not included in that measure of segment profit or loss. Reference 1: http://fasb.org/us-gaap/role/ref/legacyRef
-Name Accounting Standards Codification
-Topic 350
-SubTopic 20
-Section 50
-Paragraph 1
-Publisher FASB
-URI https://asc.fasb.org//1943274/2147482573/350-20-50-1
Reference 2: http://fasb.org/us-gaap/role/ref/legacyRef
-Name Accounting Standards Codification
-Topic 280
-SubTopic 10
-Section 50
-Paragraph 25
-Publisher FASB
-URI https://asc.fasb.org//1943274/2147482810/280-10-50-25
Reference 3: http://fasb.org/us-gaap/role/ref/legacyRef
-Name Accounting Standards Codification
-Topic 280
-SubTopic 10
-Section 50
-Paragraph 22
-Publisher FASB
-URI https://asc.fasb.org//1943274/2147482810/280-10-50-22
Reference 4: http://fasb.org/us-gaap/role/ref/legacyRef
-Name Accounting Standards Codification
-Topic 280
-SubTopic 10
-Section 50
-Paragraph 30
-Publisher FASB
-URI https://asc.fasb.org//1943274/2147482810/280-10-50-30
| Name: |
us-gaap_ScheduleOfSegmentReportingInformationBySegmentTextBlock |
| Namespace Prefix: |
us-gaap_ |
| Data Type: |
dtr-types:textBlockItemType |
| Balance Type: |
na |
| Period Type: |
duration |
|
| X |
- References
+ Details
| Name: |
us-gaap_SegmentReportingAbstract |
| Namespace Prefix: |
us-gaap_ |
| Data Type: |
xbrli:stringItemType |
| Balance Type: |
na |
| Period Type: |
duration |
|
v3.23.2
Basis Of Presentation (Details) - USD ($)
$ in Thousands |
3 Months Ended |
6 Months Ended |
|
Jun. 30, 2023 |
Jun. 30, 2022 |
Jun. 30, 2023 |
Jun. 30, 2022 |
Dec. 31, 2022 |
| Accounts, Notes, Loans and Financing Receivable [Line Items] |
|
|
|
|
|
| Goodwill, Impairment Loss |
$ 15,413
|
$ 0
|
$ 15,413
|
$ 0
|
|
| Goodwill |
55,195
|
|
55,195
|
|
$ 70,608
|
| Surface Protection Films [Member] |
|
|
|
|
|
| Accounts, Notes, Loans and Financing Receivable [Line Items] |
|
|
|
|
|
| Goodwill, Impairment Loss |
15,400
|
|
|
|
|
| Goodwill, Impairment Loss, Net of Tax |
11,900
|
|
|
|
|
| Goodwill |
$ 41,900
|
|
$ 41,900
|
|
$ 57,300
|
| X |
- DefinitionLine items represent financial concepts included in a table. These concepts are used to disclose reportable information associated with domain members defined in one or many axes to the table.
| Name: |
us-gaap_AccountsNotesAndLoansReceivableLineItems |
| Namespace Prefix: |
us-gaap_ |
| Data Type: |
xbrli:stringItemType |
| Balance Type: |
na |
| Period Type: |
duration |
|
| X |
- DefinitionAmount after accumulated impairment loss of an asset representing future economic benefits arising from other assets acquired in a business combination that are not individually identified and separately recognized. Reference 1: http://www.xbrl.org/2003/role/exampleRef
-Topic 852
-SubTopic 10
-Name Accounting Standards Codification
-Section 55
-Paragraph 10
-Publisher FASB
-URI https://asc.fasb.org//1943274/2147481372/852-10-55-10
Reference 2: http://www.xbrl.org/2003/role/exampleRef
-Topic 350
-SubTopic 20
-Name Accounting Standards Codification
-Section 55
-Paragraph 24
-Publisher FASB
-URI https://asc.fasb.org//1943274/2147482548/350-20-55-24
Reference 3: http://www.xbrl.org/2003/role/disclosureRef
-Topic 210
-SubTopic 10
-Name Accounting Standards Codification
-Section S99
-Paragraph 1
-Subparagraph (SX 210.5-02(15))
-Publisher FASB
-URI https://asc.fasb.org//1943274/2147480566/210-10-S99-1
Reference 4: http://www.xbrl.org/2003/role/disclosureRef
-Topic 350
-SubTopic 20
-Name Accounting Standards Codification
-Section 45
-Paragraph 1
-Publisher FASB
-URI https://asc.fasb.org//1943274/2147482598/350-20-45-1
Reference 5: http://www.xbrl.org/2009/role/commonPracticeRef
-Topic 350
-SubTopic 20
-Name Accounting Standards Codification
-Section 50
-Paragraph 1
-Subparagraph (a)
-Publisher FASB
-URI https://asc.fasb.org//1943274/2147482573/350-20-50-1
Reference 6: http://www.xbrl.org/2009/role/commonPracticeRef
-Topic 350
-SubTopic 20
-Name Accounting Standards Codification
-Section 50
-Paragraph 1
-Subparagraph (h)
-Publisher FASB
-URI https://asc.fasb.org//1943274/2147482573/350-20-50-1
Reference 7: http://www.xbrl.org/2003/role/disclosureRef
-Topic 942
-SubTopic 210
-Name Accounting Standards Codification
-Section S99
-Paragraph 1
-Subparagraph (SX 210.9-03(10)(1))
-Publisher FASB
-URI https://asc.fasb.org//1943274/2147479853/942-210-S99-1
| Name: |
us-gaap_Goodwill |
| Namespace Prefix: |
us-gaap_ |
| Data Type: |
xbrli:monetaryItemType |
| Balance Type: |
debit |
| Period Type: |
instant |
|
| X |
- DefinitionAmount of loss from the write-down of an asset representing the future economic benefits arising from other assets acquired in a business combination that are not individually identified and separately recognized. Reference 1: http://fasb.org/us-gaap/role/ref/legacyRef
-Name Accounting Standards Codification
-Section 45
-Paragraph 28
-Subparagraph (b)
-SubTopic 10
-Topic 230
-Publisher FASB
-URI https://asc.fasb.org//1943274/2147482740/230-10-45-28
Reference 2: http://www.xbrl.org/2003/role/exampleRef
-Topic 350
-SubTopic 20
-Name Accounting Standards Codification
-Section 55
-Paragraph 24
-Publisher FASB
-URI https://asc.fasb.org//1943274/2147482548/350-20-55-24
Reference 3: http://www.xbrl.org/2003/role/disclosureRef
-Topic 350
-SubTopic 20
-Name Accounting Standards Codification
-Section 50
-Paragraph 1
-Subparagraph (e)
-Publisher FASB
-URI https://asc.fasb.org//1943274/2147482573/350-20-50-1
Reference 4: http://www.xbrl.org/2003/role/disclosureRef
-Topic 350
-SubTopic 20
-Name Accounting Standards Codification
-Section 50
-Paragraph 2
-Subparagraph (b)
-Publisher FASB
-URI https://asc.fasb.org//1943274/2147482573/350-20-50-2
Reference 5: http://www.xbrl.org/2003/role/disclosureRef
-Topic 350
-SubTopic 20
-Name Accounting Standards Codification
-Section 45
-Paragraph 2
-Publisher FASB
-URI https://asc.fasb.org//1943274/2147482598/350-20-45-2
| Name: |
us-gaap_GoodwillImpairmentLoss |
| Namespace Prefix: |
us-gaap_ |
| Data Type: |
xbrli:monetaryItemType |
| Balance Type: |
debit |
| Period Type: |
duration |
|
| X |
- DefinitionAmount after tax of loss recognized that results from the write-down of an asset representing the future economic benefits arising from other assets acquired in a business combination that are not individually identified and separately recognized.
| Name: |
us-gaap_GoodwillImpairmentLossNetOfTax |
| Namespace Prefix: |
us-gaap_ |
| Data Type: |
xbrli:monetaryItemType |
| Balance Type: |
debit |
| Period Type: |
duration |
|
| X |
- Details
| Name: |
dei_LegalEntityAxis=tg_SurfaceProtectionFilmsMember |
| Namespace Prefix: |
|
| Data Type: |
na |
| Balance Type: |
|
| Period Type: |
|
|
v3.23.2
Accounts and Other Receivables (Details) - USD ($)
$ in Thousands |
Jun. 30, 2023 |
Dec. 31, 2022 |
| Receivables [Abstract] |
|
|
| Accounts Receivable, before Allowance for Credit Loss, Current |
$ 79,112
|
$ 83,667
|
| Other Receivables, Gross, Current |
2,233
|
3,874
|
| Accounts Receivable, before Allowance for Credit Loss |
81,345
|
87,541
|
| Accounts Receivable, Allowance for Credit Loss |
(2,206)
|
(2,997)
|
| Accounts and other receivables, net |
$ 79,139
|
$ 84,544
|
| X |
- DefinitionAmount, before allowance for credit loss, of right to consideration from customer for product sold and service rendered in normal course of business. Reference 1: http://www.xbrl.org/2009/role/commonPracticeRef
-Topic 944
-SubTopic 210
-Name Accounting Standards Codification
-Section S99
-Paragraph 1
-Subparagraph (SX 210.7-03(a)(5))
-Publisher FASB
-URI https://asc.fasb.org//1943274/2147479440/944-210-S99-1
Reference 2: http://www.xbrl.org/2003/role/disclosureRef
-Topic 210
-SubTopic 10
-Name Accounting Standards Codification
-Section S99
-Paragraph 1
-Subparagraph (SX 210.5-02(3)(a)(1))
-Publisher FASB
-URI https://asc.fasb.org//1943274/2147480566/210-10-S99-1
Reference 3: http://www.xbrl.org/2003/role/disclosureRef
-Topic 310
-SubTopic 10
-Name Accounting Standards Codification
-Section 45
-Paragraph 2
-Publisher FASB
-URI https://asc.fasb.org//1943274/2147481990/310-10-45-2
| Name: |
us-gaap_AccountsReceivableGross |
| Namespace Prefix: |
us-gaap_ |
| Data Type: |
xbrli:monetaryItemType |
| Balance Type: |
debit |
| Period Type: |
instant |
|
| X |
- DefinitionAmount, before allowance for credit loss, of right to consideration from customer for product sold and service rendered in normal course of business, classified as current. Reference 1: http://www.xbrl.org/2003/role/disclosureRef
-Topic 210
-SubTopic 10
-Name Accounting Standards Codification
-Section S99
-Paragraph 1
-Subparagraph (SX 210.5-02(3)(a)(1))
-Publisher FASB
-URI https://asc.fasb.org//1943274/2147480566/210-10-S99-1
Reference 2: http://www.xbrl.org/2003/role/exampleRef
-Topic 210
-SubTopic 10
-Name Accounting Standards Codification
-Section 45
-Paragraph 1
-Subparagraph (c)
-Publisher FASB
-URI https://asc.fasb.org//1943274/2147483467/210-10-45-1
Reference 3: http://www.xbrl.org/2003/role/disclosureRef
-Topic 310
-SubTopic 10
-Name Accounting Standards Codification
-Section 45
-Paragraph 2
-Publisher FASB
-URI https://asc.fasb.org//1943274/2147481990/310-10-45-2
Reference 4: http://www.xbrl.org/2003/role/disclosureRef
-Topic 310
-SubTopic 10
-Name Accounting Standards Codification
-Section 45
-Paragraph 9
-Publisher FASB
-URI https://asc.fasb.org//1943274/2147481990/310-10-45-9
| Name: |
us-gaap_AccountsReceivableGrossCurrent |
| Namespace Prefix: |
us-gaap_ |
| Data Type: |
xbrli:monetaryItemType |
| Balance Type: |
debit |
| Period Type: |
instant |
|
| X |
- DefinitionAmount, after allowance for credit loss, of right to consideration from customer for product sold and service rendered in normal course of business. Reference 1: http://www.xbrl.org/2003/role/exampleRef
-Topic 946
-SubTopic 310
-Name Accounting Standards Codification
-Section 45
-Paragraph 1
-Subparagraph (d)
-Publisher FASB
-URI https://asc.fasb.org//1943274/2147480833/946-310-45-1
Reference 2: http://www.xbrl.org/2009/role/commonPracticeRef
-Topic 944
-SubTopic 210
-Name Accounting Standards Codification
-Section S99
-Paragraph 1
-Subparagraph (SX 210.7-03(a)(5))
-Publisher FASB
-URI https://asc.fasb.org//1943274/2147479440/944-210-S99-1
Reference 3: http://www.xbrl.org/2003/role/disclosureRef
-Topic 946
-SubTopic 210
-Name Accounting Standards Codification
-Section S99
-Paragraph 1
-Subparagraph (SX 210.6-04(5)(b))
-Publisher FASB
-URI https://asc.fasb.org//1943274/2147479617/946-210-S99-1
Reference 4: http://www.xbrl.org/2003/role/disclosureRef
-Topic 954
-SubTopic 310
-Name Accounting Standards Codification
-Section 45
-Paragraph 1
-Publisher FASB
-URI https://asc.fasb.org//1943274/2147481058/954-310-45-1
| Name: |
us-gaap_AccountsReceivableNet |
| Namespace Prefix: |
us-gaap_ |
| Data Type: |
xbrli:monetaryItemType |
| Balance Type: |
debit |
| Period Type: |
instant |
|
| X |
- DefinitionAmount of allowance for credit loss on accounts receivable. Reference 1: http://www.xbrl.org/2009/role/commonPracticeRef
-Topic 944
-SubTopic 210
-Name Accounting Standards Codification
-Section S99
-Paragraph 1
-Subparagraph (SX 210.7-03(a)(5))
-Publisher FASB
-URI https://asc.fasb.org//1943274/2147479440/944-210-S99-1
Reference 2: http://www.xbrl.org/2003/role/disclosureRef
-Topic 210
-SubTopic 10
-Name Accounting Standards Codification
-Section S99
-Paragraph 1
-Subparagraph (SX 210.5-02(4))
-Publisher FASB
-URI https://asc.fasb.org//1943274/2147480566/210-10-S99-1
Reference 3: http://www.xbrl.org/2003/role/disclosureRef
-Topic 326
-SubTopic 20
-Name Accounting Standards Codification
-Section 45
-Paragraph 1
-Publisher FASB
-URI https://asc.fasb.org//1943274/2147479344/326-20-45-1
Reference 4: http://www.xbrl.org/2003/role/disclosureRef
-Topic 310
-SubTopic 10
-Name Accounting Standards Codification
-Section 50
-Paragraph 4
-Publisher FASB
-URI https://asc.fasb.org//1943274/2147481962/310-10-50-4
Reference 5: http://www.xbrl.org/2003/role/disclosureRef
-Topic 326
-SubTopic 20
-Name Accounting Standards Codification
-Section 50
-Paragraph 13
-Subparagraph (a)
-Publisher FASB
-URI https://asc.fasb.org//1943274/2147479319/326-20-50-13
Reference 6: http://www.xbrl.org/2003/role/disclosureRef
-Topic 326
-SubTopic 20
-Name Accounting Standards Codification
-Section 50
-Paragraph 13
-Subparagraph (f)
-Publisher FASB
-URI https://asc.fasb.org//1943274/2147479319/326-20-50-13
| Name: |
us-gaap_AllowanceForDoubtfulAccountsReceivable |
| Namespace Prefix: |
us-gaap_ |
| Data Type: |
xbrli:monetaryItemType |
| Balance Type: |
credit |
| Period Type: |
instant |
|
| X |
- DefinitionAmount, before allowance, of receivables classified as other, due within one year or the operating cycle, if longer. Reference 1: http://www.xbrl.org/2003/role/disclosureRef
-Topic 210
-SubTopic 10
-Name Accounting Standards Codification
-Section S99
-Paragraph 1
-Subparagraph (SX 210.5-02(3)(a)(4))
-Publisher FASB
-URI https://asc.fasb.org//1943274/2147480566/210-10-S99-1
| Name: |
us-gaap_OtherReceivablesGrossCurrent |
| Namespace Prefix: |
us-gaap_ |
| Data Type: |
xbrli:monetaryItemType |
| Balance Type: |
debit |
| Period Type: |
instant |
|
| X |
- References
+ Details
| Name: |
us-gaap_ReceivablesAbstract |
| Namespace Prefix: |
us-gaap_ |
| Data Type: |
xbrli:stringItemType |
| Balance Type: |
na |
| Period Type: |
duration |
|
v3.23.2
Inventories (Schedule Of Components Of Inventories) (Details) - USD ($)
$ in Thousands |
Jun. 30, 2023 |
Dec. 31, 2022 |
| Inventory, Net [Abstract] |
|
|
| Finished goods |
$ 29,677
|
$ 34,686
|
| Work-in-process |
12,678
|
15,604
|
| Raw materials |
23,897
|
58,262
|
| Stores, supplies and other |
20,440
|
19,219
|
| Inventories |
$ 86,692
|
$ 127,771
|
| X |
- DefinitionCarrying amount, net of valuation reserves and adjustments, as of the balance sheet date of merchandise or goods held by the company that are readily available for sale. Reference 1: http://www.xbrl.org/2003/role/exampleRef
-Topic 210
-SubTopic 10
-Name Accounting Standards Codification
-Section S99
-Paragraph 1
-Subparagraph (SX 210.5-02(6)(a)(1))
-Publisher FASB
-URI https://asc.fasb.org//1943274/2147480566/210-10-S99-1
Reference 2: http://fasb.org/us-gaap/role/ref/legacyRef
-Topic 330
-SubTopic 10
-Name Accounting Standards Codification
-Section S99
-Paragraph 2
-Subparagraph (SAB Topic 5.BB)
-Publisher FASB
-URI https://asc.fasb.org//1943274/2147480581/330-10-S99-2
| Name: |
us-gaap_InventoryFinishedGoodsNetOfReserves |
| Namespace Prefix: |
us-gaap_ |
| Data Type: |
xbrli:monetaryItemType |
| Balance Type: |
debit |
| Period Type: |
instant |
|
| X |
- DefinitionAmount after valuation and LIFO reserves of inventory expected to be sold, or consumed within one year or operating cycle, if longer. Reference 1: http://www.xbrl.org/2003/role/exampleRef
-Topic 852
-SubTopic 10
-Name Accounting Standards Codification
-Section 55
-Paragraph 10
-Publisher FASB
-URI https://asc.fasb.org//1943274/2147481372/852-10-55-10
Reference 2: http://www.xbrl.org/2003/role/exampleRef
-Topic 210
-SubTopic 10
-Name Accounting Standards Codification
-Section 45
-Paragraph 1
-Subparagraph (b)
-Publisher FASB
-URI https://asc.fasb.org//1943274/2147483467/210-10-45-1
Reference 3: http://www.xbrl.org/2003/role/disclosureRef
-Topic 210
-SubTopic 10
-Name Accounting Standards Codification
-Section S99
-Paragraph 1
-Subparagraph (SX 210.5-02(6))
-Publisher FASB
-URI https://asc.fasb.org//1943274/2147480566/210-10-S99-1
| Name: |
us-gaap_InventoryNet |
| Namespace Prefix: |
us-gaap_ |
| Data Type: |
xbrli:monetaryItemType |
| Balance Type: |
debit |
| Period Type: |
instant |
|
| X |
- References
+ Details
| Name: |
us-gaap_InventoryNetAbstract |
| Namespace Prefix: |
us-gaap_ |
| Data Type: |
xbrli:stringItemType |
| Balance Type: |
na |
| Period Type: |
duration |
|
| X |
- DefinitionCarrying amount, net of valuation reserves and adjustments, as of the balance sheet date of unprocessed items to be consumed in the manufacturing or production process. Reference 1: http://www.xbrl.org/2003/role/exampleRef
-Topic 210
-SubTopic 10
-Name Accounting Standards Codification
-Section S99
-Paragraph 1
-Subparagraph (SX 210.5-02(6)(a)(4))
-Publisher FASB
-URI https://asc.fasb.org//1943274/2147480566/210-10-S99-1
Reference 2: http://fasb.org/us-gaap/role/ref/legacyRef
-Topic 330
-SubTopic 10
-Name Accounting Standards Codification
-Section S99
-Paragraph 2
-Subparagraph (SAB Topic 5.BB)
-Publisher FASB
-URI https://asc.fasb.org//1943274/2147480581/330-10-S99-2
| Name: |
us-gaap_InventoryRawMaterialsNetOfReserves |
| Namespace Prefix: |
us-gaap_ |
| Data Type: |
xbrli:monetaryItemType |
| Balance Type: |
debit |
| Period Type: |
instant |
|
| X |
- DefinitionCarrying amount, net of valuation reserves and adjustments, as of the balance sheet date of products used directly or indirectly in the manufacturing or production process, which may or may not become part of the final product. May also include items used in the storage, presentation or transportation of physical goods. Reference 1: http://www.xbrl.org/2003/role/exampleRef
-Topic 210
-SubTopic 10
-Name Accounting Standards Codification
-Section S99
-Paragraph 1
-Subparagraph (SX 210.5-02(6)(a)(5))
-Publisher FASB
-URI https://asc.fasb.org//1943274/2147480566/210-10-S99-1
Reference 2: http://fasb.org/us-gaap/role/ref/legacyRef
-Name Accounting Standards Codification
-Topic 330
-SubTopic 10
-Section S99
-Paragraph 2
-Subparagraph (SAB TOPIC 5.BB)
-Publisher FASB
-URI https://asc.fasb.org//1943274/2147480581/330-10-S99-2
| Name: |
us-gaap_InventorySuppliesNetOfReserves |
| Namespace Prefix: |
us-gaap_ |
| Data Type: |
xbrli:monetaryItemType |
| Balance Type: |
debit |
| Period Type: |
instant |
|
| X |
- DefinitionAmount before valuation and LIFO reserves of merchandise or goods in the production process expected to be completed within one year or operating cycle, if longer. Reference 1: http://www.xbrl.org/2009/role/commonPracticeRef
-Topic 210
-SubTopic 10
-Name Accounting Standards Codification
-Section S99
-Paragraph 1
-Subparagraph (SX 210.5-02(6)(a)(3))
-Publisher FASB
-URI https://asc.fasb.org//1943274/2147480566/210-10-S99-1
| Name: |
us-gaap_InventoryWorkInProcess |
| Namespace Prefix: |
us-gaap_ |
| Data Type: |
xbrli:monetaryItemType |
| Balance Type: |
debit |
| Period Type: |
instant |
|
v3.23.2
| X |
- DefinitionDefined benefit plan estimated required future employer contributions in current fiscal year.
| Name: |
tg_DefinedBenefitPlanEstimatedRequiredFutureEmployerContributionsInCurrentFiscalYear |
| Namespace Prefix: |
tg_ |
| Data Type: |
xbrli:monetaryItemType |
| Balance Type: |
debit |
| Period Type: |
duration |
|
| X |
- DefinitionAmount of asset (liability), recognized in statement of financial position, for defined benefit pension and other postretirement plans. Reference 1: http://fasb.org/us-gaap/role/ref/legacyRef
-Name Accounting Standards Codification
-Topic 715
-SubTopic 20
-Section 45
-Paragraph 2
-Publisher FASB
-URI https://asc.fasb.org//1943274/2147480535/715-20-45-2
Reference 2: http://fasb.org/us-gaap/role/ref/legacyRef
-Name Accounting Standards Codification
-Topic 715
-SubTopic 20
-Section 50
-Paragraph 1
-Subparagraph (c)
-Publisher FASB
-URI https://asc.fasb.org//1943274/2147480506/715-20-50-1
| Name: |
us-gaap_DefinedBenefitPlanAmountsRecognizedInBalanceSheet |
| Namespace Prefix: |
us-gaap_ |
| Data Type: |
xbrli:monetaryItemType |
| Balance Type: |
debit |
| Period Type: |
instant |
|
| X |
- DefinitionAmount of contribution received by defined benefit plan from employer which increases plan assets. Reference 1: http://www.xbrl.org/2003/role/exampleRef
-Topic 715
-SubTopic 20
-Name Accounting Standards Codification
-Section 55
-Paragraph 17
-Publisher FASB
-URI https://asc.fasb.org//1943274/2147480482/715-20-55-17
Reference 2: http://www.xbrl.org/2003/role/disclosureRef
-Topic 715
-SubTopic 20
-Name Accounting Standards Codification
-Section 50
-Paragraph 1
-Subparagraph (d)(iv)(01)
-Publisher FASB
-URI https://asc.fasb.org//1943274/2147480506/715-20-50-1
Reference 3: http://www.xbrl.org/2003/role/exampleRef
-Topic 715
-SubTopic 20
-Name Accounting Standards Codification
-Section 55
-Paragraph 18
-Publisher FASB
-URI https://asc.fasb.org//1943274/2147480482/715-20-55-18
Reference 4: http://www.xbrl.org/2003/role/disclosureRef
-Topic 715
-SubTopic 20
-Name Accounting Standards Codification
-Section 50
-Paragraph 6
-Subparagraph (b)
-Publisher FASB
-URI https://asc.fasb.org//1943274/2147480506/715-20-50-6
Reference 5: http://www.xbrl.org/2003/role/disclosureRef
-Topic 715
-SubTopic 20
-Name Accounting Standards Codification
-Section 50
-Paragraph 1
-Subparagraph (b)(3)
-Publisher FASB
-URI https://asc.fasb.org//1943274/2147480506/715-20-50-1
Reference 6: http://www.xbrl.org/2003/role/exampleRef
-Topic 715
-SubTopic 20
-Name Accounting Standards Codification
-Section 50
-Paragraph 1
-Subparagraph (d)(ii)
-Publisher FASB
-URI https://asc.fasb.org//1943274/2147480506/715-20-50-1
Reference 7: http://www.xbrl.org/2003/role/exampleRef
-Topic 715
-SubTopic 20
-Name Accounting Standards Codification
-Section 50
-Paragraph 1
-Subparagraph (d)(iv)(01)
-Publisher FASB
-URI https://asc.fasb.org//1943274/2147480506/715-20-50-1
| Name: |
us-gaap_DefinedBenefitPlanContributionsByEmployer |
| Namespace Prefix: |
us-gaap_ |
| Data Type: |
xbrli:monetaryItemType |
| Balance Type: |
debit |
| Period Type: |
duration |
|
| X |
- DefinitionLine items represent financial concepts included in a table. These concepts are used to disclose reportable information associated with domain members defined in one or many axes to the table.
| Name: |
us-gaap_DefinedBenefitPlanDisclosureLineItems |
| Namespace Prefix: |
us-gaap_ |
| Data Type: |
xbrli:stringItemType |
| Balance Type: |
na |
| Period Type: |
duration |
|
| X |
- DefinitionAmount of liability, recognized in statement of financial position, for defined benefit pension and other postretirement plans, classified as current. Reference 1: http://fasb.org/us-gaap/role/ref/legacyRef
-Topic 210
-SubTopic 10
-Name Accounting Standards Codification
-Section S99
-Paragraph 1
-Subparagraph (SX 210.5-02(20))
-Publisher FASB
-URI https://asc.fasb.org//1943274/2147480566/210-10-S99-1
Reference 2: http://www.xbrl.org/2003/role/exampleRef
-Topic 715
-SubTopic 20
-Name Accounting Standards Codification
-Section 55
-Paragraph 17
-Publisher FASB
-URI https://asc.fasb.org//1943274/2147480482/715-20-55-17
Reference 3: http://www.xbrl.org/2003/role/disclosureRef
-Topic 715
-SubTopic 20
-Name Accounting Standards Codification
-Section 45
-Paragraph 2
-Publisher FASB
-URI https://asc.fasb.org//1943274/2147480535/715-20-45-2
Reference 4: http://www.xbrl.org/2003/role/disclosureRef
-Topic 715
-SubTopic 20
-Name Accounting Standards Codification
-Section 45
-Paragraph 3
-Publisher FASB
-URI https://asc.fasb.org//1943274/2147480535/715-20-45-3
Reference 5: http://www.xbrl.org/2003/role/disclosureRef
-Topic 715
-SubTopic 20
-Name Accounting Standards Codification
-Section 50
-Paragraph 1
-Subparagraph (c)
-Publisher FASB
-URI https://asc.fasb.org//1943274/2147480506/715-20-50-1
| Name: |
us-gaap_PensionAndOtherPostretirementDefinedBenefitPlansCurrentLiabilities |
| Namespace Prefix: |
us-gaap_ |
| Data Type: |
xbrli:monetaryItemType |
| Balance Type: |
credit |
| Period Type: |
instant |
|
| X |
- Details
| Name: |
us-gaap_RetirementPlanTypeAxis=us-gaap_OtherPostretirementBenefitPlansDefinedBenefitMember |
| Namespace Prefix: |
|
| Data Type: |
na |
| Balance Type: |
|
| Period Type: |
|
|
| X |
- Details
| Name: |
us-gaap_RetirementPlanTypeAxis=us-gaap_PensionPlansDefinedBenefitMember |
| Namespace Prefix: |
|
| Data Type: |
na |
| Balance Type: |
|
| Period Type: |
|
|
| X |
- Details
| Name: |
us-gaap_BalanceSheetLocationAxis=tg_AccruedExpensesMember |
| Namespace Prefix: |
|
| Data Type: |
na |
| Balance Type: |
|
| Period Type: |
|
|
v3.23.2
Pension And Other Post-Retirement Benefits (Schedule Of Components Of Net Periodic Benefit Cost For Pension And Other Post-Retirement Benefit Programs) (Details) - USD ($)
$ in Thousands |
3 Months Ended |
6 Months Ended |
Jun. 30, 2023 |
Jun. 30, 2022 |
Jun. 30, 2023 |
Jun. 30, 2022 |
| Pension Benefits |
|
|
|
|
| Defined Benefit Plan Disclosure [Line Items] |
|
|
|
|
| Service cost |
$ 0
|
$ 0
|
$ 0
|
$ 0
|
| Interest cost |
3,028
|
2,225
|
6,056
|
4,450
|
| Expected return on plan assets |
(2,607)
|
(2,043)
|
(5,214)
|
(4,098)
|
| Amortization of prior service costs, (gains) losses and net transition asset |
2,982
|
3,302
|
5,965
|
6,586
|
| Net periodic benefit cost |
3,403
|
3,484
|
6,807
|
6,938
|
| Other Post-Retirement Benefits |
|
|
|
|
| Defined Benefit Plan Disclosure [Line Items] |
|
|
|
|
| Service cost |
3
|
5
|
6
|
10
|
| Interest cost |
71
|
51
|
142
|
102
|
| Expected return on plan assets |
0
|
0
|
0
|
0
|
| Amortization of prior service costs, (gains) losses and net transition asset |
(59)
|
(34)
|
(118)
|
(68)
|
| Net periodic benefit cost |
$ 15
|
$ 22
|
$ 30
|
$ 44
|
| X |
- DefinitionAmortization Of Prior Service Costs And Net Gains Loss
| Name: |
tg_AmortizationOfPriorServiceCostsAndNetGainsLoss |
| Namespace Prefix: |
tg_ |
| Data Type: |
xbrli:monetaryItemType |
| Balance Type: |
credit |
| Period Type: |
duration |
|
| X |
- DefinitionLine items represent financial concepts included in a table. These concepts are used to disclose reportable information associated with domain members defined in one or many axes to the table.
| Name: |
us-gaap_DefinedBenefitPlanDisclosureLineItems |
| Namespace Prefix: |
us-gaap_ |
| Data Type: |
xbrli:stringItemType |
| Balance Type: |
na |
| Period Type: |
duration |
|
| X |
- DefinitionAmount of expected return (loss) recognized in net periodic benefit (cost) credit, calculated based on expected long-term rate of return and market-related value of plan assets of defined benefit plan. Reference 1: http://www.xbrl.org/2003/role/exampleRef
-Topic 715
-SubTopic 20
-Name Accounting Standards Codification
-Section 55
-Paragraph 17
-Publisher FASB
-URI https://asc.fasb.org//1943274/2147480482/715-20-55-17
Reference 2: http://www.xbrl.org/2003/role/disclosureRef
-Topic 715
-SubTopic 20
-Name Accounting Standards Codification
-Section 45
-Paragraph 3A
-Subparagraph (b)
-Publisher FASB
-URI https://asc.fasb.org//1943274/2147480535/715-20-45-3A
Reference 3: http://www.xbrl.org/2003/role/exampleRef
-Topic 715
-SubTopic 20
-Name Accounting Standards Codification
-Section 55
-Paragraph 18
-Publisher FASB
-URI https://asc.fasb.org//1943274/2147480482/715-20-55-18
Reference 4: http://www.xbrl.org/2003/role/disclosureRef
-Topic 715
-SubTopic 20
-Name Accounting Standards Codification
-Section 50
-Paragraph 1
-Subparagraph (h)(3)
-Publisher FASB
-URI https://asc.fasb.org//1943274/2147480506/715-20-50-1
Reference 5: http://www.xbrl.org/2003/role/disclosureRef
-Topic 715
-SubTopic 20
-Name Accounting Standards Codification
-Section 50
-Paragraph 6
-Subparagraph (a)(3)
-Publisher FASB
-URI https://asc.fasb.org//1943274/2147480506/715-20-50-6
| Name: |
us-gaap_DefinedBenefitPlanExpectedReturnOnPlanAssets |
| Namespace Prefix: |
us-gaap_ |
| Data Type: |
xbrli:monetaryItemType |
| Balance Type: |
credit |
| Period Type: |
duration |
|
| X |
- DefinitionAmount of cost recognized for passage of time related to defined benefit plan. Reference 1: http://www.xbrl.org/2003/role/exampleRef
-Topic 715
-SubTopic 20
-Name Accounting Standards Codification
-Section 55
-Paragraph 17
-Publisher FASB
-URI https://asc.fasb.org//1943274/2147480482/715-20-55-17
Reference 2: http://www.xbrl.org/2003/role/disclosureRef
-Topic 715
-SubTopic 20
-Name Accounting Standards Codification
-Section 45
-Paragraph 3A
-Subparagraph (b)
-Publisher FASB
-URI https://asc.fasb.org//1943274/2147480535/715-20-45-3A
Reference 3: http://www.xbrl.org/2003/role/exampleRef
-Topic 715
-SubTopic 20
-Name Accounting Standards Codification
-Section 55
-Paragraph 18
-Publisher FASB
-URI https://asc.fasb.org//1943274/2147480482/715-20-55-18
Reference 4: http://www.xbrl.org/2003/role/disclosureRef
-Topic 715
-SubTopic 20
-Name Accounting Standards Codification
-Section 50
-Paragraph 1
-Subparagraph (a)(2)
-Publisher FASB
-URI https://asc.fasb.org//1943274/2147480506/715-20-50-1
Reference 5: http://www.xbrl.org/2003/role/disclosureRef
-Topic 715
-SubTopic 20
-Name Accounting Standards Codification
-Section 50
-Paragraph 1
-Subparagraph (h)(2)
-Publisher FASB
-URI https://asc.fasb.org//1943274/2147480506/715-20-50-1
Reference 6: http://www.xbrl.org/2003/role/disclosureRef
-Topic 715
-SubTopic 20
-Name Accounting Standards Codification
-Section 50
-Paragraph 6
-Subparagraph (a)(2)
-Publisher FASB
-URI https://asc.fasb.org//1943274/2147480506/715-20-50-6
| Name: |
us-gaap_DefinedBenefitPlanInterestCost |
| Namespace Prefix: |
us-gaap_ |
| Data Type: |
xbrli:monetaryItemType |
| Balance Type: |
debit |
| Period Type: |
duration |
|
| X |
- DefinitionAmount of net periodic benefit cost (credit) for defined benefit plan. Reference 1: http://www.xbrl.org/2003/role/exampleRef
-Topic 715
-SubTopic 20
-Name Accounting Standards Codification
-Section 55
-Paragraph 17
-Publisher FASB
-URI https://asc.fasb.org//1943274/2147480482/715-20-55-17
Reference 2: http://www.xbrl.org/2003/role/exampleRef
-Topic 715
-SubTopic 20
-Name Accounting Standards Codification
-Section 55
-Paragraph 18
-Publisher FASB
-URI https://asc.fasb.org//1943274/2147480482/715-20-55-18
Reference 3: http://www.xbrl.org/2003/role/disclosureRef
-Topic 715
-SubTopic 20
-Name Accounting Standards Codification
-Section 50
-Paragraph 1
-Subparagraph (h)
-Publisher FASB
-URI https://asc.fasb.org//1943274/2147480506/715-20-50-1
Reference 4: http://www.xbrl.org/2003/role/disclosureRef
-Topic 715
-SubTopic 20
-Name Accounting Standards Codification
-Section 50
-Paragraph 6
-Subparagraph (a)
-Publisher FASB
-URI https://asc.fasb.org//1943274/2147480506/715-20-50-6
| Name: |
us-gaap_DefinedBenefitPlanNetPeriodicBenefitCost |
| Namespace Prefix: |
us-gaap_ |
| Data Type: |
xbrli:monetaryItemType |
| Balance Type: |
debit |
| Period Type: |
duration |
|
| X |
- DefinitionAmount of cost for actuarial present value of benefits attributed to service rendered by employee for defined benefit plan. Reference 1: http://www.xbrl.org/2003/role/exampleRef
-Topic 715
-SubTopic 20
-Name Accounting Standards Codification
-Section 55
-Paragraph 17
-Publisher FASB
-URI https://asc.fasb.org//1943274/2147480482/715-20-55-17
Reference 2: http://www.xbrl.org/2003/role/exampleRef
-Topic 715
-SubTopic 20
-Name Accounting Standards Codification
-Section 55
-Paragraph 18
-Publisher FASB
-URI https://asc.fasb.org//1943274/2147480482/715-20-55-18
Reference 3: http://www.xbrl.org/2003/role/disclosureRef
-Topic 715
-SubTopic 20
-Name Accounting Standards Codification
-Section 50
-Paragraph 1
-Subparagraph (a)(1)
-Publisher FASB
-URI https://asc.fasb.org//1943274/2147480506/715-20-50-1
Reference 4: http://www.xbrl.org/2003/role/disclosureRef
-Topic 715
-SubTopic 20
-Name Accounting Standards Codification
-Section 50
-Paragraph 1
-Subparagraph (h)(1)
-Publisher FASB
-URI https://asc.fasb.org//1943274/2147480506/715-20-50-1
Reference 5: http://www.xbrl.org/2003/role/disclosureRef
-Topic 715
-SubTopic 20
-Name Accounting Standards Codification
-Section 50
-Paragraph 6
-Subparagraph (a)(1)
-Publisher FASB
-URI https://asc.fasb.org//1943274/2147480506/715-20-50-6
| Name: |
us-gaap_DefinedBenefitPlanServiceCost |
| Namespace Prefix: |
us-gaap_ |
| Data Type: |
xbrli:monetaryItemType |
| Balance Type: |
debit |
| Period Type: |
duration |
|
| X |
- Details
| Name: |
us-gaap_RetirementPlanTypeAxis=us-gaap_PensionPlansDefinedBenefitMember |
| Namespace Prefix: |
|
| Data Type: |
na |
| Balance Type: |
|
| Period Type: |
|
|
| X |
- Details
| Name: |
us-gaap_RetirementPlanTypeAxis=us-gaap_OtherPostretirementBenefitPlansDefinedBenefitMember |
| Namespace Prefix: |
|
| Data Type: |
na |
| Balance Type: |
|
| Period Type: |
|
|
v3.23.2
Other Income (Expense), Net (Details) - USD ($)
$ in Thousands |
3 Months Ended |
6 Months Ended |
Jun. 30, 2023 |
Mar. 31, 2023 |
Jun. 30, 2022 |
Jun. 30, 2023 |
Jun. 30, 2022 |
| Schedule of Investments [Line Items] |
|
|
|
|
|
| Other Nonoperating Expense |
|
|
$ (96)
|
$ 0
|
$ (308)
|
| Other Nonoperating Income (Expense), Net - Other |
$ (20)
|
|
32
|
(2)
|
(57)
|
| Other income (expense), net |
$ (20)
|
|
1,342
|
260
|
1,041
|
| Proceeds from Sale of Investment Projects |
|
|
|
262
|
1,406
|
| kaleo [Member] |
|
|
|
|
|
| Schedule of Investments [Line Items] |
|
|
|
|
|
| Unrealized Gain (Loss) on Investments - kaleo |
|
$ (300)
|
$ 1,406
|
$ 262
|
$ 1,406
|
| X |
- DefinitionOther Nonoperating Income (Expense), Net - Other
| Name: |
tg_OtherNonoperatingIncomeExpenseNetOther |
| Namespace Prefix: |
tg_ |
| Data Type: |
xbrli:monetaryItemType |
| Balance Type: |
credit |
| Period Type: |
duration |
|
| X |
- DefinitionUnrealized Gain (Loss) on Investments - kaleo
| Name: |
tg_UnrealizedGainLossonInvestmentskaleo |
| Namespace Prefix: |
tg_ |
| Data Type: |
xbrli:monetaryItemType |
| Balance Type: |
debit |
| Period Type: |
duration |
|
| X |
- DefinitionAmount of expense related to nonoperating activities, classified as other. Reference 1: http://fasb.org/us-gaap/role/ref/legacyRef
-Topic 220
-SubTopic 10
-Name Accounting Standards Codification
-Section S99
-Paragraph 2
-Subparagraph (SX 210.5-03.9)
-Publisher FASB
-URI https://asc.fasb.org//1943274/2147483621/220-10-S99-2
| Name: |
us-gaap_OtherNonoperatingExpense |
| Namespace Prefix: |
us-gaap_ |
| Data Type: |
xbrli:monetaryItemType |
| Balance Type: |
debit |
| Period Type: |
duration |
|
| X |
- DefinitionAmount of income (expense) related to nonoperating activities, classified as other. Reference 1: http://fasb.org/us-gaap/role/ref/legacyRef
-Topic 220
-SubTopic 10
-Name Accounting Standards Codification
-Section S99
-Paragraph 2
-Subparagraph (SX 210.5-03.9)
-Publisher FASB
-URI https://asc.fasb.org//1943274/2147483621/220-10-S99-2
| Name: |
us-gaap_OtherNonoperatingIncomeExpense |
| Namespace Prefix: |
us-gaap_ |
| Data Type: |
xbrli:monetaryItemType |
| Balance Type: |
credit |
| Period Type: |
duration |
|
| X |
- DefinitionThe cash inflow from the sale of investment projects held by an entity in hopes of getting a future return or interest from it. Reference 1: http://fasb.org/us-gaap/role/ref/legacyRef
-Name Accounting Standards Codification
-Topic 230
-SubTopic 10
-Section 45
-Paragraph 12
-Publisher FASB
-URI https://asc.fasb.org//1943274/2147482740/230-10-45-12
| Name: |
us-gaap_ProceedsFromSaleOfInvestmentProjects |
| Namespace Prefix: |
us-gaap_ |
| Data Type: |
xbrli:monetaryItemType |
| Balance Type: |
debit |
| Period Type: |
duration |
|
| X |
- DefinitionLine items represent financial concepts included in a table. These concepts are used to disclose reportable information associated with domain members defined in one or many axes to the table. Reference 1: http://www.xbrl.org/2003/role/disclosureRef
-Topic 946
-SubTopic 320
-Name Accounting Standards Codification
-Section S99
-Paragraph 6
-Subparagraph (SX 210.12-14(Column A)(Footnote 1)(b)(1))
-Publisher FASB
-URI https://asc.fasb.org//1943274/2147480032/946-320-S99-6
Reference 2: http://www.xbrl.org/2003/role/disclosureRef
-Topic 946
-SubTopic 320
-Name Accounting Standards Codification
-Section S99
-Paragraph 1
-Subparagraph (SX 210.12-12(Column A)(Footnote 2))
-Publisher FASB
-URI https://asc.fasb.org//1943274/2147480032/946-320-S99-1
Reference 3: http://www.xbrl.org/2003/role/disclosureRef
-Topic 946
-SubTopic 320
-Name Accounting Standards Codification
-Section S99
-Paragraph 6
-Subparagraph (SX 210.12-14(Column A)(Footnote 2))
-Publisher FASB
-URI https://asc.fasb.org//1943274/2147480032/946-320-S99-6
Reference 4: http://www.xbrl.org/2003/role/disclosureRef
-Topic 946
-SubTopic 320
-Name Accounting Standards Codification
-Section S99
-Paragraph 3
-Subparagraph (SX 210.12-12B(Column A)(Footnote 4)(b))
-Publisher FASB
-URI https://asc.fasb.org//1943274/2147480032/946-320-S99-3
Reference 5: http://www.xbrl.org/2003/role/disclosureRef
-Topic 946
-SubTopic 320
-Name Accounting Standards Codification
-Section S99
-Paragraph 1
-Subparagraph (SX 210.12-12(Column A))
-Publisher FASB
-URI https://asc.fasb.org//1943274/2147480032/946-320-S99-1
Reference 6: http://www.xbrl.org/2003/role/disclosureRef
-Topic 946
-SubTopic 320
-Name Accounting Standards Codification
-Section S99
-Paragraph 1
-Subparagraph (SX 210.12-12(Column B))
-Publisher FASB
-URI https://asc.fasb.org//1943274/2147480032/946-320-S99-1
Reference 7: http://www.xbrl.org/2003/role/disclosureRef
-Topic 946
-SubTopic 320
-Name Accounting Standards Codification
-Section S99
-Paragraph 1
-Subparagraph (SX 210.12-12(Column C))
-Publisher FASB
-URI https://asc.fasb.org//1943274/2147480032/946-320-S99-1
Reference 8: http://www.xbrl.org/2003/role/disclosureRef
-Topic 946
-SubTopic 320
-Name Accounting Standards Codification
-Section S99
-Paragraph 1
-Subparagraph (SX 210.12-12(Column A)(Footnote 1))
-Publisher FASB
-URI https://asc.fasb.org//1943274/2147480032/946-320-S99-1
Reference 9: http://www.xbrl.org/2003/role/disclosureRef
-Topic 946
-SubTopic 320
-Name Accounting Standards Codification
-Section S99
-Paragraph 1
-Subparagraph (SX 210.12-12(Column A)(Footnote 2)(i))
-Publisher FASB
-URI https://asc.fasb.org//1943274/2147480032/946-320-S99-1
Reference 10: http://www.xbrl.org/2003/role/disclosureRef
-Topic 946
-SubTopic 320
-Name Accounting Standards Codification
-Section S99
-Paragraph 1
-Subparagraph (SX 210.12-12(Column A)(Footnote 2)(ii))
-Publisher FASB
-URI https://asc.fasb.org//1943274/2147480032/946-320-S99-1
Reference 11: http://www.xbrl.org/2003/role/disclosureRef
-Topic 946
-SubTopic 320
-Name Accounting Standards Codification
-Section S99
-Paragraph 1
-Subparagraph (SX 210.12-12(Column A)(Footnote 4))
-Publisher FASB
-URI https://asc.fasb.org//1943274/2147480032/946-320-S99-1
Reference 12: http://www.xbrl.org/2003/role/disclosureRef
-Topic 946
-SubTopic 320
-Name Accounting Standards Codification
-Section S99
-Paragraph 1
-Subparagraph (SX 210.12-12(Column C)(Footnote 5))
-Publisher FASB
-URI https://asc.fasb.org//1943274/2147480032/946-320-S99-1
Reference 13: http://www.xbrl.org/2003/role/disclosureRef
-Topic 946
-SubTopic 320
-Name Accounting Standards Codification
-Section S99
-Paragraph 1
-Subparagraph (SX 210.12-12(Column C)(Footnote 6))
-Publisher FASB
-URI https://asc.fasb.org//1943274/2147480032/946-320-S99-1
Reference 14: http://www.xbrl.org/2003/role/disclosureRef
-Topic 946
-SubTopic 320
-Name Accounting Standards Codification
-Section S99
-Paragraph 1
-Subparagraph (SX 210.12-12(Column B)(Footnote 7))
-Publisher FASB
-URI https://asc.fasb.org//1943274/2147480032/946-320-S99-1
Reference 15: http://www.xbrl.org/2003/role/disclosureRef
-Topic 946
-SubTopic 320
-Name Accounting Standards Codification
-Section S99
-Paragraph 1
-Subparagraph (SX 210.12-12(Column C)(Footnote 8))
-Publisher FASB
-URI https://asc.fasb.org//1943274/2147480032/946-320-S99-1
Reference 16: http://www.xbrl.org/2003/role/disclosureRef
-Topic 946
-SubTopic 320
-Name Accounting Standards Codification
-Section S99
-Paragraph 1
-Subparagraph (SX 210.12-12(Column C)(Footnote 8)(a)(1))
-Publisher FASB
-URI https://asc.fasb.org//1943274/2147480032/946-320-S99-1
Reference 17: http://www.xbrl.org/2003/role/disclosureRef
-Topic 946
-SubTopic 320
-Name Accounting Standards Codification
-Section S99
-Paragraph 1
-Subparagraph (SX 210.12-12(Column C)(Footnote 8)(a)(2))
-Publisher FASB
-URI https://asc.fasb.org//1943274/2147480032/946-320-S99-1
Reference 18: http://www.xbrl.org/2003/role/disclosureRef
-Topic 946
-SubTopic 320
-Name Accounting Standards Codification
-Section S99
-Paragraph 1
-Subparagraph (SX 210.12-12(Column C)(Footnote 8)(a)(3))
-Publisher FASB
-URI https://asc.fasb.org//1943274/2147480032/946-320-S99-1
Reference 19: http://www.xbrl.org/2003/role/disclosureRef
-Topic 946
-SubTopic 320
-Name Accounting Standards Codification
-Section S99
-Paragraph 1
-Subparagraph (SX 210.12-12(Column C)(Footnote 8)(b)(1))
-Publisher FASB
-URI https://asc.fasb.org//1943274/2147480032/946-320-S99-1
Reference 20: http://www.xbrl.org/2003/role/disclosureRef
-Topic 946
-SubTopic 320
-Name Accounting Standards Codification
-Section S99
-Paragraph 1
-Subparagraph (SX 210.12-12(Column C)(Footnote 8)(b)(2))
-Publisher FASB
-URI https://asc.fasb.org//1943274/2147480032/946-320-S99-1
Reference 21: http://www.xbrl.org/2003/role/disclosureRef
-Topic 946
-SubTopic 320
-Name Accounting Standards Codification
-Section S99
-Paragraph 1
-Subparagraph (SX 210.12-12(Column C)(Footnote 8)(c))
-Publisher FASB
-URI https://asc.fasb.org//1943274/2147480032/946-320-S99-1
Reference 22: http://www.xbrl.org/2003/role/disclosureRef
-Topic 946
-SubTopic 320
-Name Accounting Standards Codification
-Section S99
-Paragraph 1
-Subparagraph (SX 210.12-12(Column C)(Footnote 9))
-Publisher FASB
-URI https://asc.fasb.org//1943274/2147480032/946-320-S99-1
Reference 23: http://www.xbrl.org/2003/role/disclosureRef
-Topic 946
-SubTopic 320
-Name Accounting Standards Codification
-Section S99
-Paragraph 1
-Subparagraph (SX 210.12-12(Column C)(Footnote 10))
-Publisher FASB
-URI https://asc.fasb.org//1943274/2147480032/946-320-S99-1
Reference 24: http://www.xbrl.org/2003/role/disclosureRef
-Topic 946
-SubTopic 320
-Name Accounting Standards Codification
-Section S99
-Paragraph 3
-Subparagraph (SX 210.12-12B(Column A))
-Publisher FASB
-URI https://asc.fasb.org//1943274/2147480032/946-320-S99-3
Reference 25: http://www.xbrl.org/2003/role/disclosureRef
-Topic 946
-SubTopic 320
-Name Accounting Standards Codification
-Section S99
-Paragraph 3
-Subparagraph (SX 210.12-12B(Column B))
-Publisher FASB
-URI https://asc.fasb.org//1943274/2147480032/946-320-S99-3
Reference 26: http://www.xbrl.org/2003/role/disclosureRef
-Topic 946
-SubTopic 320
-Name Accounting Standards Codification
-Section S99
-Paragraph 3
-Subparagraph (SX 210.12-12B(Column C))
-Publisher FASB
-URI https://asc.fasb.org//1943274/2147480032/946-320-S99-3
Reference 27: http://www.xbrl.org/2003/role/disclosureRef
-Topic 946
-SubTopic 320
-Name Accounting Standards Codification
-Section S99
-Paragraph 3
-Subparagraph (SX 210.12-12B(Column D))
-Publisher FASB
-URI https://asc.fasb.org//1943274/2147480032/946-320-S99-3
Reference 28: http://www.xbrl.org/2003/role/disclosureRef
-Topic 946
-SubTopic 320
-Name Accounting Standards Codification
-Section S99
-Paragraph 3
-Subparagraph (SX 210.12-12B(Column A)(Footnote 1)(a))
-Publisher FASB
-URI https://asc.fasb.org//1943274/2147480032/946-320-S99-3
Reference 29: http://www.xbrl.org/2003/role/disclosureRef
-Topic 946
-SubTopic 320
-Name Accounting Standards Codification
-Section S99
-Paragraph 3
-Subparagraph (SX 210.12-12B(Column A)(Footnote 1)(b))
-Publisher FASB
-URI https://asc.fasb.org//1943274/2147480032/946-320-S99-3
Reference 30: http://www.xbrl.org/2003/role/disclosureRef
-Topic 946
-SubTopic 320
-Name Accounting Standards Codification
-Section S99
-Paragraph 3
-Subparagraph (SX 210.12-12B(Column C)(Footnote 2))
-Publisher FASB
-URI https://asc.fasb.org//1943274/2147480032/946-320-S99-3
Reference 31: http://www.xbrl.org/2003/role/disclosureRef
-Topic 946
-SubTopic 320
-Name Accounting Standards Codification
-Section S99
-Paragraph 3
-Subparagraph (SX 210.12-12B(Column A)(Footnote 3))
-Publisher FASB
-URI https://asc.fasb.org//1943274/2147480032/946-320-S99-3
Reference 32: http://www.xbrl.org/2003/role/disclosureRef
-Topic 946
-SubTopic 320
-Name Accounting Standards Codification
-Section S99
-Paragraph 3
-Subparagraph (SX 210.12-12B(Column A)(Footnote 4))
-Publisher FASB
-URI https://asc.fasb.org//1943274/2147480032/946-320-S99-3
Reference 33: http://www.xbrl.org/2003/role/disclosureRef
-Topic 946
-SubTopic 320
-Name Accounting Standards Codification
-Section S99
-Paragraph 3
-Subparagraph (SX 210.12-12B(Column A)(Footnote 4)(a))
-Publisher FASB
-URI https://asc.fasb.org//1943274/2147480032/946-320-S99-3
Reference 34: http://www.xbrl.org/2003/role/disclosureRef
-Topic 946
-SubTopic 320
-Name Accounting Standards Codification
-Section S99
-Paragraph 3
-Subparagraph (SX 210.12-12B(Column A)(Footnote 6))
-Publisher FASB
-URI https://asc.fasb.org//1943274/2147480032/946-320-S99-3
Reference 35: http://www.xbrl.org/2003/role/disclosureRef
-Topic 946
-SubTopic 320
-Name Accounting Standards Codification
-Section S99
-Paragraph 3
-Subparagraph (SX 210.12-12B(Column A)(Footnote 7))
-Publisher FASB
-URI https://asc.fasb.org//1943274/2147480032/946-320-S99-3
Reference 36: http://www.xbrl.org/2003/role/disclosureRef
-Topic 946
-SubTopic 320
-Name Accounting Standards Codification
-Section S99
-Paragraph 3
-Subparagraph (SX 210.12-12B(Column C)(Footnote 9))
-Publisher FASB
-URI https://asc.fasb.org//1943274/2147480032/946-320-S99-3
Reference 37: http://www.xbrl.org/2003/role/disclosureRef
-Topic 946
-SubTopic 320
-Name Accounting Standards Codification
-Section S99
-Paragraph 3
-Subparagraph (SX 210.12-12B(Column B)(Footnote 10))
-Publisher FASB
-URI https://asc.fasb.org//1943274/2147480032/946-320-S99-3
Reference 38: http://www.xbrl.org/2003/role/disclosureRef
-Topic 946
-SubTopic 320
-Name Accounting Standards Codification
-Section S99
-Paragraph 3
-Subparagraph (SX 210.12-12B(Column C)(Footnote 11))
-Publisher FASB
-URI https://asc.fasb.org//1943274/2147480032/946-320-S99-3
Reference 39: http://www.xbrl.org/2003/role/disclosureRef
-Topic 946
-SubTopic 320
-Name Accounting Standards Codification
-Section S99
-Paragraph 3
-Subparagraph (SX 210.12-12B(Column C)(Footnote 11)(a)(1))
-Publisher FASB
-URI https://asc.fasb.org//1943274/2147480032/946-320-S99-3
Reference 40: http://www.xbrl.org/2003/role/disclosureRef
-Topic 946
-SubTopic 320
-Name Accounting Standards Codification
-Section S99
-Paragraph 3
-Subparagraph (SX 210.12-12B(Column C)(Footnote 11)(a)(2))
-Publisher FASB
-URI https://asc.fasb.org//1943274/2147480032/946-320-S99-3
Reference 41: http://www.xbrl.org/2003/role/disclosureRef
-Topic 946
-SubTopic 320
-Name Accounting Standards Codification
-Section S99
-Paragraph 3
-Subparagraph (SX 210.12-12B(Column C)(Footnote 11)(a)(3))
-Publisher FASB
-URI https://asc.fasb.org//1943274/2147480032/946-320-S99-3
Reference 42: http://www.xbrl.org/2003/role/disclosureRef
-Topic 946
-SubTopic 320
-Name Accounting Standards Codification
-Section S99
-Paragraph 3
-Subparagraph (SX 210.12-12B(Column C)(Footnote 11)(b)(1))
-Publisher FASB
-URI https://asc.fasb.org//1943274/2147480032/946-320-S99-3
Reference 43: http://www.xbrl.org/2003/role/disclosureRef
-Topic 946
-SubTopic 320
-Name Accounting Standards Codification
-Section S99
-Paragraph 3
-Subparagraph (SX 210.12-12B(Column C)(Footnote 11)(b)(2))
-Publisher FASB
-URI https://asc.fasb.org//1943274/2147480032/946-320-S99-3
Reference 44: http://www.xbrl.org/2003/role/disclosureRef
-Topic 946
-SubTopic 320
-Name Accounting Standards Codification
-Section S99
-Paragraph 3
-Subparagraph (SX 210.12-12B(Column C)(Footnote 11)(c))
-Publisher FASB
-URI https://asc.fasb.org//1943274/2147480032/946-320-S99-3
Reference 45: http://www.xbrl.org/2003/role/disclosureRef
-Topic 946
-SubTopic 320
-Name Accounting Standards Codification
-Section S99
-Paragraph 3
-Subparagraph (SX 210.12-12B(Column C)(Footnote 12))
-Publisher FASB
-URI https://asc.fasb.org//1943274/2147480032/946-320-S99-3
Reference 46: http://www.xbrl.org/2003/role/disclosureRef
-Topic 946
-SubTopic 320
-Name Accounting Standards Codification
-Section S99
-Paragraph 3
-Subparagraph (SX 210.12-12B(Column C)(Footnote 13))
-Publisher FASB
-URI https://asc.fasb.org//1943274/2147480032/946-320-S99-3
Reference 47: http://www.xbrl.org/2003/role/disclosureRef
-Topic 946
-SubTopic 320
-Name Accounting Standards Codification
-Section S99
-Paragraph 6
-Subparagraph (SX 210.12-14(Column A))
-Publisher FASB
-URI https://asc.fasb.org//1943274/2147480032/946-320-S99-6
Reference 48: http://www.xbrl.org/2003/role/disclosureRef
-Topic 946
-SubTopic 320
-Name Accounting Standards Codification
-Section S99
-Paragraph 6
-Subparagraph (SX 210.12-14(Column B))
-Publisher FASB
-URI https://asc.fasb.org//1943274/2147480032/946-320-S99-6
Reference 49: http://www.xbrl.org/2003/role/disclosureRef
-Topic 946
-SubTopic 320
-Name Accounting Standards Codification
-Section S99
-Paragraph 6
-Subparagraph (SX 210.12-14(Column F))
-Publisher FASB
-URI https://asc.fasb.org//1943274/2147480032/946-320-S99-6
Reference 50: http://www.xbrl.org/2003/role/disclosureRef
-Topic 946
-SubTopic 320
-Name Accounting Standards Codification
-Section S99
-Paragraph 6
-Subparagraph (SX 210.12-14(Column A)(Footnote 1)(a)(1))
-Publisher FASB
-URI https://asc.fasb.org//1943274/2147480032/946-320-S99-6
Reference 51: http://www.xbrl.org/2003/role/disclosureRef
-Topic 946
-SubTopic 320
-Name Accounting Standards Codification
-Section S99
-Paragraph 6
-Subparagraph (SX 210.12-14(Column A)(Footnote 1)(a)(2))
-Publisher FASB
-URI https://asc.fasb.org//1943274/2147480032/946-320-S99-6
Reference 52: http://www.xbrl.org/2003/role/disclosureRef
-Topic 946
-SubTopic 320
-Name Accounting Standards Codification
-Section S99
-Paragraph 6
-Subparagraph (SX 210.12-14(Column A)(Footnote 1)(a)(3))
-Publisher FASB
-URI https://asc.fasb.org//1943274/2147480032/946-320-S99-6
Reference 53: http://www.xbrl.org/2003/role/disclosureRef
-Topic 946
-SubTopic 320
-Name Accounting Standards Codification
-Section S99
-Paragraph 6
-Subparagraph (SX 210.12-14(Column A)(Footnote 1)(b)(2))
-Publisher FASB
-URI https://asc.fasb.org//1943274/2147480032/946-320-S99-6
Reference 54: http://www.xbrl.org/2003/role/disclosureRef
-Topic 946
-SubTopic 320
-Name Accounting Standards Codification
-Section S99
-Paragraph 6
-Subparagraph (SX 210.12-14(Column A)(Footnote 1)(b)(3))
-Publisher FASB
-URI https://asc.fasb.org//1943274/2147480032/946-320-S99-6
Reference 55: http://www.xbrl.org/2003/role/disclosureRef
-Topic 946
-SubTopic 320
-Name Accounting Standards Codification
-Section S99
-Paragraph 6
-Subparagraph (SX 210.12-14(Column A)(Footnote 1)(b)(4))
-Publisher FASB
-URI https://asc.fasb.org//1943274/2147480032/946-320-S99-6
Reference 56: http://www.xbrl.org/2003/role/disclosureRef
-Topic 946
-SubTopic 320
-Name Accounting Standards Codification
-Section S99
-Paragraph 6
-Subparagraph (SX 210.12-14(Column A)(Footnote 1)(b)(5))
-Publisher FASB
-URI https://asc.fasb.org//1943274/2147480032/946-320-S99-6
Reference 57: http://www.xbrl.org/2003/role/disclosureRef
-Topic 946
-SubTopic 320
-Name Accounting Standards Codification
-Section S99
-Paragraph 6
-Subparagraph (SX 210.12-14(Column A)(Footnote 1)(b))
-Publisher FASB
-URI https://asc.fasb.org//1943274/2147480032/946-320-S99-6
Reference 58: http://www.xbrl.org/2003/role/disclosureRef
-Topic 946
-SubTopic 320
-Name Accounting Standards Codification
-Section S99
-Paragraph 6
-Subparagraph (SX 210.12-14(Column A)(Footnote 3))
-Publisher FASB
-URI https://asc.fasb.org//1943274/2147480032/946-320-S99-6
Reference 59: http://www.xbrl.org/2003/role/disclosureRef
-Topic 946
-SubTopic 320
-Name Accounting Standards Codification
-Section S99
-Paragraph 6
-Subparagraph (SX 210.12-14(Column F)(Footnote 4))
-Publisher FASB
-URI https://asc.fasb.org//1943274/2147480032/946-320-S99-6
Reference 60: http://www.xbrl.org/2003/role/disclosureRef
-Topic 946
-SubTopic 320
-Name Accounting Standards Codification
-Section S99
-Paragraph 6
-Subparagraph (SX 210.12-14(Column F)(Footnote 5)(a))
-Publisher FASB
-URI https://asc.fasb.org//1943274/2147480032/946-320-S99-6
Reference 61: http://www.xbrl.org/2003/role/disclosureRef
-Topic 946
-SubTopic 320
-Name Accounting Standards Codification
-Section S99
-Paragraph 6
-Subparagraph (SX 210.12-14(Column F)(Footnote 7))
-Publisher FASB
-URI https://asc.fasb.org//1943274/2147480032/946-320-S99-6
Reference 62: http://www.xbrl.org/2003/role/disclosureRef
-Topic 946
-SubTopic 320
-Name Accounting Standards Codification
-Section S99
-Paragraph 6
-Subparagraph (SX 210.12-14(Column F)(Footnote 8))
-Publisher FASB
-URI https://asc.fasb.org//1943274/2147480032/946-320-S99-6
Reference 63: http://www.xbrl.org/2003/role/disclosureRef
-Topic 946
-SubTopic 320
-Name Accounting Standards Codification
-Section S99
-Paragraph 6
-Subparagraph (SX 210.12-14(Column F)(Footnote 9))
-Publisher FASB
-URI https://asc.fasb.org//1943274/2147480032/946-320-S99-6
Reference 64: http://www.xbrl.org/2003/role/disclosureRef
-Topic 946
-SubTopic 320
-Name Accounting Standards Codification
-Section S99
-Paragraph 19
-Subparagraph (1)
-Publisher FASB
-URI https://asc.fasb.org//1943274/2147480032/946-320-S99-19
Reference 65: http://www.xbrl.org/2003/role/disclosureRef
-Topic 946
-SubTopic 320
-Name Accounting Standards Codification
-Section S99
-Paragraph 19
-Subparagraph (3)
-Publisher FASB
-URI https://asc.fasb.org//1943274/2147480032/946-320-S99-19
| Name: |
us-gaap_ScheduleOfInvestmentsLineItems |
| Namespace Prefix: |
us-gaap_ |
| Data Type: |
xbrli:stringItemType |
| Balance Type: |
na |
| Period Type: |
duration |
|
| X |
- Details
| Name: |
dei_LegalEntityAxis=tg_KaleoMember |
| Namespace Prefix: |
|
| Data Type: |
na |
| Balance Type: |
|
| Period Type: |
|
|
v3.23.2
Earnings Per Share (Narrative) (Details) - shares
|
3 Months Ended |
6 Months Ended |
Jun. 30, 2023 |
Jun. 30, 2022 |
Jun. 30, 2023 |
Jun. 30, 2022 |
| Earnings Per Share [Abstract] |
|
|
|
|
| Antidilutive Securities Excluded from Computation of Earnings Per Share, Amount |
3,019,333
|
2,525,104
|
2,830,849
|
2,501,406
|
| X |
- DefinitionSecurities (including those issuable pursuant to contingent stock agreements) that could potentially dilute basic earnings per share (EPS) or earnings per unit (EPU) in the future that were not included in the computation of diluted EPS or EPU because to do so would increase EPS or EPU amounts or decrease loss per share or unit amounts for the period presented. Reference 1: http://www.xbrl.org/2003/role/disclosureRef
-Topic 260
-SubTopic 10
-Name Accounting Standards Codification
-Section 50
-Paragraph 1
-Subparagraph (c)
-Publisher FASB
-URI https://asc.fasb.org//1943274/2147482662/260-10-50-1
| Name: |
us-gaap_AntidilutiveSecuritiesExcludedFromComputationOfEarningsPerShareAmount |
| Namespace Prefix: |
us-gaap_ |
| Data Type: |
xbrli:sharesItemType |
| Balance Type: |
na |
| Period Type: |
duration |
|
| X |
- References
+ Details
| Name: |
us-gaap_EarningsPerShareAbstract |
| Namespace Prefix: |
us-gaap_ |
| Data Type: |
xbrli:stringItemType |
| Balance Type: |
na |
| Period Type: |
duration |
|
v3.23.2
Earnings Per Share (Schedule Of Calculation Of Numerator And Denominator In Earnings Per Share) (Details) - shares
shares in Thousands |
3 Months Ended |
6 Months Ended |
Jun. 30, 2023 |
Jun. 30, 2022 |
Jun. 30, 2023 |
Jun. 30, 2022 |
| Earnings Per Share [Abstract] |
|
|
|
|
| Weighted average shares outstanding used to compute basic earnings per share |
34,079
|
33,814
|
33,988
|
33,734
|
| Incremental dilutive shares attributable to stock options and restricted stock |
0
|
40
|
0
|
42
|
| Shares used to compute diluted earnings per share |
34,079
|
33,854
|
33,988
|
33,776
|
| X |
- References
+ Details
| Name: |
us-gaap_EarningsPerShareAbstract |
| Namespace Prefix: |
us-gaap_ |
| Data Type: |
xbrli:stringItemType |
| Balance Type: |
na |
| Period Type: |
duration |
|
| X |
- DefinitionAdditional shares included in the calculation of diluted EPS as a result of the potentially dilutive effect of share based payment arrangements using the treasury stock method. Reference 1: http://www.xbrl.org/2003/role/disclosureRef
-Topic 718
-SubTopic 10
-Name Accounting Standards Codification
-Section 45
-Paragraph 1
-Publisher FASB
-URI https://asc.fasb.org//1943274/2147480454/718-10-45-1
Reference 2: http://www.xbrl.org/2003/role/disclosureRef
-Topic 260
-SubTopic 10
-Name Accounting Standards Codification
-Section 50
-Paragraph 1
-Subparagraph (a)
-Publisher FASB
-URI https://asc.fasb.org//1943274/2147482662/260-10-50-1
Reference 3: http://www.xbrl.org/2003/role/disclosureRef
-Topic 260
-SubTopic 10
-Name Accounting Standards Codification
-Section 45
-Paragraph 22
-Publisher FASB
-URI https://asc.fasb.org//1943274/2147482689/260-10-45-22
Reference 4: http://www.xbrl.org/2003/role/disclosureRef
-Topic 260
-SubTopic 10
-Name Accounting Standards Codification
-Section 45
-Paragraph 23
-Subparagraph (c)
-Publisher FASB
-URI https://asc.fasb.org//1943274/2147482689/260-10-45-23
Reference 5: http://www.xbrl.org/2003/role/disclosureRef
-Topic 260
-SubTopic 10
-Name Accounting Standards Codification
-Section 45
-Paragraph 28A
-Publisher FASB
-URI https://asc.fasb.org//1943274/2147482689/260-10-45-28A
| Name: |
us-gaap_IncrementalCommonSharesAttributableToShareBasedPaymentArrangements |
| Namespace Prefix: |
us-gaap_ |
| Data Type: |
xbrli:sharesItemType |
| Balance Type: |
na |
| Period Type: |
duration |
|
| X |
- DefinitionThe average number of shares or units issued and outstanding that are used in calculating diluted EPS or earnings per unit (EPU), determined based on the timing of issuance of shares or units in the period. Reference 1: http://www.xbrl.org/2003/role/disclosureRef
-Topic 260
-SubTopic 10
-Name Accounting Standards Codification
-Section 50
-Paragraph 1
-Subparagraph (a)
-Publisher FASB
-URI https://asc.fasb.org//1943274/2147482662/260-10-50-1
Reference 2: http://www.xbrl.org/2003/role/disclosureRef
-Topic 260
-SubTopic 10
-Name Accounting Standards Codification
-Section 45
-Paragraph 16
-Publisher FASB
-URI https://asc.fasb.org//1943274/2147482689/260-10-45-16
| Name: |
us-gaap_WeightedAverageNumberOfDilutedSharesOutstanding |
| Namespace Prefix: |
us-gaap_ |
| Data Type: |
xbrli:sharesItemType |
| Balance Type: |
na |
| Period Type: |
duration |
|
| X |
- DefinitionNumber of [basic] shares or units, after adjustment for contingently issuable shares or units and other shares or units not deemed outstanding, determined by relating the portion of time within a reporting period that common shares or units have been outstanding to the total time in that period. Reference 1: http://www.xbrl.org/2003/role/disclosureRef
-Topic 260
-SubTopic 10
-Name Accounting Standards Codification
-Section 50
-Paragraph 1
-Subparagraph (a)
-Publisher FASB
-URI https://asc.fasb.org//1943274/2147482662/260-10-50-1
Reference 2: http://www.xbrl.org/2003/role/disclosureRef
-Topic 260
-SubTopic 10
-Name Accounting Standards Codification
-Section 45
-Paragraph 10
-Publisher FASB
-URI https://asc.fasb.org//1943274/2147482689/260-10-45-10
| Name: |
us-gaap_WeightedAverageNumberOfSharesOutstandingBasic |
| Namespace Prefix: |
us-gaap_ |
| Data Type: |
xbrli:sharesItemType |
| Balance Type: |
na |
| Period Type: |
duration |
|
v3.23.2
Accumulated Other Comprehensive Income (Loss) (Schedule Of Reclassifications Of Balances Out Of Accumulated Other Comprehensive Income (Loss) Into Net Income) (Details) - USD ($)
$ in Thousands |
3 Months Ended |
6 Months Ended |
Jun. 30, 2023 |
Jun. 30, 2022 |
Jun. 30, 2023 |
Jun. 30, 2022 |
| Reclassification Adjustment out of Accumulated Other Comprehensive Income [Line Items] |
|
|
|
|
| Beginning Balance |
$ 201,609
|
$ 211,868
|
$ 201,762
|
$ 184,722
|
| Other comprehensive income (loss) |
4,288
|
(17,393)
|
8,921
|
(1,126)
|
| Income tax (expense) benefit |
(1,124)
|
3,592
|
(2,646)
|
(326)
|
| Other comprehensive income (loss), net of tax |
3,164
|
(13,801)
|
6,275
|
(1,452)
|
| Reclassification adjustment to net income (loss) |
1,302
|
2,428
|
3,253
|
4,521
|
| Income tax (expense) benefit |
(191)
|
(462)
|
(577)
|
(900)
|
| Reclassification adjustment to net income (loss), net of tax |
1,111
|
1,966
|
2,676
|
3,621
|
| Other comprehensive income (loss) |
4,275
|
(11,835)
|
8,951
|
2,169
|
| Ending Balance |
183,149
|
211,785
|
183,149
|
211,785
|
| Accumulated Other Comprehensive Income (Loss) |
|
|
|
|
| Reclassification Adjustment out of Accumulated Other Comprehensive Income [Line Items] |
|
|
|
|
| Beginning Balance |
(142,919)
|
(135,500)
|
(147,595)
|
(149,504)
|
| Ending Balance |
(138,644)
|
(147,335)
|
(138,644)
|
(147,335)
|
| Foreign Currency Translation |
|
|
|
|
| Reclassification Adjustment out of Accumulated Other Comprehensive Income [Line Items] |
|
|
|
|
| Beginning Balance |
(84,959)
|
(80,256)
|
(86,079)
|
(85,792)
|
| Other comprehensive income (loss) |
1,800
|
(5,712)
|
3,356
|
552
|
| Income tax (expense) benefit |
(179)
|
482
|
(615)
|
(246)
|
| Other comprehensive income (loss), net of tax |
1,621
|
(5,230)
|
2,741
|
306
|
| Reclassification adjustment to net income (loss) |
0
|
0
|
0
|
0
|
| Income tax (expense) benefit |
0
|
0
|
0
|
0
|
| Reclassification adjustment to net income (loss), net of tax |
0
|
0
|
0
|
0
|
| Other comprehensive income (loss) |
1,621
|
(5,230)
|
2,741
|
306
|
| Ending Balance |
(83,338)
|
(85,486)
|
(83,338)
|
(85,486)
|
| Gain (Loss) on Derivative Financial Instruments |
|
|
|
|
| Reclassification Adjustment out of Accumulated Other Comprehensive Income [Line Items] |
|
|
|
|
| Beginning Balance |
(1,211)
|
6,831
|
(2,480)
|
901
|
| Other comprehensive income (loss) |
2,488
|
(11,681)
|
5,565
|
(1,678)
|
| Income tax (expense) benefit |
(945)
|
3,110
|
(2,031)
|
(80)
|
| Other comprehensive income (loss), net of tax |
1,543
|
(8,571)
|
3,534
|
(1,758)
|
| Reclassification adjustment to net income (loss) |
(1,621)
|
(840)
|
(2,594)
|
(1,997)
|
| Income tax (expense) benefit |
446
|
250
|
697
|
524
|
| Reclassification adjustment to net income (loss), net of tax |
(1,175)
|
(590)
|
(1,897)
|
(1,473)
|
| Other comprehensive income (loss) |
368
|
(9,161)
|
1,637
|
(3,231)
|
| Ending Balance |
(843)
|
(2,330)
|
(843)
|
(2,330)
|
| Pension & Other Postretirement Benefit Adjust |
|
|
|
|
| Reclassification Adjustment out of Accumulated Other Comprehensive Income [Line Items] |
|
|
|
|
| Beginning Balance |
(56,749)
|
(62,075)
|
(59,036)
|
(64,613)
|
| Other comprehensive income (loss) |
0
|
0
|
0
|
0
|
| Income tax (expense) benefit |
0
|
0
|
0
|
0
|
| Other comprehensive income (loss), net of tax |
0
|
0
|
0
|
0
|
| Reclassification adjustment to net income (loss) |
2,923
|
3,268
|
5,847
|
6,518
|
| Income tax (expense) benefit |
(637)
|
(712)
|
(1,274)
|
(1,424)
|
| Reclassification adjustment to net income (loss), net of tax |
2,286
|
2,556
|
4,573
|
5,094
|
| Other comprehensive income (loss) |
2,286
|
2,556
|
4,573
|
5,094
|
| Ending Balance |
$ (54,463)
|
$ (59,519)
|
$ (54,463)
|
$ (59,519)
|
| X |
- DefinitionAmount before tax and reclassification adjustments of other comprehensive income (loss) attributable to parent. Reference 1: http://fasb.org/us-gaap/role/ref/legacyRef
-Name Accounting Standards Codification
-Topic 220
-SubTopic 10
-Section 45
-Paragraph 14A
-Publisher FASB
-URI https://asc.fasb.org//1943274/2147482790/220-10-45-14A
| Name: |
us-gaap_OciBeforeReclassificationsBeforeTaxAttributableToParent |
| Namespace Prefix: |
us-gaap_ |
| Data Type: |
xbrli:monetaryItemType |
| Balance Type: |
credit |
| Period Type: |
duration |
|
| X |
- DefinitionAmount after tax, before reclassification adjustments, of other comprehensive income (loss), attributable to parent. Reference 1: http://fasb.org/us-gaap/role/ref/legacyRef
-Name Accounting Standards Codification
-Topic 220
-SubTopic 10
-Section 45
-Paragraph 14A
-Publisher FASB
-URI https://asc.fasb.org//1943274/2147482790/220-10-45-14A
Reference 2: http://fasb.org/us-gaap/role/ref/legacyRef
-Name Accounting Standards Codification
-Section 55
-Paragraph 15
-SubTopic 10
-Topic 220
-Publisher FASB
-URI https://asc.fasb.org//1943274/2147482739/220-10-55-15
| Name: |
us-gaap_OciBeforeReclassificationsNetOfTaxAttributableToParent |
| Namespace Prefix: |
us-gaap_ |
| Data Type: |
xbrli:monetaryItemType |
| Balance Type: |
credit |
| Period Type: |
duration |
|
| X |
- DefinitionAmount of tax expense (benefit) allocated to other comprehensive income (loss) before reclassification adjustment from accumulated other comprehensive income (loss). Reference 1: http://fasb.org/us-gaap/role/ref/legacyRef
-Name Accounting Standards Codification
-Section 45
-Paragraph 12
-SubTopic 10
-Topic 220
-Publisher FASB
-URI https://asc.fasb.org//1943274/2147482790/220-10-45-12
Reference 2: http://www.xbrl.org/2003/role/disclosureRef
-Topic 220
-SubTopic 10
-Name Accounting Standards Codification
-Section 50
-Paragraph 4
-Publisher FASB
-URI https://asc.fasb.org//1943274/2147482765/220-10-50-4
Reference 3: http://www.xbrl.org/2003/role/disclosureRef
-Topic 944
-SubTopic 220
-Name Accounting Standards Codification
-Section S99
-Paragraph 1
-Subparagraph (SX 210.7-04(19))
-Publisher FASB
-URI https://asc.fasb.org//1943274/2147483586/944-220-S99-1
| Name: |
us-gaap_OtherComprehensiveIncomeLossBeforeReclassificationsTax |
| Namespace Prefix: |
us-gaap_ |
| Data Type: |
xbrli:monetaryItemType |
| Balance Type: |
debit |
| Period Type: |
duration |
|
| X |
- DefinitionAmount after tax of other comprehensive income (loss) attributable to parent entity. Reference 1: http://fasb.org/us-gaap/role/ref/legacyRef
-Topic 810
-SubTopic 10
-Name Accounting Standards Codification
-Section 45
-Paragraph 19
-Publisher FASB
-URI https://asc.fasb.org//1943274/2147481231/810-10-45-19
Reference 2: http://fasb.org/us-gaap/role/ref/legacyRef
-Name Accounting Standards Codification
-Section 45
-Paragraph 20
-SubTopic 10
-Topic 810
-Publisher FASB
-URI https://asc.fasb.org//1943274/2147481231/810-10-45-20
Reference 3: http://fasb.org/us-gaap/role/ref/legacyRef
-Name Accounting Standards Codification
-Section 50
-Paragraph 1A
-Subparagraph (c)(3)
-SubTopic 10
-Topic 810
-Publisher FASB
-URI https://asc.fasb.org//1943274/2147481203/810-10-50-1A
Reference 4: http://www.xbrl.org/2003/role/disclosureRef
-Topic 220
-SubTopic 10
-Name Accounting Standards Codification
-Section 45
-Paragraph 1B
-Subparagraph (b)
-Publisher FASB
-URI https://asc.fasb.org//1943274/2147482790/220-10-45-1B
Reference 5: http://www.xbrl.org/2003/role/disclosureRef
-Topic 220
-SubTopic 10
-Name Accounting Standards Codification
-Section 45
-Paragraph 1A
-Subparagraph (b)
-Publisher FASB
-URI https://asc.fasb.org//1943274/2147482790/220-10-45-1A
| Name: |
us-gaap_OtherComprehensiveIncomeLossNetOfTaxPortionAttributableToParent |
| Namespace Prefix: |
us-gaap_ |
| Data Type: |
xbrli:monetaryItemType |
| Balance Type: |
credit |
| Period Type: |
duration |
|
| X |
- DefinitionLine items represent financial concepts included in a table. These concepts are used to disclose reportable information associated with domain members defined in one or many axes to the table. Reference 1: http://www.xbrl.org/2003/role/disclosureRef
-Topic 220
-SubTopic 10
-Name Accounting Standards Codification
-Section 50
-Paragraph 6
-Publisher FASB
-URI https://asc.fasb.org//1943274/2147482765/220-10-50-6
| Name: |
us-gaap_ReclassificationAdjustmentOutOfAccumulatedOtherComprehensiveIncomeLineItems |
| Namespace Prefix: |
us-gaap_ |
| Data Type: |
xbrli:stringItemType |
| Balance Type: |
na |
| Period Type: |
duration |
|
| X |
- DefinitionAmount before tax of reclassification adjustments of other comprehensive income (loss) attributable to parent. Reference 1: http://fasb.org/us-gaap/role/ref/legacyRef
-Name Accounting Standards Codification
-Topic 220
-SubTopic 10
-Section 45
-Paragraph 14A
-Publisher FASB
-URI https://asc.fasb.org//1943274/2147482790/220-10-45-14A
| Name: |
us-gaap_ReclassificationFromAociCurrentPeriodBeforeTaxAttributableToParent |
| Namespace Prefix: |
us-gaap_ |
| Data Type: |
xbrli:monetaryItemType |
| Balance Type: |
debit |
| Period Type: |
duration |
|
| X |
- DefinitionAmount after tax of reclassification adjustments of other comprehensive income (loss) attributable to parent. Reference 1: http://fasb.org/us-gaap/role/ref/legacyRef
-Name Accounting Standards Codification
-Topic 220
-SubTopic 10
-Section 45
-Paragraph 14A
-Publisher FASB
-URI https://asc.fasb.org//1943274/2147482790/220-10-45-14A
Reference 2: http://fasb.org/us-gaap/role/ref/legacyRef
-Name Accounting Standards Codification
-Section 55
-Paragraph 15
-SubTopic 10
-Topic 220
-Publisher FASB
-URI https://asc.fasb.org//1943274/2147482739/220-10-55-15
| Name: |
us-gaap_ReclassificationFromAociCurrentPeriodNetOfTaxAttributableToParent |
| Namespace Prefix: |
us-gaap_ |
| Data Type: |
xbrli:monetaryItemType |
| Balance Type: |
debit |
| Period Type: |
duration |
|
| X |
- DefinitionAmount of tax expense (benefit) of reclassification adjustment from accumulated other comprehensive income (loss). Reference 1: http://fasb.org/us-gaap/role/ref/legacyRef
-Name Accounting Standards Codification
-Section 45
-Paragraph 12
-SubTopic 10
-Topic 220
-Publisher FASB
-URI https://asc.fasb.org//1943274/2147482790/220-10-45-12
Reference 2: http://www.xbrl.org/2003/role/disclosureRef
-Topic 220
-SubTopic 10
-Name Accounting Standards Codification
-Section 50
-Paragraph 4
-Publisher FASB
-URI https://asc.fasb.org//1943274/2147482765/220-10-50-4
Reference 3: http://www.xbrl.org/2003/role/disclosureRef
-Topic 944
-SubTopic 220
-Name Accounting Standards Codification
-Section S99
-Paragraph 1
-Subparagraph (SX 210.7-04(19))
-Publisher FASB
-URI https://asc.fasb.org//1943274/2147483586/944-220-S99-1
Reference 4: http://www.xbrl.org/2003/role/disclosureRef
-Topic 220
-SubTopic 10
-Name Accounting Standards Codification
-Section 45
-Paragraph 17A
-Publisher FASB
-URI https://asc.fasb.org//1943274/2147482790/220-10-45-17A
| Name: |
us-gaap_ReclassificationFromAociCurrentPeriodTax |
| Namespace Prefix: |
us-gaap_ |
| Data Type: |
xbrli:monetaryItemType |
| Balance Type: |
credit |
| Period Type: |
duration |
|
| X |
- DefinitionAmount of equity (deficit) attributable to parent. Excludes temporary equity and equity attributable to noncontrolling interest. Reference 1: http://www.xbrl.org/2003/role/exampleRef
-Topic 852
-SubTopic 10
-Name Accounting Standards Codification
-Section 55
-Paragraph 10
-Publisher FASB
-URI https://asc.fasb.org//1943274/2147481372/852-10-55-10
Reference 2: http://www.xbrl.org/2003/role/exampleRef
-Topic 946
-SubTopic 830
-Name Accounting Standards Codification
-Section 55
-Paragraph 12
-Publisher FASB
-URI https://asc.fasb.org//1943274/2147480167/946-830-55-12
Reference 3: http://www.xbrl.org/2003/role/disclosureRef
-Topic 946
-SubTopic 210
-Name Accounting Standards Codification
-Section S99
-Paragraph 1
-Subparagraph (SX 210.6-04(19))
-Publisher FASB
-URI https://asc.fasb.org//1943274/2147479617/946-210-S99-1
Reference 4: http://www.xbrl.org/2003/role/disclosureRef
-Topic 946
-SubTopic 210
-Name Accounting Standards Codification
-Section S99
-Paragraph 2
-Subparagraph (SX 210.6-05(4))
-Publisher FASB
-URI https://asc.fasb.org//1943274/2147479617/946-210-S99-2
Reference 5: http://www.xbrl.org/2009/role/commonPracticeRef
-Topic 946
-SubTopic 220
-Name Accounting Standards Codification
-Section S99
-Paragraph 3
-Subparagraph (SX 210.6-09(4)(b))
-Publisher FASB
-URI https://asc.fasb.org//1943274/2147483575/946-220-S99-3
Reference 6: http://www.xbrl.org/2003/role/disclosureRef
-Topic 946
-SubTopic 220
-Name Accounting Standards Codification
-Section S99
-Paragraph 3
-Subparagraph (SX 210.6-09(6))
-Publisher FASB
-URI https://asc.fasb.org//1943274/2147483575/946-220-S99-3
Reference 7: http://www.xbrl.org/2003/role/disclosureRef
-Topic 946
-SubTopic 220
-Name Accounting Standards Codification
-Section S99
-Paragraph 3
-Subparagraph (SX 210.6-09(7))
-Publisher FASB
-URI https://asc.fasb.org//1943274/2147483575/946-220-S99-3
Reference 8: http://www.xbrl.org/2009/role/commonPracticeRef
-Topic 235
-SubTopic 10
-Name Accounting Standards Codification
-Section S99
-Paragraph 1
-Subparagraph (SX 210.4-08(g)(1)(ii))
-Publisher FASB
-URI https://asc.fasb.org//1943274/2147480678/235-10-S99-1
Reference 9: http://www.xbrl.org/2009/role/commonPracticeRef
-Topic 323
-SubTopic 10
-Name Accounting Standards Codification
-Section 50
-Paragraph 3
-Subparagraph (c)
-Publisher FASB
-URI https://asc.fasb.org//1943274/2147481687/323-10-50-3
Reference 10: http://www.xbrl.org/2009/role/commonPracticeRef
-Topic 825
-SubTopic 10
-Name Accounting Standards Codification
-Section 50
-Paragraph 28
-Subparagraph (f)
-Publisher FASB
-URI https://asc.fasb.org//1943274/2147482907/825-10-50-28
Reference 11: http://fasb.org/us-gaap/role/ref/legacyRef
-Topic 210
-SubTopic 10
-Name Accounting Standards Codification
-Section S99
-Paragraph 1
-Subparagraph (SX 210.5-02(29))
-Publisher FASB
-URI https://asc.fasb.org//1943274/2147480566/210-10-S99-1
Reference 12: http://fasb.org/us-gaap/role/ref/legacyRef
-Topic 210
-SubTopic 10
-Name Accounting Standards Codification
-Section S99
-Paragraph 1
-Subparagraph (SX 210.5-02(31))
-Publisher FASB
-URI https://asc.fasb.org//1943274/2147480566/210-10-S99-1
Reference 13: http://fasb.org/us-gaap/role/ref/legacyRef
-Topic 210
-SubTopic 10
-Name Accounting Standards Codification
-Section S99
-Paragraph 1
-Subparagraph (SX 210.5-02(30))
-Publisher FASB
-URI https://asc.fasb.org//1943274/2147480566/210-10-S99-1
Reference 14: http://fasb.org/us-gaap/role/ref/legacyRef
-Topic 310
-SubTopic 10
-Name Accounting Standards Codification
-Section S99
-Paragraph 2
-Subparagraph (SAB Topic 4.E)
-Publisher FASB
-URI https://asc.fasb.org//1943274/2147480418/310-10-S99-2
| Name: |
us-gaap_StockholdersEquity |
| Namespace Prefix: |
us-gaap_ |
| Data Type: |
xbrli:monetaryItemType |
| Balance Type: |
credit |
| Period Type: |
instant |
|
| X |
- Details
| Name: |
us-gaap_StatementEquityComponentsAxis=us-gaap_AccumulatedOtherComprehensiveIncomeMember |
| Namespace Prefix: |
|
| Data Type: |
na |
| Balance Type: |
|
| Period Type: |
|
|
| X |
- Details
| Name: |
us-gaap_StatementEquityComponentsAxis=us-gaap_AccumulatedTranslationAdjustmentMember |
| Namespace Prefix: |
|
| Data Type: |
na |
| Balance Type: |
|
| Period Type: |
|
|
| X |
- Details
| Name: |
us-gaap_StatementEquityComponentsAxis=us-gaap_AccumulatedGainLossNetCashFlowHedgeParentMember |
| Namespace Prefix: |
|
| Data Type: |
na |
| Balance Type: |
|
| Period Type: |
|
|
| X |
- Details
| Name: |
us-gaap_StatementEquityComponentsAxis=us-gaap_AccumulatedDefinedBenefitPlansAdjustmentMember |
| Namespace Prefix: |
|
| Data Type: |
na |
| Balance Type: |
|
| Period Type: |
|
|
v3.23.2
Derivative Financial Instruments (Narrative) (Details)
R$ in Thousands, $ in Thousands, lbs in Millions |
6 Months Ended |
|
|
|
Jun. 30, 2023
USD ($)
lbs
|
Jun. 30, 2023
BRL (R$)
|
Jun. 30, 2023
BRL (R$)
lbs
|
Dec. 31, 2022
USD ($)
lbs
|
| Derivative [Line Items] |
|
|
|
|
| Cash Flow Hedge Gain (Loss) to be Reclassified within Twelve Months |
$ (1,800)
|
|
|
|
| Aluminum Futures Contracts |
|
|
|
|
| Derivative [Line Items] |
|
|
|
|
| Derivative, Notional Amount |
$ 17,000
|
|
|
$ 30,700
|
| Commitment Under Cash Flow Hedges, Mass | lbs |
11.1
|
|
11.1
|
20.3
|
| Terphane Ltda [Member] |
|
|
|
|
| Derivative [Line Items] |
|
|
|
|
| Derivative, Notional Amount |
$ 19,970
|
|
R$ 115,443
|
|
| Terphane Ltda [Member] | Oct-2018 [Member] |
|
|
|
|
| Derivative [Line Items] |
|
|
|
|
| Annual Net Costs Mismatch Translation Exposure - Real vs US Dollar | R$ |
|
R$ 177,000
|
|
|
| X |
- DefinitionAnnual Net Costs Mismatch Translation Exposure - Real vs US Dollar
| Name: |
tg_AnnualNetCostsMismatchTranslationExposureRealvsUSDollar |
| Namespace Prefix: |
tg_ |
| Data Type: |
xbrli:monetaryItemType |
| Balance Type: |
debit |
| Period Type: |
duration |
|
| X |
- DefinitionCommitment Under Cash Flow Hedges, Mass
| Name: |
tg_CommitmentUnderCashFlowHedgesMass |
| Namespace Prefix: |
tg_ |
| Data Type: |
dtr-types1:weightItemType |
| Balance Type: |
na |
| Period Type: |
instant |
|
| X |
- DefinitionThe estimated net amount of existing gains or losses on cash flow hedges at the reporting date expected to be reclassified to earnings within the next 12 months. Reference 1: http://fasb.org/us-gaap/role/ref/legacyRef
-Name Accounting Standards Codification
-Topic 815
-SubTopic 30
-Section 50
-Paragraph 1
-Subparagraph (c)
-Publisher FASB
-URI https://asc.fasb.org//1943274/2147480870/815-30-50-1
| Name: |
us-gaap_CashFlowHedgeGainLossToBeReclassifiedWithinTwelveMonths |
| Namespace Prefix: |
us-gaap_ |
| Data Type: |
xbrli:monetaryItemType |
| Balance Type: |
credit |
| Period Type: |
duration |
|
| X |
- DefinitionLine items represent financial concepts included in a table. These concepts are used to disclose reportable information associated with domain members defined in one or many axes to the table. Reference 1: http://www.xbrl.org/2003/role/disclosureRef
-Topic 815
-SubTopic 40
-Name Accounting Standards Codification
-Section 50
-Paragraph 5
-Subparagraph (f)
-Publisher FASB
-URI https://asc.fasb.org//1943274/2147480237/815-40-50-5
| Name: |
us-gaap_DerivativeLineItems |
| Namespace Prefix: |
us-gaap_ |
| Data Type: |
xbrli:stringItemType |
| Balance Type: |
na |
| Period Type: |
duration |
|
| X |
- DefinitionNominal or face amount used to calculate payment on derivative. Reference 1: http://www.xbrl.org/2009/role/commonPracticeRef
-Topic 815
-SubTopic 10
-Name Accounting Standards Codification
-Section 50
-Paragraph 1B
-Publisher FASB
-URI https://asc.fasb.org//1943274/2147480434/815-10-50-1B
Reference 2: http://www.xbrl.org/2009/role/commonPracticeRef
-Topic 815
-SubTopic 10
-Name Accounting Standards Codification
-Section 50
-Paragraph 1A
-Subparagraph (d)
-Publisher FASB
-URI https://asc.fasb.org//1943274/2147480434/815-10-50-1A
| Name: |
us-gaap_DerivativeNotionalAmount |
| Namespace Prefix: |
us-gaap_ |
| Data Type: |
xbrli:monetaryItemType |
| Balance Type: |
na |
| Period Type: |
instant |
|
| X |
- Details
| Name: |
us-gaap_DerivativeInstrumentRiskAxis=tg_AluminumFuturesContractsMember |
| Namespace Prefix: |
|
| Data Type: |
na |
| Balance Type: |
|
| Period Type: |
|
|
| X |
- Details
| Name: |
us-gaap_DerivativeInstrumentRiskAxis=tg_TerphaneLtdaMember |
| Namespace Prefix: |
|
| Data Type: |
na |
| Balance Type: |
|
| Period Type: |
|
|
| X |
- Details
| Name: |
tg_CashFlowHedgeMaturityDateAxis=tg_Oct2018Member |
| Namespace Prefix: |
|
| Data Type: |
na |
| Balance Type: |
|
| Period Type: |
|
|
v3.23.2
Derivative Financial Instruments (Summary Of Location And Fair Value Of Derivative Financial Instruments) (Details) - USD ($)
$ in Thousands |
Jun. 30, 2023 |
Dec. 31, 2022 |
| Derivatives, Fair Value [Line Items] |
|
|
| Derivative Asset, Fair Value, Gross Asset |
$ 3,697
|
$ 811
|
| Aluminum Futures Contracts |
|
|
| Derivatives, Fair Value [Line Items] |
|
|
| Derivative Assets (Liabilities), at Fair Value, Net |
(3,305)
|
(3,581)
|
| Derivatives Designated As Hedging Instruments [Member] | Accrued Expenses [Member] |
|
|
| Derivatives, Fair Value [Line Items] |
|
|
| Liability derivatives: Fair Value |
0
|
3
|
| Derivatives Designated As Hedging Instruments [Member] | Prepaid Expenses and Other Current Assets |
|
|
| Derivatives, Fair Value [Line Items] |
|
|
| Derivative Asset, Fair Value, Gross Asset |
2,974
|
781
|
| Derivatives Designated As Hedging Instruments [Member] | Other Noncurrent Assets |
|
|
| Derivatives, Fair Value [Line Items] |
|
|
| Derivative Asset, Fair Value, Gross Asset |
723
|
33
|
| Derivatives Designated As Hedging Instruments [Member] | Aluminum Futures Contracts | Accrued Expenses [Member] |
|
|
| Derivatives, Fair Value [Line Items] |
|
|
| Liability derivatives: Fair Value |
(3,050)
|
(3,260)
|
| Derivatives Designated As Hedging Instruments [Member] | Aluminum Futures Contracts | Prepaid Expenses and Other Current Assets |
|
|
| Derivatives, Fair Value [Line Items] |
|
|
| Derivative Asset, Fair Value, Gross Asset |
0
|
48
|
| Derivatives Designated As Hedging Instruments [Member] | Aluminum Futures Contracts | Other non-current liabilities |
|
|
| Derivatives, Fair Value [Line Items] |
|
|
| Liability derivatives: Fair Value |
$ (255)
|
$ (369)
|
| X |
- DefinitionFair values as of the balance sheet date of the net amount of all assets and liabilities resulting from contracts that meet the criteria of being accounted for as derivative instruments. Reference 1: http://fasb.org/us-gaap/role/ref/legacyRef
-Name Accounting Standards Codification
-Section 45
-Paragraph 5
-SubTopic 10
-Topic 815
-Publisher FASB
-URI https://asc.fasb.org//1943274/2147480463/815-10-45-5
| Name: |
us-gaap_DerivativeAssetsLiabilitiesAtFairValueNet |
| Namespace Prefix: |
us-gaap_ |
| Data Type: |
xbrli:monetaryItemType |
| Balance Type: |
debit |
| Period Type: |
instant |
|
| X |
- DefinitionFair value, before effects of master netting arrangements, of a financial asset or other contract with one or more underlyings, notional amount or payment provision or both, and the contract can be net settled by means outside the contract or delivery of an asset. Includes assets elected not to be offset. Excludes assets not subject to a master netting arrangement. Reference 1: http://www.xbrl.org/2003/role/exampleRef
-Topic 210
-SubTopic 20
-Name Accounting Standards Codification
-Section 55
-Paragraph 22
-Publisher FASB
-URI https://asc.fasb.org//1943274/2147483444/210-20-55-22
Reference 2: http://www.xbrl.org/2003/role/disclosureRef
-Topic 210
-SubTopic 20
-Name Accounting Standards Codification
-Section 50
-Paragraph 3
-Subparagraph (a)
-Publisher FASB
-URI https://asc.fasb.org//1943274/2147483466/210-20-50-3
Reference 3: http://fasb.org/us-gaap/role/ref/legacyRef
-Topic 210
-SubTopic 20
-Name Accounting Standards Codification
-Section 55
-Paragraph 7
-Publisher FASB
-URI https://asc.fasb.org//1943274/2147483444/210-20-55-7
Reference 4: http://fasb.org/us-gaap/role/ref/legacyRef
-Name Accounting Standards Codification
-Topic 815
-SubTopic 10
-Section 50
-Paragraph 4B
-Subparagraph (a),(c)
-Publisher FASB
-URI https://asc.fasb.org//1943274/2147480434/815-10-50-4B
Reference 5: http://fasb.org/us-gaap/role/ref/legacyRef
-Name Accounting Standards Codification
-Section 50
-Paragraph 4D
-Subparagraph (c)(2)
-SubTopic 20
-Topic 860
-Publisher FASB
-URI https://asc.fasb.org//1943274/2147481326/860-20-50-4D
| Name: |
us-gaap_DerivativeFairValueOfDerivativeAsset |
| Namespace Prefix: |
us-gaap_ |
| Data Type: |
xbrli:monetaryItemType |
| Balance Type: |
debit |
| Period Type: |
instant |
|
| X |
- DefinitionFair value, before effects of master netting arrangements, of a financial liability or contract with one or more underlyings, notional amount or payment provision or both, and the contract can be net settled by means outside the contract or delivery of an asset. Includes liabilities elected not to be offset. Excludes liabilities not subject to a master netting arrangement. Reference 1: http://www.xbrl.org/2003/role/exampleRef
-Topic 210
-SubTopic 20
-Name Accounting Standards Codification
-Section 55
-Paragraph 22
-Publisher FASB
-URI https://asc.fasb.org//1943274/2147483444/210-20-55-22
Reference 2: http://www.xbrl.org/2003/role/disclosureRef
-Topic 210
-SubTopic 20
-Name Accounting Standards Codification
-Section 50
-Paragraph 3
-Subparagraph (a)
-Publisher FASB
-URI https://asc.fasb.org//1943274/2147483466/210-20-50-3
Reference 3: http://fasb.org/us-gaap/role/ref/legacyRef
-Topic 210
-SubTopic 20
-Name Accounting Standards Codification
-Section 55
-Paragraph 7
-Publisher FASB
-URI https://asc.fasb.org//1943274/2147483444/210-20-55-7
Reference 4: http://fasb.org/us-gaap/role/ref/legacyRef
-Name Accounting Standards Codification
-Topic 815
-SubTopic 10
-Section 50
-Paragraph 4B
-Subparagraph (a),(c)
-Publisher FASB
-URI https://asc.fasb.org//1943274/2147480434/815-10-50-4B
Reference 5: http://fasb.org/us-gaap/role/ref/legacyRef
-Name Accounting Standards Codification
-Section 50
-Paragraph 4D
-Subparagraph (c)(2)
-SubTopic 20
-Topic 860
-Publisher FASB
-URI https://asc.fasb.org//1943274/2147481326/860-20-50-4D
| Name: |
us-gaap_DerivativeFairValueOfDerivativeLiability |
| Namespace Prefix: |
us-gaap_ |
| Data Type: |
xbrli:monetaryItemType |
| Balance Type: |
credit |
| Period Type: |
instant |
|
| X |
- DefinitionLine items represent financial concepts included in a table. These concepts are used to disclose reportable information associated with domain members defined in one or many axes to the table.
| Name: |
us-gaap_DerivativesFairValueLineItems |
| Namespace Prefix: |
us-gaap_ |
| Data Type: |
xbrli:stringItemType |
| Balance Type: |
na |
| Period Type: |
duration |
|
| X |
- Details
| Name: |
us-gaap_DerivativeInstrumentRiskAxis=tg_AluminumFuturesContractsMember |
| Namespace Prefix: |
|
| Data Type: |
na |
| Balance Type: |
|
| Period Type: |
|
|
| X |
- Details
| Name: |
us-gaap_HedgingDesignationAxis=us-gaap_DesignatedAsHedgingInstrumentMember |
| Namespace Prefix: |
|
| Data Type: |
na |
| Balance Type: |
|
| Period Type: |
|
|
| X |
- Details
| Name: |
us-gaap_BalanceSheetLocationAxis=tg_AccruedExpensesMember |
| Namespace Prefix: |
|
| Data Type: |
na |
| Balance Type: |
|
| Period Type: |
|
|
| X |
- Details
| Name: |
us-gaap_BalanceSheetLocationAxis=us-gaap_PrepaidExpensesAndOtherCurrentAssetsMember |
| Namespace Prefix: |
|
| Data Type: |
na |
| Balance Type: |
|
| Period Type: |
|
|
| X |
- Details
| Name: |
us-gaap_BalanceSheetLocationAxis=us-gaap_OtherNoncurrentAssetsMember |
| Namespace Prefix: |
|
| Data Type: |
na |
| Balance Type: |
|
| Period Type: |
|
|
| X |
- Details
| Name: |
us-gaap_BalanceSheetLocationAxis=us-gaap_OtherNoncurrentLiabilitiesMember |
| Namespace Prefix: |
|
| Data Type: |
na |
| Balance Type: |
|
| Period Type: |
|
|
v3.23.2
Derivative Financial Instruments Terphane Future Cash Flow Hedges (Details) - Terphane Ltda [Member]
R$ in Thousands, $ in Thousands |
Jun. 30, 2023
USD ($)
|
Jun. 30, 2023
BRL (R$)
|
| Derivative [Line Items] |
|
|
| Derivative, Notional Amount |
$ 19,970
|
R$ 115,443
|
| Foreign Currency Exchange Rate, Translation |
5.7808
|
5.7808
|
| Percentage of Coverage Using Cash Flow Hedges |
40.00%
|
40.00%
|
| Jul-23 [Member] |
|
|
| Derivative [Line Items] |
|
|
| Derivative, Notional Amount |
$ 2,154
|
R$ 12,144
|
| Foreign Currency Exchange Rate, Translation |
5.6378
|
5.6378
|
| Percentage of Coverage Using Cash Flow Hedges |
83.00%
|
83.00%
|
| Aug-23 [Member] |
|
|
| Derivative [Line Items] |
|
|
| Derivative, Notional Amount |
$ 2,020
|
R$ 11,480
|
| Foreign Currency Exchange Rate, Translation |
5.6831
|
5.6831
|
| Percentage of Coverage Using Cash Flow Hedges |
78.00%
|
78.00%
|
| Sep-23 [Member] |
|
|
| Derivative [Line Items] |
|
|
| Derivative, Notional Amount |
$ 2,071
|
R$ 11,841
|
| Foreign Currency Exchange Rate, Translation |
5.7174
|
5.7174
|
| Percentage of Coverage Using Cash Flow Hedges |
80.00%
|
80.00%
|
| Oct-23 [Member] |
|
|
| Derivative [Line Items] |
|
|
| Derivative, Notional Amount |
$ 2,013
|
R$ 11,586
|
| Foreign Currency Exchange Rate, Translation |
5.7556
|
5.7556
|
| Percentage of Coverage Using Cash Flow Hedges |
79.00%
|
79.00%
|
| Nov-23 [Member] |
|
|
| Derivative [Line Items] |
|
|
| Derivative, Notional Amount |
$ 2,018
|
R$ 11,671
|
| Foreign Currency Exchange Rate, Translation |
5.7836
|
5.7836
|
| Percentage of Coverage Using Cash Flow Hedges |
79.00%
|
79.00%
|
| Dec-23 [Member] |
|
|
| Derivative [Line Items] |
|
|
| Derivative, Notional Amount |
$ 1,786
|
R$ 10,414
|
| Foreign Currency Exchange Rate, Translation |
5.8312
|
5.8312
|
| Percentage of Coverage Using Cash Flow Hedges |
71.00%
|
71.00%
|
| Jan-24 |
|
|
| Derivative [Line Items] |
|
|
| Derivative, Notional Amount |
$ 659
|
R$ 3,780
|
| Foreign Currency Exchange Rate, Translation |
5.7360
|
5.7360
|
| Percentage of Coverage Using Cash Flow Hedges |
23.00%
|
23.00%
|
| Feb-24 |
|
|
| Derivative [Line Items] |
|
|
| Derivative, Notional Amount |
$ 659
|
R$ 3,793
|
| Foreign Currency Exchange Rate, Translation |
5.7562
|
5.7562
|
| Percentage of Coverage Using Cash Flow Hedges |
23.00%
|
23.00%
|
| Mar-24 |
|
|
| Derivative [Line Items] |
|
|
| Derivative, Notional Amount |
$ 659
|
R$ 3,807
|
| Foreign Currency Exchange Rate, Translation |
5.7774
|
5.7774
|
| Percentage of Coverage Using Cash Flow Hedges |
23.00%
|
23.00%
|
| Apr-24 [Member] |
|
|
| Derivative [Line Items] |
|
|
| Derivative, Notional Amount |
$ 659
|
R$ 3,822
|
| Foreign Currency Exchange Rate, Translation |
5.8000
|
5.8000
|
| Percentage of Coverage Using Cash Flow Hedges |
23.00%
|
23.00%
|
| May-24 [Member] |
|
|
| Derivative [Line Items] |
|
|
| Derivative, Notional Amount |
$ 659
|
R$ 3,836
|
| Foreign Currency Exchange Rate, Translation |
5.8207
|
5.8207
|
| Percentage of Coverage Using Cash Flow Hedges |
24.00%
|
24.00%
|
| Jun-24 [Member] |
|
|
| Derivative [Line Items] |
|
|
| Derivative, Notional Amount |
$ 659
|
R$ 3,850
|
| Foreign Currency Exchange Rate, Translation |
5.8419
|
5.8419
|
| Percentage of Coverage Using Cash Flow Hedges |
24.00%
|
24.00%
|
| Jul-24 [Member] |
|
|
| Derivative [Line Items] |
|
|
| Derivative, Notional Amount |
$ 659
|
R$ 3,864
|
| Foreign Currency Exchange Rate, Translation |
5.8636
|
5.8636
|
| Percentage of Coverage Using Cash Flow Hedges |
24.00%
|
24.00%
|
| Aug-24 [Member] |
|
|
| Derivative [Line Items] |
|
|
| Derivative, Notional Amount |
$ 659
|
R$ 3,880
|
| Foreign Currency Exchange Rate, Translation |
5.8872
|
5.8872
|
| Percentage of Coverage Using Cash Flow Hedges |
24.00%
|
24.00%
|
| Sep-24 [Member] |
|
|
| Derivative [Line Items] |
|
|
| Derivative, Notional Amount |
$ 659
|
R$ 3,896
|
| Foreign Currency Exchange Rate, Translation |
5.9118
|
5.9118
|
| Percentage of Coverage Using Cash Flow Hedges |
24.00%
|
24.00%
|
| Oct-24 |
|
|
| Derivative [Line Items] |
|
|
| Derivative, Notional Amount |
$ 659
|
R$ 3,911
|
| Foreign Currency Exchange Rate, Translation |
5.9350
|
5.9350
|
| Percentage of Coverage Using Cash Flow Hedges |
24.00%
|
24.00%
|
| Nov-24 |
|
|
| Derivative [Line Items] |
|
|
| Derivative, Notional Amount |
$ 659
|
R$ 3,926
|
| Foreign Currency Exchange Rate, Translation |
5.9581
|
5.9581
|
| Percentage of Coverage Using Cash Flow Hedges |
24.00%
|
24.00%
|
| Dec-24 |
|
|
| Derivative [Line Items] |
|
|
| Derivative, Notional Amount |
$ 659
|
R$ 3,942
|
| Foreign Currency Exchange Rate, Translation |
5.9813
|
5.9813
|
| Percentage of Coverage Using Cash Flow Hedges |
24.00%
|
24.00%
|
| X |
- DefinitionPercentage of Coverage Using Cash Flow Hedges
| Name: |
tg_PercentageofCoverageUsingCashFlowHedges |
| Namespace Prefix: |
tg_ |
| Data Type: |
dtr-types1:percentItemType |
| Balance Type: |
na |
| Period Type: |
instant |
|
| X |
- DefinitionLine items represent financial concepts included in a table. These concepts are used to disclose reportable information associated with domain members defined in one or many axes to the table. Reference 1: http://www.xbrl.org/2003/role/disclosureRef
-Topic 815
-SubTopic 40
-Name Accounting Standards Codification
-Section 50
-Paragraph 5
-Subparagraph (f)
-Publisher FASB
-URI https://asc.fasb.org//1943274/2147480237/815-40-50-5
| Name: |
us-gaap_DerivativeLineItems |
| Namespace Prefix: |
us-gaap_ |
| Data Type: |
xbrli:stringItemType |
| Balance Type: |
na |
| Period Type: |
duration |
|
| X |
- DefinitionNominal or face amount used to calculate payment on derivative. Reference 1: http://www.xbrl.org/2009/role/commonPracticeRef
-Topic 815
-SubTopic 10
-Name Accounting Standards Codification
-Section 50
-Paragraph 1B
-Publisher FASB
-URI https://asc.fasb.org//1943274/2147480434/815-10-50-1B
Reference 2: http://www.xbrl.org/2009/role/commonPracticeRef
-Topic 815
-SubTopic 10
-Name Accounting Standards Codification
-Section 50
-Paragraph 1A
-Subparagraph (d)
-Publisher FASB
-URI https://asc.fasb.org//1943274/2147480434/815-10-50-1A
| Name: |
us-gaap_DerivativeNotionalAmount |
| Namespace Prefix: |
us-gaap_ |
| Data Type: |
xbrli:monetaryItemType |
| Balance Type: |
na |
| Period Type: |
instant |
|
| X |
- DefinitionForeign exchange rate used to translate amounts denominated in functional currency to reporting currency. Reference 1: http://www.xbrl.org/2003/role/disclosureRef
-Topic 830
-SubTopic 30
-Name Accounting Standards Codification
-Section 50
-Paragraph 2
-Publisher FASB
-URI https://asc.fasb.org//1943274/2147481674/830-30-50-2
Reference 2: http://www.xbrl.org/2003/role/disclosureRef
-Topic 830
-SubTopic 30
-Name Accounting Standards Codification
-Section S99
-Paragraph 1
-Publisher FASB
-URI https://asc.fasb.org//1943274/2147479424/830-30-S99-1
| Name: |
us-gaap_ForeignCurrencyExchangeRateTranslation1 |
| Namespace Prefix: |
us-gaap_ |
| Data Type: |
xbrli:pureItemType |
| Balance Type: |
na |
| Period Type: |
instant |
|
| X |
- Details
| Name: |
us-gaap_DerivativeInstrumentRiskAxis=tg_TerphaneLtdaMember |
| Namespace Prefix: |
|
| Data Type: |
na |
| Balance Type: |
|
| Period Type: |
|
|
| X |
- Details
| Name: |
tg_CashFlowHedgeMaturityDateAxis=tg_Jul23Member |
| Namespace Prefix: |
|
| Data Type: |
na |
| Balance Type: |
|
| Period Type: |
|
|
| X |
- Details
| Name: |
tg_CashFlowHedgeMaturityDateAxis=tg_Aug23Member |
| Namespace Prefix: |
|
| Data Type: |
na |
| Balance Type: |
|
| Period Type: |
|
|
| X |
- Details
| Name: |
tg_CashFlowHedgeMaturityDateAxis=tg_Sep23Member |
| Namespace Prefix: |
|
| Data Type: |
na |
| Balance Type: |
|
| Period Type: |
|
|
| X |
- Details
| Name: |
tg_CashFlowHedgeMaturityDateAxis=tg_Oct23Member |
| Namespace Prefix: |
|
| Data Type: |
na |
| Balance Type: |
|
| Period Type: |
|
|
| X |
- Details
| Name: |
tg_CashFlowHedgeMaturityDateAxis=tg_Nov23Member |
| Namespace Prefix: |
|
| Data Type: |
na |
| Balance Type: |
|
| Period Type: |
|
|
| X |
- Details
| Name: |
tg_CashFlowHedgeMaturityDateAxis=tg_Dec23Member |
| Namespace Prefix: |
|
| Data Type: |
na |
| Balance Type: |
|
| Period Type: |
|
|
| X |
- Details
| Name: |
tg_CashFlowHedgeMaturityDateAxis=tg_Jan24Member |
| Namespace Prefix: |
|
| Data Type: |
na |
| Balance Type: |
|
| Period Type: |
|
|
| X |
- Details
| Name: |
tg_CashFlowHedgeMaturityDateAxis=tg_Feb24Member |
| Namespace Prefix: |
|
| Data Type: |
na |
| Balance Type: |
|
| Period Type: |
|
|
| X |
- Details
| Name: |
tg_CashFlowHedgeMaturityDateAxis=tg_Mar24Member |
| Namespace Prefix: |
|
| Data Type: |
na |
| Balance Type: |
|
| Period Type: |
|
|
| X |
- Details
| Name: |
tg_CashFlowHedgeMaturityDateAxis=tg_Apr24Member |
| Namespace Prefix: |
|
| Data Type: |
na |
| Balance Type: |
|
| Period Type: |
|
|
| X |
- Details
| Name: |
tg_CashFlowHedgeMaturityDateAxis=tg_May24Member |
| Namespace Prefix: |
|
| Data Type: |
na |
| Balance Type: |
|
| Period Type: |
|
|
| X |
- Details
| Name: |
tg_CashFlowHedgeMaturityDateAxis=tg_Jun24Member |
| Namespace Prefix: |
|
| Data Type: |
na |
| Balance Type: |
|
| Period Type: |
|
|
| X |
- Details
| Name: |
tg_CashFlowHedgeMaturityDateAxis=tg_Jul24Member |
| Namespace Prefix: |
|
| Data Type: |
na |
| Balance Type: |
|
| Period Type: |
|
|
| X |
- Details
| Name: |
tg_CashFlowHedgeMaturityDateAxis=tg_Aug24Member |
| Namespace Prefix: |
|
| Data Type: |
na |
| Balance Type: |
|
| Period Type: |
|
|
| X |
- Details
| Name: |
tg_CashFlowHedgeMaturityDateAxis=tg_Sep24Member |
| Namespace Prefix: |
|
| Data Type: |
na |
| Balance Type: |
|
| Period Type: |
|
|
| X |
- Details
| Name: |
tg_CashFlowHedgeMaturityDateAxis=tg_Oct24Member |
| Namespace Prefix: |
|
| Data Type: |
na |
| Balance Type: |
|
| Period Type: |
|
|
| X |
- Details
| Name: |
tg_CashFlowHedgeMaturityDateAxis=tg_Nov24Member |
| Namespace Prefix: |
|
| Data Type: |
na |
| Balance Type: |
|
| Period Type: |
|
|
| X |
- Details
| Name: |
tg_CashFlowHedgeMaturityDateAxis=tg_Dec24Member |
| Namespace Prefix: |
|
| Data Type: |
na |
| Balance Type: |
|
| Period Type: |
|
|
v3.23.2
Derivative Financial Instruments (Schedule Of Pretax Effect On Net Income (Loss) And Other Comprehensive Income (Loss) Of Derivative Instruments Classified As Cash Flow Hedges) (Details) - Cash Flow Hedging - USD ($)
$ in Thousands |
3 Months Ended |
6 Months Ended |
Jun. 30, 2023 |
Jun. 30, 2022 |
Jun. 30, 2023 |
Jun. 30, 2022 |
| Aluminum Futures Contracts | Cost of goods sold |
|
|
|
|
| Derivative Instruments, Gain (Loss) [Line Items] |
|
|
|
|
| Amount of pre-tax gain (loss) recognized in other comprehensive income (loss) |
$ 557
|
$ (9,923)
|
$ 1,959
|
$ (3,741)
|
| Amount of pre-tax gain (loss) reclassified from accumulated other comprehensive income (loss) to net income (effective portion) |
885
|
293
|
1,557
|
1,298
|
| Foreign Currency Forwards | Cost of goods sold |
|
|
|
|
| Derivative Instruments, Gain (Loss) [Line Items] |
|
|
|
|
| Amount of pre-tax gain (loss) recognized in other comprehensive income (loss) |
0
|
0
|
0
|
0
|
| Amount of pre-tax gain (loss) reclassified from accumulated other comprehensive income (loss) to net income (effective portion) |
15
|
15
|
30
|
30
|
| Foreign Currency Forwards | Selling, general & admin |
|
|
|
|
| Derivative Instruments, Gain (Loss) [Line Items] |
|
|
|
|
| Amount of pre-tax gain (loss) recognized in other comprehensive income (loss) |
1,931
|
(1,758)
|
3,606
|
2,063
|
| Amount of pre-tax gain (loss) reclassified from accumulated other comprehensive income (loss) to net income (effective portion) |
$ 721
|
$ 532
|
$ 1,007
|
$ 669
|
| X |
- DefinitionLine items represent financial concepts included in a table. These concepts are used to disclose reportable information associated with domain members defined in one or many axes to the table. Reference 1: http://www.xbrl.org/2003/role/disclosureRef
-Topic 815
-SubTopic 10
-Name Accounting Standards Codification
-Section 50
-Paragraph 4E
-Publisher FASB
-URI https://asc.fasb.org//1943274/2147480434/815-10-50-4E
| Name: |
us-gaap_DerivativeInstrumentsGainLossLineItems |
| Namespace Prefix: |
us-gaap_ |
| Data Type: |
xbrli:stringItemType |
| Balance Type: |
na |
| Period Type: |
duration |
|
| X |
- DefinitionAmount, before tax and reclassification, of gain (loss) from derivative instrument designated and qualifying cash flow hedge included in assessment of hedge effectiveness. Reference 1: http://www.xbrl.org/2003/role/disclosureRef
-Topic 220
-SubTopic 10
-Name Accounting Standards Codification
-Section 45
-Paragraph 11
-Publisher FASB
-URI https://asc.fasb.org//1943274/2147482790/220-10-45-11
Reference 2: http://www.xbrl.org/2003/role/disclosureRef
-Topic 815
-SubTopic 10
-Name Accounting Standards Codification
-Section 50
-Paragraph 4C
-Subparagraph (b)
-Publisher FASB
-URI https://asc.fasb.org//1943274/2147480434/815-10-50-4C
Reference 3: http://www.xbrl.org/2003/role/disclosureRef
-Topic 815
-SubTopic 20
-Name Accounting Standards Codification
-Section 45
-Paragraph 3
-Publisher FASB
-URI https://asc.fasb.org//1943274/2147480627/815-20-45-3
Reference 4: http://www.xbrl.org/2003/role/disclosureRef
-Topic 815
-SubTopic 10
-Name Accounting Standards Codification
-Section 50
-Paragraph 4A
-Subparagraph (b)(2)
-Publisher FASB
-URI https://asc.fasb.org//1943274/2147480434/815-10-50-4A
Reference 5: http://www.xbrl.org/2003/role/disclosureRef
-Topic 220
-SubTopic 10
-Name Accounting Standards Codification
-Section 45
-Paragraph 10A
-Subparagraph (d)
-Publisher FASB
-URI https://asc.fasb.org//1943274/2147482790/220-10-45-10A
| Name: |
us-gaap_OtherComprehensiveIncomeLossCashFlowHedgeGainLossBeforeReclassificationAndTax |
| Namespace Prefix: |
us-gaap_ |
| Data Type: |
xbrli:monetaryItemType |
| Balance Type: |
credit |
| Period Type: |
duration |
|
| X |
- DefinitionAmount, before tax, of reclassification of gain (loss) from accumulated other comprehensive income (AOCI) for derivative instrument designated and qualifying as cash flow hedge included in assessment of hedge effectiveness. Reference 1: http://www.xbrl.org/2003/role/disclosureRef
-Topic 220
-SubTopic 10
-Name Accounting Standards Codification
-Section 45
-Paragraph 11
-Publisher FASB
-URI https://asc.fasb.org//1943274/2147482790/220-10-45-11
Reference 2: http://www.xbrl.org/2003/role/disclosureRef
-Topic 220
-SubTopic 10
-Name Accounting Standards Codification
-Section 45
-Paragraph 15
-Publisher FASB
-URI https://asc.fasb.org//1943274/2147482790/220-10-45-15
Reference 3: http://www.xbrl.org/2003/role/disclosureRef
-Name Accounting Standards Codification
-Section 50
-Paragraph 4C
-Subparagraph (c)
-SubTopic 10
-Topic 815
-Publisher FASB
-URI https://asc.fasb.org//1943274/2147480434/815-10-50-4C
| Name: |
us-gaap_OtherComprehensiveIncomeLossCashFlowHedgeGainLossReclassificationBeforeTax |
| Namespace Prefix: |
us-gaap_ |
| Data Type: |
xbrli:monetaryItemType |
| Balance Type: |
debit |
| Period Type: |
duration |
|
| X |
- Details
| Name: |
us-gaap_DerivativeInstrumentRiskAxis=tg_AluminumFuturesContractsMember |
| Namespace Prefix: |
|
| Data Type: |
na |
| Balance Type: |
|
| Period Type: |
|
|
| X |
- Details
| Name: |
us-gaap_IncomeStatementLocationAxis=us-gaap_CostOfSalesMember |
| Namespace Prefix: |
|
| Data Type: |
na |
| Balance Type: |
|
| Period Type: |
|
|
| X |
- Details
| Name: |
us-gaap_DerivativeInstrumentsGainLossByHedgingRelationshipAxis=us-gaap_CashFlowHedgingMember |
| Namespace Prefix: |
|
| Data Type: |
na |
| Balance Type: |
|
| Period Type: |
|
|
| X |
- Details
| Name: |
us-gaap_DerivativeInstrumentRiskAxis=tg_ForeignCurrencyForwardsAndOptionsMember |
| Namespace Prefix: |
|
| Data Type: |
na |
| Balance Type: |
|
| Period Type: |
|
|
| X |
- Details
| Name: |
us-gaap_IncomeStatementLocationAxis=us-gaap_SellingGeneralAndAdministrativeExpensesMember |
| Namespace Prefix: |
|
| Data Type: |
na |
| Balance Type: |
|
| Period Type: |
|
|
v3.23.2
Income Taxes - Narrative (Details) - USD ($)
$ in Thousands |
3 Months Ended |
6 Months Ended |
Jun. 30, 2023 |
Jun. 30, 2022 |
Jun. 30, 2023 |
Jun. 30, 2022 |
| Income Taxes [Line Items] |
|
|
|
|
| Income Tax Expense (Benefit) |
$ (3,331)
|
$ 5,556
|
$ (3,000)
|
$ 6,334
|
| Income (loss) before income taxes |
$ (22,253)
|
$ 20,425
|
$ (22,934)
|
$ 37,626
|
| Effective Income Tax Rate Reconciliation, Percent |
|
|
13.10%
|
16.90%
|
| Foreign Tax Credit - Brazil |
|
|
$ 400
|
$ 2,600
|
| Terphane Ltda [Member] |
|
|
|
|
| Income Taxes [Line Items] |
|
|
|
|
| Current Effective Tax Rate Including Social Contribution On Income |
|
|
15.25%
|
|
| Brazilian |
|
|
|
|
| Income Taxes [Line Items] |
|
|
|
|
| Effective Income Tax Rate Reconciliation Federal Statutory Tax Rate Including Social Contribution On Income |
|
|
34.00%
|
|
| Effective Income Tax Rate Reconciliation Federal Statutory Tax Rate Excluding Social Contribution On Income |
|
|
25.00%
|
|
| Effective income tax rate reconciliation social contribution on income |
|
|
9.00%
|
|
| X |
- DefinitionCurrent Effective Tax Rate Including Social Contribution On Income
| Name: |
tg_CurrentEffectiveTaxRateIncludingSocialContributionOnIncome |
| Namespace Prefix: |
tg_ |
| Data Type: |
dtr-types1:percentItemType |
| Balance Type: |
na |
| Period Type: |
duration |
|
| X |
- DefinitionForeign Tax Credit - Brazil
| Name: |
tg_ForeignTaxCreditBrazil |
| Namespace Prefix: |
tg_ |
| Data Type: |
xbrli:monetaryItemType |
| Balance Type: |
debit |
| Period Type: |
duration |
|
v3.23.2
Segment Reporting (Schedule Of Segment Reporting Information By Segment) (Details) - USD ($)
$ in Thousands |
1 Months Ended |
3 Months Ended |
6 Months Ended |
Jan. 31, 2023 |
Jun. 30, 2023 |
Jun. 30, 2022 |
Jun. 30, 2023 |
Jun. 30, 2022 |
| Segment Reporting Information [Line Items] |
|
|
|
|
|
| Sales |
|
$ 170,968
|
$ 263,327
|
$ 356,046
|
$ 491,811
|
| Sales as shown in the condensed consolidated statements of income (loss) |
|
178,167
|
274,363
|
369,289
|
510,929
|
| Goodwill, Impairment Loss |
|
(15,413)
|
0
|
(15,413)
|
0
|
| Total Segment Income (Loss) |
|
(10,400)
|
30,209
|
113
|
59,553
|
| Interest income |
|
30
|
3
|
74
|
32
|
| Interest expense |
|
2,374
|
1,234
|
4,686
|
2,020
|
| Gain on investment in kaléo |
|
|
|
(262)
|
(1,406)
|
| Stock option-based compensation costs |
|
0
|
251
|
231
|
882
|
| Corporate expenses, net |
|
9,509
|
9,708
|
18,466
|
20,463
|
| Income (loss) before income taxes |
|
(22,253)
|
20,425
|
(22,934)
|
37,626
|
| Income Tax Expense (Benefit) |
|
(3,331)
|
5,556
|
(3,000)
|
6,334
|
| Net income (loss) |
|
(18,922)
|
14,869
|
(19,934)
|
31,292
|
| kaleo [Member] |
|
|
|
|
|
| Segment Reporting Information [Line Items] |
|
|
|
|
|
| Gain on investment in kaléo |
$ 0
|
|
1,406
|
262
|
1,406
|
| Freight |
|
|
|
|
|
| Segment Reporting Information [Line Items] |
|
|
|
|
|
| Cost of Goods and Services Sold |
|
7,199
|
11,036
|
13,243
|
19,118
|
| Aluminum Extrusions [Member] |
|
|
|
|
|
| Segment Reporting Information [Line Items] |
|
|
|
|
|
| Sales |
|
121,827
|
190,308
|
255,197
|
348,417
|
| Earnings before interest, taxes, depreciation and amortization (EBITDA) |
|
10,217
|
21,895
|
24,855
|
45,814
|
| Depreciation, Depletion and Amortization |
|
(4,158)
|
(4,169)
|
(8,569)
|
(8,430)
|
| Earnings before interest and taxes (EBIT) |
|
6,059
|
17,726
|
16,286
|
37,384
|
| EBITDA |
|
155
|
16
|
(339)
|
(89)
|
| PE Films [Member] |
|
|
|
|
|
| Segment Reporting Information [Line Items] |
|
|
|
|
|
| Sales |
|
15,918
|
31,424
|
36,099
|
62,555
|
| Earnings before interest, taxes, depreciation and amortization (EBITDA) |
|
814
|
7,065
|
2,663
|
14,112
|
| Depreciation, Depletion and Amortization |
|
(1,552)
|
(1,559)
|
(3,195)
|
(3,154)
|
| Earnings before interest and taxes (EBIT) |
|
(738)
|
5,506
|
(532)
|
10,958
|
| EBITDA |
|
0
|
(50)
|
2
|
(153)
|
| Flexible Packaging Films [Member] |
|
|
|
|
|
| Segment Reporting Information [Line Items] |
|
|
|
|
|
| Earnings before interest, taxes, depreciation and amortization (EBITDA) |
|
249
|
7,631
|
1,599
|
12,665
|
| Depreciation, Depletion and Amortization |
|
(711)
|
(583)
|
(1,411)
|
(1,132)
|
| Earnings before interest and taxes (EBIT) |
|
(462)
|
7,048
|
188
|
11,533
|
| EBITDA |
|
|
|
(79)
|
(80)
|
| Flexible Packaging Films [Member] [Domain] |
|
|
|
|
|
| Segment Reporting Information [Line Items] |
|
|
|
|
|
| Sales |
|
33,223
|
41,595
|
$ 64,750
|
$ 80,839
|
| EBITDA |
|
$ (1)
|
$ (37)
|
|
|
| X |
- DefinitionEarnings before interest and taxes (EBIT)
| Name: |
tg_EarningsBeforeInterestAndTaxesEBIT |
| Namespace Prefix: |
tg_ |
| Data Type: |
xbrli:monetaryItemType |
| Balance Type: |
debit |
| Period Type: |
duration |
|
| X |
- DefinitionEarnings before interest, taxes, depreciation and amortization (EBITDA)
| Name: |
tg_EarningsBeforeInterestTaxesDepreciationAndAmortizationEBITDA |
| Namespace Prefix: |
tg_ |
| Data Type: |
xbrli:monetaryItemType |
| Balance Type: |
debit |
| Period Type: |
duration |
|
| X |
- DefinitionAggregrate revenue during the period from the sales of goods in the normal course of business, after deducting returns, allowances, discounts, and charges for outbound freight.
| Name: |
tg_NetSales |
| Namespace Prefix: |
tg_ |
| Data Type: |
xbrli:monetaryItemType |
| Balance Type: |
credit |
| Period Type: |
duration |
|
| X |
- DefinitionGains or losses associated with plant shutdowns, asset impairments and restructurings, gains or losses from the sale of assets, goodwill impairment losses and other non-recurring items which are not associated with the ongoing operations of a segment.
| Name: |
tg_PlantShutdownsAssetImpairmentsRestructuringAndOther |
| Namespace Prefix: |
tg_ |
| Data Type: |
xbrli:monetaryItemType |
| Balance Type: |
credit |
| Period Type: |
duration |
|
| X |
- DefinitionTotal income and loss before income expenses associated with a specific segment. Includes income/loss from ongoing operations; plant shutdowns, asset impairments, restructurings and other non-recurring charges; and goodwill impairment charges.
| Name: |
tg_TotalIncomeLossAssociatedWithSegments |
| Namespace Prefix: |
tg_ |
| Data Type: |
xbrli:monetaryItemType |
| Balance Type: |
credit |
| Period Type: |
duration |
|
| X |
- DefinitionThe aggregate costs related to goods produced and sold and services rendered by an entity during the reporting period. This excludes costs incurred during the reporting period related to financial services rendered and other revenue generating activities. Reference 1: http://www.xbrl.org/2003/role/disclosureRef
-Topic 924
-SubTopic 10
-Name Accounting Standards Codification
-Section S99
-Paragraph 1
-Subparagraph (SAB Topic 11.L)
-Publisher FASB
-URI https://asc.fasb.org//1943274/2147479941/924-10-S99-1
Reference 2: http://fasb.org/us-gaap/role/ref/legacyRef
-Topic 220
-SubTopic 10
-Name Accounting Standards Codification
-Section S99
-Paragraph 2
-Subparagraph (SX 210.5-03.2(a),(d))
-Publisher FASB
-URI https://asc.fasb.org//1943274/2147483621/220-10-S99-2
| Name: |
us-gaap_CostOfGoodsAndServicesSold |
| Namespace Prefix: |
us-gaap_ |
| Data Type: |
xbrli:monetaryItemType |
| Balance Type: |
debit |
| Period Type: |
duration |
|
| X |
- DefinitionThe aggregate expense recognized in the current period that allocates the cost of tangible assets, intangible assets, or depleting assets to periods that benefit from use of the assets. Reference 1: http://fasb.org/us-gaap/role/ref/legacyRef
-Name Accounting Standards Codification
-Section 45
-Paragraph 28
-Subparagraph (b)
-SubTopic 10
-Topic 230
-Publisher FASB
-URI https://asc.fasb.org//1943274/2147482740/230-10-45-28
Reference 2: http://www.xbrl.org/2003/role/disclosureRef
-Topic 280
-SubTopic 10
-Name Accounting Standards Codification
-Section 50
-Paragraph 22
-Subparagraph (e)
-Publisher FASB
-URI https://asc.fasb.org//1943274/2147482810/280-10-50-22
| Name: |
us-gaap_DepreciationDepletionAndAmortization |
| Namespace Prefix: |
us-gaap_ |
| Data Type: |
xbrli:monetaryItemType |
| Balance Type: |
debit |
| Period Type: |
duration |
|
| X |
- DefinitionAmount of loss from the write-down of an asset representing the future economic benefits arising from other assets acquired in a business combination that are not individually identified and separately recognized. Reference 1: http://fasb.org/us-gaap/role/ref/legacyRef
-Name Accounting Standards Codification
-Section 45
-Paragraph 28
-Subparagraph (b)
-SubTopic 10
-Topic 230
-Publisher FASB
-URI https://asc.fasb.org//1943274/2147482740/230-10-45-28
Reference 2: http://www.xbrl.org/2003/role/exampleRef
-Topic 350
-SubTopic 20
-Name Accounting Standards Codification
-Section 55
-Paragraph 24
-Publisher FASB
-URI https://asc.fasb.org//1943274/2147482548/350-20-55-24
Reference 3: http://www.xbrl.org/2003/role/disclosureRef
-Topic 350
-SubTopic 20
-Name Accounting Standards Codification
-Section 50
-Paragraph 1
-Subparagraph (e)
-Publisher FASB
-URI https://asc.fasb.org//1943274/2147482573/350-20-50-1
Reference 4: http://www.xbrl.org/2003/role/disclosureRef
-Topic 350
-SubTopic 20
-Name Accounting Standards Codification
-Section 50
-Paragraph 2
-Subparagraph (b)
-Publisher FASB
-URI https://asc.fasb.org//1943274/2147482573/350-20-50-2
Reference 5: http://www.xbrl.org/2003/role/disclosureRef
-Topic 350
-SubTopic 20
-Name Accounting Standards Codification
-Section 45
-Paragraph 2
-Publisher FASB
-URI https://asc.fasb.org//1943274/2147482598/350-20-45-2
| Name: |
us-gaap_GoodwillImpairmentLoss |
| Namespace Prefix: |
us-gaap_ |
| Data Type: |
xbrli:monetaryItemType |
| Balance Type: |
debit |
| Period Type: |
duration |
|
| X |
- DefinitionInterest and debt related expenses associated with nonoperating financing activities of the entity. Reference 1: http://fasb.org/us-gaap/role/ref/legacyRef
-Name Accounting Standards Codification
-Section 50
-Paragraph 1
-SubTopic 20
-Topic 835
-Publisher FASB
-URI https://asc.fasb.org//1943274/2147483013/835-20-50-1
| Name: |
us-gaap_InterestAndDebtExpense |
| Namespace Prefix: |
us-gaap_ |
| Data Type: |
xbrli:monetaryItemType |
| Balance Type: |
debit |
| Period Type: |
duration |
|
| X |
- DefinitionAmount before accretion (amortization) of purchase discount (premium) of interest income on nonoperating securities. Reference 1: http://www.xbrl.org/2003/role/disclosureRef
-Topic 280
-SubTopic 10
-Name Accounting Standards Codification
-Section 50
-Paragraph 22
-Subparagraph (c)
-Publisher FASB
-URI https://asc.fasb.org//1943274/2147482810/280-10-50-22
Reference 2: http://fasb.org/us-gaap/role/ref/legacyRef
-Topic 220
-SubTopic 10
-Name Accounting Standards Codification
-Section S99
-Paragraph 2
-Subparagraph (SX 210.5-03.7(b))
-Publisher FASB
-URI https://asc.fasb.org//1943274/2147483621/220-10-S99-2
| Name: |
us-gaap_InvestmentIncomeInterest |
| Namespace Prefix: |
us-gaap_ |
| Data Type: |
xbrli:monetaryItemType |
| Balance Type: |
credit |
| Period Type: |
duration |
|
| X |
- DefinitionThe portion of profit or loss for the period, net of income taxes, which is attributable to the parent. Reference 1: http://www.xbrl.org/2003/role/disclosureRef
-Topic 235
-SubTopic 10
-Name Accounting Standards Codification
-Section S99
-Paragraph 1
-Subparagraph (SX 210.4-08(g)(1)(ii))
-Publisher FASB
-URI https://asc.fasb.org//1943274/2147480678/235-10-S99-1
Reference 2: http://www.xbrl.org/2003/role/disclosureRef
-Topic 323
-SubTopic 10
-Name Accounting Standards Codification
-Section 50
-Paragraph 3
-Subparagraph (c)
-Publisher FASB
-URI https://asc.fasb.org//1943274/2147481687/323-10-50-3
Reference 3: http://www.xbrl.org/2003/role/disclosureRef
-Topic 825
-SubTopic 10
-Name Accounting Standards Codification
-Section 50
-Paragraph 28
-Subparagraph (f)
-Publisher FASB
-URI https://asc.fasb.org//1943274/2147482907/825-10-50-28
Reference 4: http://www.xbrl.org/2003/role/disclosureRef
-Topic 220
-SubTopic 10
-Name Accounting Standards Codification
-Section 50
-Paragraph 6
-Publisher FASB
-URI https://asc.fasb.org//1943274/2147482765/220-10-50-6
Reference 5: http://www.xbrl.org/2003/role/disclosureRef
-Topic 250
-SubTopic 10
-Name Accounting Standards Codification
-Section 50
-Paragraph 3
-Publisher FASB
-URI https://asc.fasb.org//1943274/2147483443/250-10-50-3
Reference 6: http://www.xbrl.org/2003/role/disclosureRef
-Topic 250
-SubTopic 10
-Name Accounting Standards Codification
-Section 50
-Paragraph 1
-Subparagraph (b)(2)
-Publisher FASB
-URI https://asc.fasb.org//1943274/2147483443/250-10-50-1
Reference 7: http://www.xbrl.org/2003/role/disclosureRef
-Topic 815
-SubTopic 40
-Name Accounting Standards Codification
-Section 65
-Paragraph 1
-Subparagraph (f)
-Publisher FASB
-URI https://asc.fasb.org//1943274/2147480175/815-40-65-1
Reference 8: http://www.xbrl.org/2003/role/disclosureRef
-Topic 250
-SubTopic 10
-Name Accounting Standards Codification
-Section 50
-Paragraph 8
-Publisher FASB
-URI https://asc.fasb.org//1943274/2147483443/250-10-50-8
Reference 9: http://www.xbrl.org/2003/role/disclosureRef
-Topic 250
-SubTopic 10
-Name Accounting Standards Codification
-Section 50
-Paragraph 9
-Publisher FASB
-URI https://asc.fasb.org//1943274/2147483443/250-10-50-9
Reference 10: http://www.xbrl.org/2003/role/disclosureRef
-Topic 250
-SubTopic 10
-Name Accounting Standards Codification
-Section 50
-Paragraph 11
-Subparagraph (a)
-Publisher FASB
-URI https://asc.fasb.org//1943274/2147483443/250-10-50-11
Reference 11: http://www.xbrl.org/2003/role/disclosureRef
-Topic 250
-SubTopic 10
-Name Accounting Standards Codification
-Section 50
-Paragraph 11
-Subparagraph (b)
-Publisher FASB
-URI https://asc.fasb.org//1943274/2147483443/250-10-50-11
Reference 12: http://www.xbrl.org/2003/role/disclosureRef
-Topic 250
-SubTopic 10
-Name Accounting Standards Codification
-Section 50
-Paragraph 4
-Publisher FASB
-URI https://asc.fasb.org//1943274/2147483443/250-10-50-4
Reference 13: http://www.xbrl.org/2003/role/exampleRef
-Topic 946
-SubTopic 830
-Name Accounting Standards Codification
-Section 55
-Paragraph 10
-Publisher FASB
-URI https://asc.fasb.org//1943274/2147480167/946-830-55-10
Reference 14: http://www.xbrl.org/2003/role/disclosureRef
-Topic 946
-SubTopic 220
-Name Accounting Standards Codification
-Section 45
-Paragraph 7
-Publisher FASB
-URI https://asc.fasb.org//1943274/2147483581/946-220-45-7
Reference 15: http://www.xbrl.org/2003/role/disclosureRef
-Topic 944
-SubTopic 220
-Name Accounting Standards Codification
-Section S99
-Paragraph 1
-Subparagraph (SX 210.7-04(18))
-Publisher FASB
-URI https://asc.fasb.org//1943274/2147483586/944-220-S99-1
Reference 16: http://www.xbrl.org/2003/role/disclosureRef
-Topic 280
-SubTopic 10
-Name Accounting Standards Codification
-Section 50
-Paragraph 22
-Publisher FASB
-URI https://asc.fasb.org//1943274/2147482810/280-10-50-22
Reference 17: http://www.xbrl.org/2003/role/disclosureRef
-Topic 946
-SubTopic 220
-Name Accounting Standards Codification
-Section S99
-Paragraph 1
-Subparagraph (SX 210.6-07(9))
-Publisher FASB
-URI https://asc.fasb.org//1943274/2147483575/946-220-S99-1
Reference 18: http://www.xbrl.org/2003/role/disclosureRef
-Topic 946
-SubTopic 220
-Name Accounting Standards Codification
-Section S99
-Paragraph 3
-Subparagraph (SX 210.6-09(1)(d))
-Publisher FASB
-URI https://asc.fasb.org//1943274/2147483575/946-220-S99-3
Reference 19: http://www.xbrl.org/2003/role/disclosureRef
-Topic 470
-SubTopic 10
-Name Accounting Standards Codification
-Section S99
-Paragraph 1A
-Subparagraph (SX 210.13-01(a)(4)(i))
-Publisher FASB
-URI https://asc.fasb.org//1943274/2147480097/470-10-S99-1A
Reference 20: http://www.xbrl.org/2009/role/commonPracticeRef
-Topic 470
-SubTopic 10
-Name Accounting Standards Codification
-Section S99
-Paragraph 1A
-Subparagraph (SX 210.13-01(a)(4)(ii))
-Publisher FASB
-URI https://asc.fasb.org//1943274/2147480097/470-10-S99-1A
Reference 21: http://www.xbrl.org/2003/role/disclosureRef
-Topic 470
-SubTopic 10
-Name Accounting Standards Codification
-Section S99
-Paragraph 1A
-Subparagraph (SX 210.13-01(a)(4)(iii)(A))
-Publisher FASB
-URI https://asc.fasb.org//1943274/2147480097/470-10-S99-1A
Reference 22: http://www.xbrl.org/2003/role/disclosureRef
-Topic 470
-SubTopic 10
-Name Accounting Standards Codification
-Section S99
-Paragraph 1A
-Subparagraph (SX 210.13-01(a)(4)(iv))
-Publisher FASB
-URI https://asc.fasb.org//1943274/2147480097/470-10-S99-1A
Reference 23: http://www.xbrl.org/2003/role/disclosureRef
-Topic 470
-SubTopic 10
-Name Accounting Standards Codification
-Section S99
-Paragraph 1A
-Subparagraph (SX 210.13-01(a)(5))
-Publisher FASB
-URI https://asc.fasb.org//1943274/2147480097/470-10-S99-1A
Reference 24: http://www.xbrl.org/2003/role/disclosureRef
-Topic 470
-SubTopic 10
-Name Accounting Standards Codification
-Section S99
-Paragraph 1B
-Subparagraph (SX 210.13-02(a)(4)(i))
-Publisher FASB
-URI https://asc.fasb.org//1943274/2147480097/470-10-S99-1B
Reference 25: http://www.xbrl.org/2003/role/disclosureRef
-Topic 470
-SubTopic 10
-Name Accounting Standards Codification
-Section S99
-Paragraph 1B
-Subparagraph (SX 210.13-02(a)(4)(iii)(A))
-Publisher FASB
-URI https://asc.fasb.org//1943274/2147480097/470-10-S99-1B
Reference 26: http://www.xbrl.org/2003/role/disclosureRef
-Topic 470
-SubTopic 10
-Name Accounting Standards Codification
-Section S99
-Paragraph 1B
-Subparagraph (SX 210.13-02(a)(4)(iii)(B))
-Publisher FASB
-URI https://asc.fasb.org//1943274/2147480097/470-10-S99-1B
Reference 27: http://www.xbrl.org/2003/role/disclosureRef
-Topic 470
-SubTopic 10
-Name Accounting Standards Codification
-Section S99
-Paragraph 1B
-Subparagraph (SX 210.13-02(a)(4)(iv))
-Publisher FASB
-URI https://asc.fasb.org//1943274/2147480097/470-10-S99-1B
Reference 28: http://www.xbrl.org/2003/role/disclosureRef
-Topic 470
-SubTopic 10
-Name Accounting Standards Codification
-Section S99
-Paragraph 1B
-Subparagraph (SX 210.13-02(a)(5))
-Publisher FASB
-URI https://asc.fasb.org//1943274/2147480097/470-10-S99-1B
Reference 29: http://www.xbrl.org/2003/role/disclosureRef
-Topic 280
-SubTopic 10
-Name Accounting Standards Codification
-Section 50
-Paragraph 30
-Subparagraph (b)
-Publisher FASB
-URI https://asc.fasb.org//1943274/2147482810/280-10-50-30
Reference 30: http://www.xbrl.org/2003/role/disclosureRef
-Topic 280
-SubTopic 10
-Name Accounting Standards Codification
-Section 50
-Paragraph 32
-Subparagraph (f)
-Publisher FASB
-URI https://asc.fasb.org//1943274/2147482810/280-10-50-32
Reference 31: http://www.xbrl.org/2003/role/disclosureRef
-Topic 260
-SubTopic 10
-Name Accounting Standards Codification
-Section 45
-Paragraph 60B
-Subparagraph (a)
-Publisher FASB
-URI https://asc.fasb.org//1943274/2147482689/260-10-45-60B
Reference 32: http://www.xbrl.org/2003/role/exampleRef
-Topic 280
-SubTopic 10
-Name Accounting Standards Codification
-Section 50
-Paragraph 31
-Publisher FASB
-URI https://asc.fasb.org//1943274/2147482810/280-10-50-31
Reference 33: http://www.xbrl.org/2003/role/disclosureRef
-Topic 280
-SubTopic 10
-Name Accounting Standards Codification
-Section 50
-Paragraph 32
-Subparagraph (c)
-Publisher FASB
-URI https://asc.fasb.org//1943274/2147482810/280-10-50-32
Reference 34: http://www.xbrl.org/2003/role/disclosureRef
-Topic 205
-SubTopic 20
-Name Accounting Standards Codification
-Section 50
-Paragraph 7
-Publisher FASB
-URI https://asc.fasb.org//1943274/2147483499/205-20-50-7
Reference 35: http://fasb.org/us-gaap/role/ref/legacyRef
-Topic 230
-SubTopic 10
-Name Accounting Standards Codification
-Section 45
-Paragraph 28
-Publisher FASB
-URI https://asc.fasb.org//1943274/2147482740/230-10-45-28
Reference 36: http://www.xbrl.org/2003/role/disclosureRef
-Topic 220
-SubTopic 10
-Name Accounting Standards Codification
-Section 45
-Paragraph 1A
-Subparagraph (a)
-Publisher FASB
-URI https://asc.fasb.org//1943274/2147482790/220-10-45-1A
Reference 37: http://www.xbrl.org/2003/role/disclosureRef
-Topic 220
-SubTopic 10
-Name Accounting Standards Codification
-Section 45
-Paragraph 1B
-Subparagraph (a)
-Publisher FASB
-URI https://asc.fasb.org//1943274/2147482790/220-10-45-1B
Reference 38: http://fasb.org/us-gaap/role/ref/legacyRef
-Topic 220
-SubTopic 10
-Name Accounting Standards Codification
-Section S99
-Paragraph 2
-Subparagraph (SX 210.5-03(20))
-Publisher FASB
-URI https://asc.fasb.org//1943274/2147483621/220-10-S99-2
Reference 39: http://fasb.org/us-gaap/role/ref/legacyRef
-Topic 942
-SubTopic 220
-Name Accounting Standards Codification
-Section S99
-Paragraph 1
-Subparagraph (SX 210.9-04(22))
-Publisher FASB
-URI https://asc.fasb.org//1943274/2147483589/942-220-S99-1
| Name: |
us-gaap_NetIncomeLoss |
| Namespace Prefix: |
us-gaap_ |
| Data Type: |
xbrli:monetaryItemType |
| Balance Type: |
credit |
| Period Type: |
duration |
|
| X |
- DefinitionAmount of noncash expense for option under share-based payment arrangement. Reference 1: http://fasb.org/us-gaap/role/ref/legacyRef
-Name Accounting Standards Codification
-Section 45
-Paragraph 28
-Subparagraph (b)
-SubTopic 10
-Topic 230
-Publisher FASB
-URI https://asc.fasb.org//1943274/2147482740/230-10-45-28
| Name: |
us-gaap_StockOptionPlanExpense |
| Namespace Prefix: |
us-gaap_ |
| Data Type: |
xbrli:monetaryItemType |
| Balance Type: |
debit |
| Period Type: |
duration |
|
| X |
- DefinitionAmount of unrealized gain (loss) on investment. Reference 1: http://fasb.org/us-gaap/role/ref/legacyRef
-Name Accounting Standards Codification
-Section 45
-Paragraph 28
-Subparagraph (b)
-SubTopic 10
-Topic 230
-Publisher FASB
-URI https://asc.fasb.org//1943274/2147482740/230-10-45-28
| Name: |
us-gaap_UnrealizedGainLossOnInvestments |
| Namespace Prefix: |
us-gaap_ |
| Data Type: |
xbrli:monetaryItemType |
| Balance Type: |
credit |
| Period Type: |
duration |
|
| X |
- Details
| Name: |
dei_LegalEntityAxis=tg_KaleoMember |
| Namespace Prefix: |
|
| Data Type: |
na |
| Balance Type: |
|
| Period Type: |
|
|
| X |
- Details
| Name: |
srt_ProductOrServiceAxis=us-gaap_ShippingAndHandlingMember |
| Namespace Prefix: |
|
| Data Type: |
na |
| Balance Type: |
|
| Period Type: |
|
|
| X |
- Details
| Name: |
us-gaap_StatementBusinessSegmentsAxis=tg_AluminumExtrusionsMember |
| Namespace Prefix: |
|
| Data Type: |
na |
| Balance Type: |
|
| Period Type: |
|
|
| X |
- Details
| Name: |
us-gaap_StatementBusinessSegmentsAxis=tg_PEFilmsMember |
| Namespace Prefix: |
|
| Data Type: |
na |
| Balance Type: |
|
| Period Type: |
|
|
| X |
- Details
| Name: |
us-gaap_StatementBusinessSegmentsAxis=tg_FlexiblePackagingFilmsMember |
| Namespace Prefix: |
|
| Data Type: |
na |
| Balance Type: |
|
| Period Type: |
|
|
| X |
- Details
| Name: |
us-gaap_StatementBusinessSegmentsAxis=tg_FlexiblePackagingFilmsMemberDomain |
| Namespace Prefix: |
|
| Data Type: |
na |
| Balance Type: |
|
| Period Type: |
|
|
v3.23.2
Segment Reporting (Schedule Of Identifiable Assets By Segment) (Details) - USD ($)
$ in Thousands |
Jun. 30, 2023 |
Dec. 31, 2022 |
Jun. 30, 2022 |
Dec. 31, 2021 |
| Assets |
$ 484,869
|
$ 542,093
|
|
|
| Cash and cash equivalents |
21,193
|
19,232
|
$ 27,462
|
$ 30,521
|
| Aluminum Extrusions [Member] |
|
|
|
|
| Assets |
266,426
|
293,308
|
|
|
| PE Films [Member] |
|
|
|
|
| Assets |
82,191
|
102,431
|
|
|
| Flexible Packaging Films [Member] |
|
|
|
|
| Assets |
91,568
|
103,448
|
|
|
| Subtotal |
|
|
|
|
| Assets |
440,185
|
499,187
|
|
|
| General Corporate |
|
|
|
|
| Assets |
$ 23,491
|
$ 23,674
|
|
|
| X |
- DefinitionSum of the carrying amounts as of the balance sheet date of all assets that are recognized. Assets are probable future economic benefits obtained or controlled by an entity as a result of past transactions or events. Reference 1: http://www.xbrl.org/2003/role/disclosureRef
-Topic 810
-SubTopic 10
-Name Accounting Standards Codification
-Section 50
-Paragraph 3
-Subparagraph (bb)
-Publisher FASB
-URI https://asc.fasb.org//1943274/2147481203/810-10-50-3
Reference 2: http://www.xbrl.org/2003/role/disclosureRef
-Topic 810
-SubTopic 10
-Name Accounting Standards Codification
-Section 45
-Paragraph 25
-Subparagraph (a)
-Publisher FASB
-URI https://asc.fasb.org//1943274/2147481231/810-10-45-25
Reference 3: http://www.xbrl.org/2003/role/disclosureRef
-Topic 235
-SubTopic 10
-Name Accounting Standards Codification
-Section S99
-Paragraph 1
-Subparagraph (SX 210.4-08(g)(1)(ii))
-Publisher FASB
-URI https://asc.fasb.org//1943274/2147480678/235-10-S99-1
Reference 4: http://www.xbrl.org/2003/role/disclosureRef
-Topic 323
-SubTopic 10
-Name Accounting Standards Codification
-Section 50
-Paragraph 3
-Subparagraph (c)
-Publisher FASB
-URI https://asc.fasb.org//1943274/2147481687/323-10-50-3
Reference 5: http://www.xbrl.org/2003/role/disclosureRef
-Topic 825
-SubTopic 10
-Name Accounting Standards Codification
-Section 50
-Paragraph 28
-Subparagraph (f)
-Publisher FASB
-URI https://asc.fasb.org//1943274/2147482907/825-10-50-28
Reference 6: http://www.xbrl.org/2003/role/exampleRef
-Topic 852
-SubTopic 10
-Name Accounting Standards Codification
-Section 55
-Paragraph 10
-Publisher FASB
-URI https://asc.fasb.org//1943274/2147481372/852-10-55-10
Reference 7: http://www.xbrl.org/2003/role/exampleRef
-Topic 946
-SubTopic 830
-Name Accounting Standards Codification
-Section 55
-Paragraph 12
-Publisher FASB
-URI https://asc.fasb.org//1943274/2147480167/946-830-55-12
Reference 8: http://www.xbrl.org/2003/role/disclosureRef
-Topic 944
-SubTopic 210
-Name Accounting Standards Codification
-Section S99
-Paragraph 1
-Subparagraph (SX 210.7-03(a)(12))
-Publisher FASB
-URI https://asc.fasb.org//1943274/2147479440/944-210-S99-1
Reference 9: http://www.xbrl.org/2003/role/disclosureRef
-Topic 280
-SubTopic 10
-Name Accounting Standards Codification
-Section 50
-Paragraph 22
-Publisher FASB
-URI https://asc.fasb.org//1943274/2147482810/280-10-50-22
Reference 10: http://www.xbrl.org/2003/role/disclosureRef
-Topic 946
-SubTopic 210
-Name Accounting Standards Codification
-Section S99
-Paragraph 1
-Subparagraph (SX 210.6-04(8))
-Publisher FASB
-URI https://asc.fasb.org//1943274/2147479617/946-210-S99-1
Reference 11: http://www.xbrl.org/2003/role/disclosureRef
-Topic 210
-SubTopic 10
-Name Accounting Standards Codification
-Section S99
-Paragraph 1
-Subparagraph (SX 210.5-02(18))
-Publisher FASB
-URI https://asc.fasb.org//1943274/2147480566/210-10-S99-1
Reference 12: http://www.xbrl.org/2003/role/disclosureRef
-Topic 470
-SubTopic 10
-Name Accounting Standards Codification
-Section S99
-Paragraph 1A
-Subparagraph (SX 210.13-01(a)(4)(i))
-Publisher FASB
-URI https://asc.fasb.org//1943274/2147480097/470-10-S99-1A
Reference 13: http://www.xbrl.org/2009/role/commonPracticeRef
-Topic 470
-SubTopic 10
-Name Accounting Standards Codification
-Section S99
-Paragraph 1A
-Subparagraph (SX 210.13-01(a)(4)(ii))
-Publisher FASB
-URI https://asc.fasb.org//1943274/2147480097/470-10-S99-1A
Reference 14: http://www.xbrl.org/2009/role/commonPracticeRef
-Topic 470
-SubTopic 10
-Name Accounting Standards Codification
-Section S99
-Paragraph 1A
-Subparagraph (SX 210.13-01(a)(4)(iii))
-Publisher FASB
-URI https://asc.fasb.org//1943274/2147480097/470-10-S99-1A
Reference 15: http://www.xbrl.org/2003/role/disclosureRef
-Topic 470
-SubTopic 10
-Name Accounting Standards Codification
-Section S99
-Paragraph 1A
-Subparagraph (SX 210.13-01(a)(4)(iii)(A))
-Publisher FASB
-URI https://asc.fasb.org//1943274/2147480097/470-10-S99-1A
Reference 16: http://www.xbrl.org/2003/role/disclosureRef
-Topic 470
-SubTopic 10
-Name Accounting Standards Codification
-Section S99
-Paragraph 1A
-Subparagraph (SX 210.13-01(a)(4)(iv))
-Publisher FASB
-URI https://asc.fasb.org//1943274/2147480097/470-10-S99-1A
Reference 17: http://www.xbrl.org/2003/role/disclosureRef
-Topic 470
-SubTopic 10
-Name Accounting Standards Codification
-Section S99
-Paragraph 1A
-Subparagraph (SX 210.13-01(a)(5))
-Publisher FASB
-URI https://asc.fasb.org//1943274/2147480097/470-10-S99-1A
Reference 18: http://www.xbrl.org/2003/role/disclosureRef
-Topic 470
-SubTopic 10
-Name Accounting Standards Codification
-Section S99
-Paragraph 1B
-Subparagraph (SX 210.13-02(a)(4)(i))
-Publisher FASB
-URI https://asc.fasb.org//1943274/2147480097/470-10-S99-1B
Reference 19: http://www.xbrl.org/2003/role/disclosureRef
-Topic 470
-SubTopic 10
-Name Accounting Standards Codification
-Section S99
-Paragraph 1B
-Subparagraph (SX 210.13-02(a)(4)(iii)(A))
-Publisher FASB
-URI https://asc.fasb.org//1943274/2147480097/470-10-S99-1B
Reference 20: http://www.xbrl.org/2003/role/disclosureRef
-Topic 470
-SubTopic 10
-Name Accounting Standards Codification
-Section S99
-Paragraph 1B
-Subparagraph (SX 210.13-02(a)(4)(iii)(B))
-Publisher FASB
-URI https://asc.fasb.org//1943274/2147480097/470-10-S99-1B
Reference 21: http://www.xbrl.org/2003/role/disclosureRef
-Topic 470
-SubTopic 10
-Name Accounting Standards Codification
-Section S99
-Paragraph 1B
-Subparagraph (SX 210.13-02(a)(4)(iv))
-Publisher FASB
-URI https://asc.fasb.org//1943274/2147480097/470-10-S99-1B
Reference 22: http://www.xbrl.org/2003/role/disclosureRef
-Topic 470
-SubTopic 10
-Name Accounting Standards Codification
-Section S99
-Paragraph 1B
-Subparagraph (SX 210.13-02(a)(5))
-Publisher FASB
-URI https://asc.fasb.org//1943274/2147480097/470-10-S99-1B
Reference 23: http://www.xbrl.org/2009/role/commonPracticeRef
-Topic 852
-SubTopic 10
-Name Accounting Standards Codification
-Section 50
-Paragraph 7
-Subparagraph (a)
-Publisher FASB
-URI https://asc.fasb.org//1943274/2147481404/852-10-50-7
Reference 24: http://www.xbrl.org/2003/role/disclosureRef
-Topic 280
-SubTopic 10
-Name Accounting Standards Codification
-Section 50
-Paragraph 30
-Subparagraph (c)
-Publisher FASB
-URI https://asc.fasb.org//1943274/2147482810/280-10-50-30
Reference 25: http://www.xbrl.org/2003/role/disclosureRef
-Topic 280
-SubTopic 10
-Name Accounting Standards Codification
-Section 50
-Paragraph 32
-Subparagraph (d)
-Publisher FASB
-URI https://asc.fasb.org//1943274/2147482810/280-10-50-32
Reference 26: http://fasb.org/us-gaap/role/ref/legacyRef
-Topic 942
-SubTopic 210
-Name Accounting Standards Codification
-Section S99
-Paragraph 1
-Subparagraph (SX 210.9-03(11))
-Publisher FASB
-URI https://asc.fasb.org//1943274/2147479853/942-210-S99-1
| Name: |
us-gaap_Assets |
| Namespace Prefix: |
us-gaap_ |
| Data Type: |
xbrli:monetaryItemType |
| Balance Type: |
debit |
| Period Type: |
instant |
|
| X |
- DefinitionAmount of cash and cash equivalents, and cash and cash equivalents restricted to withdrawal or usage. Excludes amount for disposal group and discontinued operations. Cash includes, but is not limited to, currency on hand, demand deposits with banks or financial institutions, and other accounts with general characteristics of demand deposits. Cash equivalents include, but are not limited to, short-term, highly liquid investments that are both readily convertible to known amounts of cash and so near their maturity that they present insignificant risk of changes in value because of changes in interest rates. Reference 1: http://www.xbrl.org/2003/role/disclosureRef
-Topic 230
-SubTopic 10
-Name Accounting Standards Codification
-Section 50
-Paragraph 8
-Publisher FASB
-URI https://asc.fasb.org//1943274/2147482913/230-10-50-8
Reference 2: http://fasb.org/us-gaap/role/ref/legacyRef
-Topic 230
-SubTopic 10
-Name Accounting Standards Codification
-Section 45
-Paragraph 24
-Publisher FASB
-URI https://asc.fasb.org//1943274/2147482740/230-10-45-24
Reference 3: http://fasb.org/us-gaap/role/ref/legacyRef
-Name Accounting Standards Codification
-Topic 230
-SubTopic 10
-Section 45
-Paragraph 4
-Publisher FASB
-URI https://asc.fasb.org//1943274/2147482740/230-10-45-4
| Name: |
us-gaap_CashCashEquivalentsRestrictedCashAndRestrictedCashEquivalents |
| Namespace Prefix: |
us-gaap_ |
| Data Type: |
xbrli:monetaryItemType |
| Balance Type: |
debit |
| Period Type: |
instant |
|
| X |
- Details
| Name: |
us-gaap_StatementBusinessSegmentsAxis=tg_AluminumExtrusionsMember |
| Namespace Prefix: |
|
| Data Type: |
na |
| Balance Type: |
|
| Period Type: |
|
|
| X |
- Details
| Name: |
us-gaap_StatementBusinessSegmentsAxis=tg_PEFilmsMember |
| Namespace Prefix: |
|
| Data Type: |
na |
| Balance Type: |
|
| Period Type: |
|
|
| X |
- Details
| Name: |
us-gaap_StatementBusinessSegmentsAxis=tg_FlexiblePackagingFilmsMember |
| Namespace Prefix: |
|
| Data Type: |
na |
| Balance Type: |
|
| Period Type: |
|
|
| X |
- Details
| Name: |
us-gaap_StatementBusinessSegmentsAxis=tg_SubtotalMember |
| Namespace Prefix: |
|
| Data Type: |
na |
| Balance Type: |
|
| Period Type: |
|
|
| X |
- Details
| Name: |
us-gaap_StatementBusinessSegmentsAxis=tg_GeneralCorporateMember |
| Namespace Prefix: |
|
| Data Type: |
na |
| Balance Type: |
|
| Period Type: |
|
|
v3.23.2
Segment Reporting Schedule of Revenue by Geographic Location (Details) - USD ($)
$ in Thousands |
3 Months Ended |
6 Months Ended |
Jun. 30, 2023 |
Jun. 30, 2022 |
Jun. 30, 2023 |
Jun. 30, 2022 |
| Disaggregation of Revenue [Line Items] |
|
|
|
|
| Sales |
$ 170,968
|
$ 263,327
|
$ 356,046
|
$ 491,811
|
| Aluminum Extrusions [Member] |
|
|
|
|
| Disaggregation of Revenue [Line Items] |
|
|
|
|
| Sales |
121,827
|
190,308
|
255,197
|
348,417
|
| Aluminum Extrusions [Member] | Nonresidential Building And Construction [Member] |
|
|
|
|
| Disaggregation of Revenue [Line Items] |
|
|
|
|
| Sales |
65,784
|
99,302
|
144,413
|
180,223
|
| Aluminum Extrusions [Member] | Consumer Durables [Member] |
|
|
|
|
| Disaggregation of Revenue [Line Items] |
|
|
|
|
| Sales |
11,714
|
18,805
|
22,061
|
35,695
|
| Aluminum Extrusions [Member] | Automotive [Member] |
|
|
|
|
| Disaggregation of Revenue [Line Items] |
|
|
|
|
| Sales |
11,769
|
14,473
|
23,891
|
28,314
|
| Aluminum Extrusions [Member] | Residential Building And Construction [Member] |
|
|
|
|
| Disaggregation of Revenue [Line Items] |
|
|
|
|
| Sales |
10,056
|
20,948
|
21,659
|
37,413
|
| Aluminum Extrusions [Member] | Electrical [Member] |
|
|
|
|
| Disaggregation of Revenue [Line Items] |
|
|
|
|
| Sales |
6,078
|
9,687
|
14,207
|
16,974
|
| Aluminum Extrusions [Member] | Machinery and Equipment BNL [Domain] |
|
|
|
|
| Disaggregation of Revenue [Line Items] |
|
|
|
|
| Sales |
11,082
|
15,929
|
21,806
|
28,874
|
| Aluminum Extrusions [Member] | Distribution [Member] |
|
|
|
|
| Disaggregation of Revenue [Line Items] |
|
|
|
|
| Sales |
5,344
|
11,164
|
7,160
|
20,924
|
| Aluminum Extrusions [Member] | Aluminum Extrusions Subtotal [Member] |
|
|
|
|
| Disaggregation of Revenue [Line Items] |
|
|
|
|
| Sales |
121,827
|
190,308
|
255,197
|
348,417
|
| PE Films [Member] |
|
|
|
|
| Disaggregation of Revenue [Line Items] |
|
|
|
|
| Sales |
15,918
|
31,424
|
36,099
|
62,555
|
| PE Films [Member] | Surface Protection Films [Member] |
|
|
|
|
| Disaggregation of Revenue [Line Items] |
|
|
|
|
| Sales |
8,643
|
23,674
|
21,497
|
45,822
|
| PE Films [Member] | Personal Care Materials |
|
|
|
|
| Disaggregation of Revenue [Line Items] |
|
|
|
|
| Sales |
7,275
|
7,750
|
14,602
|
16,733
|
| PE Films [Member] | Film Products Subtotal [Member] |
|
|
|
|
| Disaggregation of Revenue [Line Items] |
|
|
|
|
| Sales |
15,918
|
31,424
|
36,099
|
62,555
|
| Flexible Packaging Films [Member] [Domain] |
|
|
|
|
| Disaggregation of Revenue [Line Items] |
|
|
|
|
| Sales |
33,223
|
41,595
|
64,750
|
80,839
|
| UNITED STATES |
|
|
|
|
| Disaggregation of Revenue [Line Items] |
|
|
|
|
| Sales |
133,417
|
213,955
|
284,027
|
396,092
|
| Asia [Member] | Exports From United States [Member] |
|
|
|
|
| Disaggregation of Revenue [Line Items] |
|
|
|
|
| Sales |
5,477
|
14,680
|
11,209
|
27,145
|
| Revenues |
3,400
|
5,300
|
6,800
|
11,700
|
| Asia [Member] | Operations Outside United States [Member] |
|
|
|
|
| Disaggregation of Revenue [Line Items] |
|
|
|
|
| Sales |
55
|
0
|
160
|
0
|
| Latin America [Member] | Exports From United States [Member] |
|
|
|
|
| Disaggregation of Revenue [Line Items] |
|
|
|
|
| Sales |
1,817
|
1,245
|
3,676
|
2,686
|
| CANADA | Exports From United States [Member] |
|
|
|
|
| Disaggregation of Revenue [Line Items] |
|
|
|
|
| Sales |
4,955
|
4,173
|
9,239
|
8,366
|
| Europe [Member] | Exports From United States [Member] |
|
|
|
|
| Disaggregation of Revenue [Line Items] |
|
|
|
|
| Sales |
272
|
1,085
|
1,132
|
2,448
|
| Brazil | Operations Outside United States [Member] |
|
|
|
|
| Disaggregation of Revenue [Line Items] |
|
|
|
|
| Sales |
$ 24,975
|
$ 28,189
|
$ 46,603
|
$ 55,074
|
| X |
- DefinitionAggregrate revenue during the period from the sales of goods in the normal course of business, after deducting returns, allowances, discounts, and charges for outbound freight.
| Name: |
tg_NetSales |
| Namespace Prefix: |
tg_ |
| Data Type: |
xbrli:monetaryItemType |
| Balance Type: |
credit |
| Period Type: |
duration |
|
| X |
- DefinitionLine items represent financial concepts included in a table. These concepts are used to disclose reportable information associated with domain members defined in one or many axes to the table. Reference 1: http://www.xbrl.org/2003/role/disclosureRef
-Topic 606
-SubTopic 10
-Name Accounting Standards Codification
-Section 50
-Paragraph 5
-Publisher FASB
-URI https://asc.fasb.org//1943274/2147479806/606-10-50-5
Reference 2: http://www.xbrl.org/2003/role/exampleRef
-Topic 606
-SubTopic 10
-Name Accounting Standards Codification
-Section 55
-Paragraph 91
-Subparagraph (a)
-Publisher FASB
-URI https://asc.fasb.org//1943274/2147479777/606-10-55-91
Reference 3: http://www.xbrl.org/2003/role/exampleRef
-Topic 606
-SubTopic 10
-Name Accounting Standards Codification
-Section 55
-Paragraph 91
-Subparagraph (b)
-Publisher FASB
-URI https://asc.fasb.org//1943274/2147479777/606-10-55-91
Reference 4: http://www.xbrl.org/2003/role/exampleRef
-Topic 606
-SubTopic 10
-Name Accounting Standards Codification
-Section 55
-Paragraph 91
-Subparagraph (c)
-Publisher FASB
-URI https://asc.fasb.org//1943274/2147479777/606-10-55-91
Reference 5: http://www.xbrl.org/2003/role/exampleRef
-Topic 606
-SubTopic 10
-Name Accounting Standards Codification
-Section 55
-Paragraph 91
-Subparagraph (d)
-Publisher FASB
-URI https://asc.fasb.org//1943274/2147479777/606-10-55-91
Reference 6: http://www.xbrl.org/2003/role/exampleRef
-Topic 606
-SubTopic 10
-Name Accounting Standards Codification
-Section 55
-Paragraph 91
-Subparagraph (e)
-Publisher FASB
-URI https://asc.fasb.org//1943274/2147479777/606-10-55-91
Reference 7: http://www.xbrl.org/2003/role/exampleRef
-Topic 606
-SubTopic 10
-Name Accounting Standards Codification
-Section 55
-Paragraph 91
-Subparagraph (f)
-Publisher FASB
-URI https://asc.fasb.org//1943274/2147479777/606-10-55-91
Reference 8: http://www.xbrl.org/2003/role/exampleRef
-Topic 606
-SubTopic 10
-Name Accounting Standards Codification
-Section 55
-Paragraph 91
-Subparagraph (g)
-Publisher FASB
-URI https://asc.fasb.org//1943274/2147479777/606-10-55-91
| Name: |
us-gaap_DisaggregationOfRevenueLineItems |
| Namespace Prefix: |
us-gaap_ |
| Data Type: |
xbrli:stringItemType |
| Balance Type: |
na |
| Period Type: |
duration |
|
| X |
- DefinitionAmount of revenue recognized from goods sold, services rendered, insurance premiums, or other activities that constitute an earning process. Includes, but is not limited to, investment and interest income before deduction of interest expense when recognized as a component of revenue, and sales and trading gain (loss). Reference 1: http://www.xbrl.org/2003/role/disclosureRef
-Topic 235
-SubTopic 10
-Name Accounting Standards Codification
-Section S99
-Paragraph 1
-Subparagraph (SX 210.4-08(g)(1)(ii))
-Publisher FASB
-URI https://asc.fasb.org//1943274/2147480678/235-10-S99-1
Reference 2: http://www.xbrl.org/2003/role/disclosureRef
-Topic 323
-SubTopic 10
-Name Accounting Standards Codification
-Section 50
-Paragraph 3
-Subparagraph (c)
-Publisher FASB
-URI https://asc.fasb.org//1943274/2147481687/323-10-50-3
Reference 3: http://www.xbrl.org/2003/role/disclosureRef
-Topic 825
-SubTopic 10
-Name Accounting Standards Codification
-Section 50
-Paragraph 28
-Subparagraph (f)
-Publisher FASB
-URI https://asc.fasb.org//1943274/2147482907/825-10-50-28
Reference 4: http://www.xbrl.org/2003/role/disclosureRef
-Topic 220
-SubTopic 10
-Name Accounting Standards Codification
-Section S99
-Paragraph 2
-Subparagraph (SX 210.5-03(1))
-Publisher FASB
-URI https://asc.fasb.org//1943274/2147483621/220-10-S99-2
Reference 5: http://www.xbrl.org/2003/role/disclosureRef
-Topic 470
-SubTopic 10
-Name Accounting Standards Codification
-Section S99
-Paragraph 1A
-Subparagraph (SX 210.13-01(a)(4)(i))
-Publisher FASB
-URI https://asc.fasb.org//1943274/2147480097/470-10-S99-1A
Reference 6: http://www.xbrl.org/2009/role/commonPracticeRef
-Topic 470
-SubTopic 10
-Name Accounting Standards Codification
-Section S99
-Paragraph 1A
-Subparagraph (SX 210.13-01(a)(4)(ii))
-Publisher FASB
-URI https://asc.fasb.org//1943274/2147480097/470-10-S99-1A
Reference 7: http://www.xbrl.org/2003/role/disclosureRef
-Topic 470
-SubTopic 10
-Name Accounting Standards Codification
-Section S99
-Paragraph 1A
-Subparagraph (SX 210.13-01(a)(4)(iii)(A))
-Publisher FASB
-URI https://asc.fasb.org//1943274/2147480097/470-10-S99-1A
Reference 8: http://www.xbrl.org/2003/role/disclosureRef
-Topic 470
-SubTopic 10
-Name Accounting Standards Codification
-Section S99
-Paragraph 1A
-Subparagraph (SX 210.13-01(a)(4)(iv))
-Publisher FASB
-URI https://asc.fasb.org//1943274/2147480097/470-10-S99-1A
Reference 9: http://www.xbrl.org/2003/role/disclosureRef
-Topic 470
-SubTopic 10
-Name Accounting Standards Codification
-Section S99
-Paragraph 1A
-Subparagraph (SX 210.13-01(a)(5))
-Publisher FASB
-URI https://asc.fasb.org//1943274/2147480097/470-10-S99-1A
Reference 10: http://www.xbrl.org/2003/role/disclosureRef
-Topic 470
-SubTopic 10
-Name Accounting Standards Codification
-Section S99
-Paragraph 1B
-Subparagraph (SX 210.13-02(a)(4)(i))
-Publisher FASB
-URI https://asc.fasb.org//1943274/2147480097/470-10-S99-1B
Reference 11: http://www.xbrl.org/2003/role/disclosureRef
-Topic 470
-SubTopic 10
-Name Accounting Standards Codification
-Section S99
-Paragraph 1B
-Subparagraph (SX 210.13-02(a)(4)(iii)(A))
-Publisher FASB
-URI https://asc.fasb.org//1943274/2147480097/470-10-S99-1B
Reference 12: http://www.xbrl.org/2003/role/disclosureRef
-Topic 470
-SubTopic 10
-Name Accounting Standards Codification
-Section S99
-Paragraph 1B
-Subparagraph (SX 210.13-02(a)(4)(iii)(B))
-Publisher FASB
-URI https://asc.fasb.org//1943274/2147480097/470-10-S99-1B
Reference 13: http://www.xbrl.org/2003/role/disclosureRef
-Topic 470
-SubTopic 10
-Name Accounting Standards Codification
-Section S99
-Paragraph 1B
-Subparagraph (SX 210.13-02(a)(4)(iv))
-Publisher FASB
-URI https://asc.fasb.org//1943274/2147480097/470-10-S99-1B
Reference 14: http://www.xbrl.org/2003/role/disclosureRef
-Topic 470
-SubTopic 10
-Name Accounting Standards Codification
-Section S99
-Paragraph 1B
-Subparagraph (SX 210.13-02(a)(5))
-Publisher FASB
-URI https://asc.fasb.org//1943274/2147480097/470-10-S99-1B
Reference 15: http://www.xbrl.org/2003/role/disclosureRef
-Topic 280
-SubTopic 10
-Name Accounting Standards Codification
-Section 50
-Paragraph 30
-Subparagraph (a)
-Publisher FASB
-URI https://asc.fasb.org//1943274/2147482810/280-10-50-30
Reference 16: http://www.xbrl.org/2003/role/disclosureRef
-Topic 280
-SubTopic 10
-Name Accounting Standards Codification
-Section 50
-Paragraph 42
-Publisher FASB
-URI https://asc.fasb.org//1943274/2147482810/280-10-50-42
Reference 17: http://www.xbrl.org/2003/role/disclosureRef
-Topic 280
-SubTopic 10
-Name Accounting Standards Codification
-Section 50
-Paragraph 22
-Subparagraph (b)
-Publisher FASB
-URI https://asc.fasb.org//1943274/2147482810/280-10-50-22
Reference 18: http://www.xbrl.org/2003/role/disclosureRef
-Topic 280
-SubTopic 10
-Name Accounting Standards Codification
-Section 50
-Paragraph 32
-Subparagraph (b)
-Publisher FASB
-URI https://asc.fasb.org//1943274/2147482810/280-10-50-32
Reference 19: http://www.xbrl.org/2003/role/disclosureRef
-Topic 280
-SubTopic 10
-Name Accounting Standards Codification
-Section 50
-Paragraph 40
-Publisher FASB
-URI https://asc.fasb.org//1943274/2147482810/280-10-50-40
Reference 20: http://www.xbrl.org/2003/role/disclosureRef
-Topic 280
-SubTopic 10
-Name Accounting Standards Codification
-Section 50
-Paragraph 22
-Subparagraph (a)
-Publisher FASB
-URI https://asc.fasb.org//1943274/2147482810/280-10-50-22
Reference 21: http://www.xbrl.org/2003/role/disclosureRef
-Topic 280
-SubTopic 10
-Name Accounting Standards Codification
-Section 50
-Paragraph 32
-Subparagraph (a)
-Publisher FASB
-URI https://asc.fasb.org//1943274/2147482810/280-10-50-32
Reference 22: http://www.xbrl.org/2003/role/disclosureRef
-Topic 280
-SubTopic 10
-Name Accounting Standards Codification
-Section 50
-Paragraph 41
-Subparagraph (a)
-Publisher FASB
-URI https://asc.fasb.org//1943274/2147482810/280-10-50-41
Reference 23: http://www.xbrl.org/2003/role/disclosureRef
-Topic 942
-SubTopic 235
-Name Accounting Standards Codification
-Section S99
-Paragraph 1
-Subparagraph (SX 210.9-05(b)(2))
-Publisher FASB
-URI https://asc.fasb.org//1943274/2147479557/942-235-S99-1
| Name: |
us-gaap_Revenues |
| Namespace Prefix: |
us-gaap_ |
| Data Type: |
xbrli:monetaryItemType |
| Balance Type: |
credit |
| Period Type: |
duration |
|
| X |
- Details
| Name: |
us-gaap_StatementBusinessSegmentsAxis=tg_AluminumExtrusionsMember |
| Namespace Prefix: |
|
| Data Type: |
na |
| Balance Type: |
|
| Period Type: |
|
|
| X |
- Details
| Name: |
srt_ProductOrServiceAxis=tg_NonresidentialBuildingAndConstructionMember |
| Namespace Prefix: |
|
| Data Type: |
na |
| Balance Type: |
|
| Period Type: |
|
|
| X |
- Details
| Name: |
srt_ProductOrServiceAxis=tg_ConsumerDurablesMember |
| Namespace Prefix: |
|
| Data Type: |
na |
| Balance Type: |
|
| Period Type: |
|
|
| X |
- Details
| Name: |
srt_ProductOrServiceAxis=tg_AutomotiveMember |
| Namespace Prefix: |
|
| Data Type: |
na |
| Balance Type: |
|
| Period Type: |
|
|
| X |
- Details
| Name: |
srt_ProductOrServiceAxis=tg_ResidentialBuildingAndConstructionMember |
| Namespace Prefix: |
|
| Data Type: |
na |
| Balance Type: |
|
| Period Type: |
|
|
| X |
- Details
| Name: |
srt_ProductOrServiceAxis=tg_ElectricalMember |
| Namespace Prefix: |
|
| Data Type: |
na |
| Balance Type: |
|
| Period Type: |
|
|
| X |
- Details
| Name: |
srt_ProductOrServiceAxis=tg_MachineryandEquipmentBNLDomain |
| Namespace Prefix: |
|
| Data Type: |
na |
| Balance Type: |
|
| Period Type: |
|
|
| X |
- Details
| Name: |
srt_ProductOrServiceAxis=tg_DistributionMember |
| Namespace Prefix: |
|
| Data Type: |
na |
| Balance Type: |
|
| Period Type: |
|
|
| X |
- Details
| Name: |
srt_ProductOrServiceAxis=tg_AluminumExtrusionsSubtotalMember |
| Namespace Prefix: |
|
| Data Type: |
na |
| Balance Type: |
|
| Period Type: |
|
|
| X |
- Details
| Name: |
us-gaap_StatementBusinessSegmentsAxis=tg_PEFilmsMember |
| Namespace Prefix: |
|
| Data Type: |
na |
| Balance Type: |
|
| Period Type: |
|
|
| X |
- Details
| Name: |
srt_ProductOrServiceAxis=tg_SurfaceProtectionFilmsMember |
| Namespace Prefix: |
|
| Data Type: |
na |
| Balance Type: |
|
| Period Type: |
|
|
| X |
- Details
| Name: |
srt_ProductOrServiceAxis=tg_OverwrapPackagingMember |
| Namespace Prefix: |
|
| Data Type: |
na |
| Balance Type: |
|
| Period Type: |
|
|
| X |
- Details
| Name: |
srt_ProductOrServiceAxis=tg_FilmProductsSubtotalMember |
| Namespace Prefix: |
|
| Data Type: |
na |
| Balance Type: |
|
| Period Type: |
|
|
| X |
- Details
| Name: |
us-gaap_StatementBusinessSegmentsAxis=tg_FlexiblePackagingFilmsMemberDomain |
| Namespace Prefix: |
|
| Data Type: |
na |
| Balance Type: |
|
| Period Type: |
|
|
| X |
- Details
| Name: |
srt_StatementGeographicalAxis=country_US |
| Namespace Prefix: |
|
| Data Type: |
na |
| Balance Type: |
|
| Period Type: |
|
|
| X |
- Details
| Name: |
srt_StatementGeographicalAxis=srt_AsiaMember |
| Namespace Prefix: |
|
| Data Type: |
na |
| Balance Type: |
|
| Period Type: |
|
|
| X |
- Details
| Name: |
us-gaap_StatementBusinessSegmentsAxis=tg_ExportsFromUnitedStatesMember |
| Namespace Prefix: |
|
| Data Type: |
na |
| Balance Type: |
|
| Period Type: |
|
|
| X |
- Details
| Name: |
us-gaap_StatementBusinessSegmentsAxis=tg_OperationsOutsideUnitedStatesMember |
| Namespace Prefix: |
|
| Data Type: |
na |
| Balance Type: |
|
| Period Type: |
|
|
| X |
- Details
| Name: |
srt_StatementGeographicalAxis=srt_LatinAmericaMember |
| Namespace Prefix: |
|
| Data Type: |
na |
| Balance Type: |
|
| Period Type: |
|
|
| X |
- Details
| Name: |
srt_StatementGeographicalAxis=country_CA |
| Namespace Prefix: |
|
| Data Type: |
na |
| Balance Type: |
|
| Period Type: |
|
|
| X |
- Details
| Name: |
srt_StatementGeographicalAxis=srt_EuropeMember |
| Namespace Prefix: |
|
| Data Type: |
na |
| Balance Type: |
|
| Period Type: |
|
|
| X |
- Details
| Name: |
srt_StatementGeographicalAxis=country_BR |
| Namespace Prefix: |
|
| Data Type: |
na |
| Balance Type: |
|
| Period Type: |
|
|
v3.23.2
| X |
- DefinitionCarrying value as of the balance sheet date of liabilities incurred (and for which invoices have typically been received) and payable to vendors for goods and services received that are used in an entity's business. Reference 1: http://www.xbrl.org/2009/role/commonPracticeRef
-Topic 944
-SubTopic 210
-Name Accounting Standards Codification
-Section S99
-Paragraph 1
-Subparagraph (SX 210.7-03(a)(15)(a))
-Publisher FASB
-URI https://asc.fasb.org//1943274/2147479440/944-210-S99-1
Reference 2: http://fasb.org/us-gaap/role/ref/legacyRef
-Name Accounting Standards Codification
-Topic 942
-SubTopic 210
-Section S99
-Paragraph 1
-Subparagraph (SX 210.9-03.15(5))
-Publisher FASB
-URI https://asc.fasb.org//1943274/2147479853/942-210-S99-1
| Name: |
us-gaap_AccountsPayableCurrentAndNoncurrent |
| Namespace Prefix: |
us-gaap_ |
| Data Type: |
xbrli:monetaryItemType |
| Balance Type: |
credit |
| Period Type: |
instant |
|
| X |
- DefinitionLine items represent financial concepts included in a table. These concepts are used to disclose reportable information associated with domain members defined in one or many axes to the table. Reference 1: http://www.xbrl.org/2003/role/disclosureRef
-Topic 420
-SubTopic 10
-Name Accounting Standards Codification
-Section 50
-Paragraph 1
-Subparagraph (c)
-Publisher FASB
-URI https://asc.fasb.org//1943274/2147482017/420-10-50-1
Reference 2: http://www.xbrl.org/2003/role/disclosureRef
-Topic 420
-SubTopic 10
-Name Accounting Standards Codification
-Section 50
-Paragraph 1
-Subparagraph (b)(2)
-Publisher FASB
-URI https://asc.fasb.org//1943274/2147482017/420-10-50-1
Reference 3: http://www.xbrl.org/2003/role/disclosureRef
-Topic 420
-SubTopic 10
-Name Accounting Standards Codification
-Section 50
-Paragraph 1
-Subparagraph (b)(1)
-Publisher FASB
-URI https://asc.fasb.org//1943274/2147482017/420-10-50-1
Reference 4: http://www.xbrl.org/2003/role/disclosureRef
-Topic 420
-SubTopic 10
-Name Accounting Standards Codification
-Section S99
-Paragraph 2
-Subparagraph (SAB Topic 5.P.4(b)(2))
-Publisher FASB
-URI https://asc.fasb.org//1943274/2147479823/420-10-S99-2
Reference 5: http://www.xbrl.org/2003/role/disclosureRef
-Topic 420
-SubTopic 10
-Name Accounting Standards Codification
-Section S99
-Paragraph 2
-Subparagraph (SAB Topic 5.P.4(b)(1))
-Publisher FASB
-URI https://asc.fasb.org//1943274/2147479823/420-10-S99-2
Reference 6: http://www.xbrl.org/2003/role/disclosureRef
-Topic 420
-SubTopic 10
-Name Accounting Standards Codification
-Section S99
-Paragraph 2
-Subparagraph (SAB Topic 5.P.4(d))
-Publisher FASB
-URI https://asc.fasb.org//1943274/2147479823/420-10-S99-2
Reference 7: http://www.xbrl.org/2003/role/disclosureRef
-Topic 420
-SubTopic 10
-Name Accounting Standards Codification
-Section 50
-Paragraph 1
-Subparagraph (d)
-Publisher FASB
-URI https://asc.fasb.org//1943274/2147482017/420-10-50-1
| Name: |
us-gaap_RestructuringCostAndReserveLineItems |
| Namespace Prefix: |
us-gaap_ |
| Data Type: |
xbrli:stringItemType |
| Balance Type: |
na |
| Period Type: |
duration |
|
| X |
- Details
| Name: |
srt_CounterpartyNameAxis=tg_ThirdPartyFinancialInstitutionsMember |
| Namespace Prefix: |
|
| Data Type: |
na |
| Balance Type: |
|
| Period Type: |
|
|
v3.23.2
Subsequent Events - Narrative (Details)
$ in Millions |
3 Months Ended |
6 Months Ended |
9 Months Ended |
12 Months Ended |
Dec. 31, 2024 |
Sep. 30, 2024 |
Jun. 30, 2024 |
Sep. 30, 2023 |
Jun. 30, 2023
USD ($)
|
Jun. 30, 2023
USD ($)
|
Mar. 31, 2024 |
Jun. 30, 2024 |
| Subsequent Event [Line Items] |
|
|
|
|
|
|
|
|
| Business Exit Costs |
|
|
|
|
|
$ 1.8
|
|
|
| Restructuring and Related Cost, Accelerated Depreciation |
|
|
|
|
|
4.5
|
|
|
| Annual Cash Savings related to restruturing |
|
|
|
|
|
3.4
|
|
|
| Annual cash dividends |
|
|
|
|
$ 17.7
|
17.7
|
|
|
| Line of Credit Facility, Maximum Borrowing Capacity |
|
|
|
|
375.0
|
375.0
|
|
|
| Line of Credit, Maximum Borrowing Capacity after Modification |
|
|
|
|
$ 200.0
|
200.0
|
|
|
| Secured Revolving Credit Facility [Member] |
|
|
|
|
|
|
|
|
| Subsequent Event [Line Items] |
|
|
|
|
|
|
|
|
| Line of credit facility, covenant terms, maximum debt to EBITDA ratio |
|
|
|
|
4.0
|
|
|
|
| Line of credit facility, covenant terms, minimum adjusted EBIT-to-interest expense ratio |
|
|
|
|
3.0
|
|
|
|
| Secured Revolving Credit Facility [Member] | Subsequent Event [Member] |
|
|
|
|
|
|
|
|
| Subsequent Event [Line Items] |
|
|
|
|
|
|
|
|
| Line of credit facility, covenant terms, maximum debt to EBITDA ratio |
4.0
|
4.25
|
4.75
|
|
|
|
5.0
|
|
| Line of credit facility, covenant terms, minimum adjusted EBIT-to-interest expense ratio |
3.0
|
2.75
|
|
|
|
|
|
2.50
|
| Future Increase In Credit Spread Over Secured Overnight Financing Rate Basis Points |
|
|
|
0.25%
|
|
|
|
|
| Employee Severance [Member] |
|
|
|
|
|
|
|
|
| Subsequent Event [Line Items] |
|
|
|
|
|
|
|
|
| Business Exit Costs |
|
|
|
|
|
0.9
|
|
|
| Operating Expense |
|
|
|
|
|
|
|
|
| Subsequent Event [Line Items] |
|
|
|
|
|
|
|
|
| Business Exit Costs |
|
|
|
|
|
0.6
|
|
|
| Other Expense |
|
|
|
|
|
|
|
|
| Subsequent Event [Line Items] |
|
|
|
|
|
|
|
|
| Business Exit Costs |
|
|
|
|
|
$ 0.3
|
|
|
| X |
- DefinitionFuture Increase In Credit Spread Over Secured Overnight Financing Rate Basis Points
| Name: |
tg_FutureIncreaseInCreditSpreadOverSecuredOvernightFinancingRateBasisPoints |
| Namespace Prefix: |
tg_ |
| Data Type: |
dtr-types:percentItemType |
| Balance Type: |
na |
| Period Type: |
duration |
|
| X |
- DefinitionLine of credit facility, covenant terms, maximum debt to EBITDA ratio
| Name: |
tg_LineOfCreditFacilityCovenantTermsMaximumDebtToEbitdaRatio |
| Namespace Prefix: |
tg_ |
| Data Type: |
xbrli:pureItemType |
| Balance Type: |
na |
| Period Type: |
duration |
|
| X |
- DefinitionLine of credit facility, covenant terms, minimum adjusted EBIT-to-interest expense ratio.
| Name: |
tg_LineOfCreditFacilityCovenantTermsMinimumAdjustedEbitToInterestExpenseRatio |
| Namespace Prefix: |
tg_ |
| Data Type: |
xbrli:pureItemType |
| Balance Type: |
na |
| Period Type: |
duration |
|
| X |
- DefinitionLine of Credit, Maximum Borrowing Capacity after Modification
| Name: |
tg_LineOfCreditMaximumBorrowingCapacityAfterModification |
| Namespace Prefix: |
tg_ |
| Data Type: |
xbrli:monetaryItemType |
| Balance Type: |
credit |
| Period Type: |
instant |
|
| X |
- DefinitionProjected annual cash dividends
| Name: |
tg_ProjectedAnnualCashDividends |
| Namespace Prefix: |
tg_ |
| Data Type: |
xbrli:monetaryItemType |
| Balance Type: |
credit |
| Period Type: |
instant |
|
| X |
- DefinitionAmount of expenses associated with exit or disposal activities pursuant to an authorized plan. Includes, but is not limited to, one-time termination benefits, termination of an operating lease or other contract, consolidating or closing facilities, and relocating employees, and termination benefits associated with an ongoing benefit arrangement. Excludes expenses associated with special or contractual termination benefits, a discontinued operation or an asset retirement obligation. Reference 1: http://fasb.org/us-gaap/role/ref/legacyRef
-Name Accounting Standards Codification
-Section 45
-Paragraph 28
-Subparagraph (b)
-SubTopic 10
-Topic 230
-Publisher FASB
-URI https://asc.fasb.org//1943274/2147482740/230-10-45-28
| Name: |
us-gaap_BusinessExitCosts1 |
| Namespace Prefix: |
us-gaap_ |
| Data Type: |
xbrli:monetaryItemType |
| Balance Type: |
debit |
| Period Type: |
duration |
|
| X |
- DefinitionMaximum borrowing capacity under the credit facility without consideration of any current restrictions on the amount that could be borrowed or the amounts currently outstanding under the facility. Reference 1: http://fasb.org/us-gaap/role/ref/legacyRef
-Name Accounting Standards Codification
-Topic 210
-SubTopic 10
-Section S99
-Paragraph 1
-Subparagraph (SX 210.5-02.19(b),22(b))
-Publisher FASB
-URI https://asc.fasb.org//1943274/2147480566/210-10-S99-1
| Name: |
us-gaap_LineOfCreditFacilityMaximumBorrowingCapacity |
| Namespace Prefix: |
us-gaap_ |
| Data Type: |
xbrli:monetaryItemType |
| Balance Type: |
credit |
| Period Type: |
instant |
|
| X |
- DefinitionAmount of accelerated depreciation charged against earnings associated with exit from or disposal of business activities or restructuring plan.
| Name: |
us-gaap_RestructuringReserveAcceleratedDepreciation |
| Namespace Prefix: |
us-gaap_ |
| Data Type: |
xbrli:monetaryItemType |
| Balance Type: |
debit |
| Period Type: |
duration |
|
| X |
- DefinitionDetail information of subsequent event by type. User is expected to use existing line items from elsewhere in the taxonomy as the primary line items for this disclosure, which is further associated with dimension and member elements pertaining to a subsequent event. Reference 1: http://www.xbrl.org/2003/role/disclosureRef
-Topic 830
-SubTopic 30
-Name Accounting Standards Codification
-Section 50
-Paragraph 2
-Publisher FASB
-URI https://asc.fasb.org//1943274/2147481674/830-30-50-2
Reference 2: http://www.xbrl.org/2003/role/disclosureRef
-Topic 855
-SubTopic 10
-Name Accounting Standards Codification
-Section 50
-Paragraph 2
-Publisher FASB
-URI https://asc.fasb.org//1943274/2147483399/855-10-50-2
| Name: |
us-gaap_SubsequentEventLineItems |
| Namespace Prefix: |
us-gaap_ |
| Data Type: |
xbrli:stringItemType |
| Balance Type: |
na |
| Period Type: |
duration |
|
| X |
- Details
| Name: |
us-gaap_LineOfCreditFacilityAxis=tg_SecuredRevolvingCreditFacilityMember |
| Namespace Prefix: |
|
| Data Type: |
na |
| Balance Type: |
|
| Period Type: |
|
|
| X |
- Details
| Name: |
us-gaap_SubsequentEventTypeAxis=us-gaap_SubsequentEventMember |
| Namespace Prefix: |
|
| Data Type: |
na |
| Balance Type: |
|
| Period Type: |
|
|
| X |
- Details
| Name: |
us-gaap_NatureOfExpenseAxis=us-gaap_EmployeeSeveranceMember |
| Namespace Prefix: |
|
| Data Type: |
na |
| Balance Type: |
|
| Period Type: |
|
|
| X |
- Details
| Name: |
us-gaap_NatureOfExpenseAxis=us-gaap_OperatingExpenseMember |
| Namespace Prefix: |
|
| Data Type: |
na |
| Balance Type: |
|
| Period Type: |
|
|
| X |
- Details
| Name: |
us-gaap_NatureOfExpenseAxis=us-gaap_OtherExpenseMember |
| Namespace Prefix: |
|
| Data Type: |
na |
| Balance Type: |
|
| Period Type: |
|
|
Tredegar (NYSE:TG)
Historical Stock Chart
From Jun 2024 to Jul 2024

Tredegar (NYSE:TG)
Historical Stock Chart
From Jul 2023 to Jul 2024
