Telefonica Profit Falls - Analyst Blog
November 09 2012 - 3:30AM
Zacks
Spanish telecom giant
Telefonica S.A. (TEF) reported financial results
of the first nine months of 2012, with adjusted earnings of €0.77
per share (95 cents per ADS) declining 22.9% year over year.
Net income jumped 26.4% year over
year to €3.46 billion ($4.3 billion). However, consolidated
revenue, at €46.52 billion ($57.39 billion), edged down 0.3% over
the prior-year quarter, in the first nine months of 2012.
Adjusted operating income before
depreciation and amortization (OIBDA) rose 10.7% to €15.8 billion
($19.5 billion), resulting in OIBDA margin of 33.9%, up from 30.5%
in the year-ago period.
Segment
Results
Telefonica Latin America: Latin
America continued to grow at a faster pace and remained one of the
best performing regions. Revenues increased 5.9% year over year to
€22.6 billion ($27.9 billion), driven largely by Venezuela
(representing a growth of 26.1%), followed by Ecuador (24.1%),
Central America (25.8%), Peru (20.3%), Argentina (18.5%), Columbia
(14.1%), Uruguay (9.2%) and Chile (9.8%). However, revenue from the
key markets — Mexico and Brazil — registered a decline of 0.8% and
4.4%, respectively, in the first nine months of 2012.
Telefonica Europe: Revenues from
Europe slid 6.4% year over year to €22.5 billion ($27.8 billion).
The reported downside was owing to the operator’s Spanish revenues
that slipped 12.9% year over year to €11.4 billion ($14.1
billion).
In Espana, Wireless revenue fell
16.2% to €4.9 billion ($4.4 billion) resulting from a reduction in
MTRs. Hurt by weak traffic revenue and repositioning of the new
tariff portfolio, Wireline revenues stood at €7.2 billion ($8.9
billion), down 9.6% over the year-earlier period.
Revenues from the Ireland and Czech
Republic declined 13.9% and 6.1% year over year to €474 million
($584.7 million) and €1.5 billion ($1.9 billion) respectively in
the reported period. Meanwhile, revenues from Germany and UK showed
a 4.5% and 1.3% increase to reach €3.9 billion ($4.8 billion) and
€5.2 billion ($5.6 billion) respectively.
Other companies (ATENTO): ATENTO
revenue increased 5.3% to €1.4 billion ($1.7 billion) over the
year-ago period.
Subscriber
Statistics
At the end of the first nine months
of 2012, total customer access reached approximately 308.1 million,
up 4.6% year over year.
On an annualized basis, mobile
access rose 5.9% to 245.6 million customers. Total Internet and
data access grew 1.9% to 19.4 million. Pay TV access reached 3.32
million, up 3.4% year over year. Fixed telephony access dropped
1.5% to 39.8 million subscribers at the end of the reported
period.
Liquidity and Capital
Expenditure (CapEx)
Telefonica exited the first nine
months of 2012 with a net debt of about €56 billion, down from
€58.31 billion recorded at the end of the first nine months of
2011. The leverage ratio (net debt-to-EBITDA) improved to 2.56
times.
CapEx fell 14% year over year to
€5.7 billion in the reported period. Operating cash flow
(OIBDA-CapEx) jumped to €10.1 billion from €7.6 billion in the
year-ago period.
Future Outlook
For 2012, Telefonica expects
revenue growth to remain flat as compared with fiscal 2011, with
lower EBITDA margin decline. Additionally, the company expects
leverage ratio (net debt-to-EBITDA) to be equivalent to 2.35
times.
Our Take
Telefonica continues to remain
under pressure by intensifying European woes, weak domestic
operations, slowdown in Brazil, adverse regulations, highly
leveraged balance sheet and growing competition from France
Telecom S.A. (FTE), Vodafone Group Plc
(VOD) and America Movil S.A.B. de C.V. (AMX).
We currently have our long-term
Underperform recommendation on Telefonica. For the short term (1–3
months), the stock retains Zacks # 5 (Strong Sell) Rank.
AMER MOVIL-ADR (AMX): Free Stock Analysis Report
FRANCE TELE-ADR (FTE): Free Stock Analysis Report
TELEFONICA S.A. (TEF): Free Stock Analysis Report
VODAFONE GP PLC (VOD): Free Stock Analysis Report
To read this article on Zacks.com click here.
Zacks Investment Research
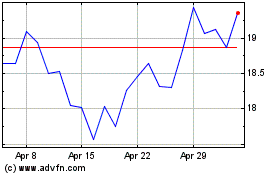
America Movil SAB de CV (NYSE:AMX)
Historical Stock Chart
From May 2024 to Jun 2024

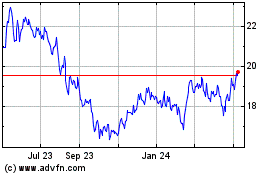
America Movil SAB de CV (NYSE:AMX)
Historical Stock Chart
From Jun 2023 to Jun 2024
