| Company name: | FTSE USA Index |
| EPIC: | WIUSA | Trading Currency: | USD |
| Market Sector: | | ISIN: | |
| Market Segment: | | Share Type: | IX |
| WWW Address: | | Description: | |
| Industry Sector: | |
| Price | Price Change [%] | Bid | Ask | Open | High | Low | Volume |
| 2,517.55 |  -22.26 [-0.88] -22.26 [-0.88] | - | - | 2,543.64 | 2,543.64 | 2,499.57 | - |
| Market Cap. [m] | Shares In Issue [m] | Beta | EPS | DPS | PE Ratio | Yield | 52-Wks-Range |
| - | - | - | - | - | - | - | 2,575.17 - 1,970.91 |

FTSE USA Key Figures
|
FTSE USA Balance Sheet| %1$s Balance Sheet | | Sorry No Data Available |
|
Share Price Performance| Share Price Performance | | Sample Period † | High | Low | | 1 week | 2,543.64 | 2,457.12 |
| 4 weeks | 2,575.17 | 2,457.12 |
| 12 weeks | 2,575.17 | 2,391.66 |
| 1 year | 2,575.17 | 1,970.91 |
Share Price Chart (5 years)| Share Price Chart (5 years) | 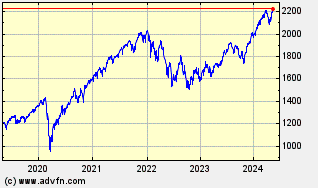 |
|
FTSE USA Historic Returns| %1$s Historic Returns | | Giorni da oggi † | Open | Change | % | Open Avg. | Avg. Daily Vol [m] | Total Vol [m] | VWAP | | 1 week | 2,472.43 | 45.12 | 1.82 | 2,457.12 | - | | - |
| 4 weeks | 2,530.34 | -12.79 | -0.51 | 2,457.12 | - | | - |
| 12 weeks | 2,392.61 | 124.94 | 5.22 | 2,391.66 | - | | - |
| 26 weeks | 2,295.59 | 221.96 | 9.67 | 2,153.99 | - | | - |
| 1 year | 2,009.37 | 508.18 | 25.29 | 1,970.91 | - | | - |
| 3 years | 2,029.86 | 487.69 | 24.03 | 1,463.36 | - | | - |
| 5 years | 1,364.95 | 1,152.60 | 84.44 | 922.73 | - | | - |
| † periods calculated are whole weeks rather than calendar months | |
|
FTSE USA Key Management Ratios
|
FTSE USA Investment Ratios
|
FTSE USA Financial Ratios
| Beta coefficients | | Beta (60-Mnth) | Beta (36-Mnth) | | Sorry No Data Available | Sorry No Data Available |
|
FTSE USA Operating Ratios
|
FTSE USA Dividends
|
|
FTSE USA Fundamentals |
|
|
FTSE USA Balance Sheet
|
FTSE USA Cash Flow Statement
| FTSE USA Brokers| Broker infomation is not available for this class of share. |
| | | | | | | | |
|
|
|