FTSE UK Key Figures
|
FTSE UK Balance Sheet| %1$s Balance Sheet | | Sorry No Data Available |
|
 Share Price Performance| Share Price Performance | | Sample Period † | High | Low | | 1 week | 519.89 | 503.40 |
| 4 weeks | 519.89 | 499.59 |
| 12 weeks | 520.22 | 499.59 |
| 1 year | 523.69 | 454.44 |
Share Price Chart (5 years)| Share Price Chart (5 years) | 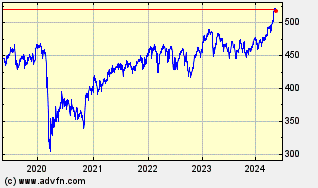 |
|
FTSE UK Historic Returns| %1$s Historic Returns | | Giorni da oggi † | Open | Change | % | Open Avg. | Avg. Daily Vol [m] | Total Vol [m] | VWAP | | 1 week | 503.85 | 14.53 | 2.88 | 503.40 | - | | - |
| 4 weeks | 511.70 | 6.68 | 1.31 | 499.59 | - | | - |
| 12 weeks | 517.97 | 0.41 | 0.08 | 499.59 | - | | - |
| 26 weeks | 513.95 | 4.43 | 0.86 | 488.58 | - | | - |
| 1 year | 460.57 | 57.81 | 12.55 | 454.44 | - | | - |
| 3 years | 443.76 | 74.62 | 16.82 | 408.77 | - | | - |
| 5 years | 446.94 | 71.44 | 15.98 | 298.47 | - | | - |
| † periods calculated are whole weeks rather than calendar months | |
|
FTSE UK Key Management Ratios
|
FTSE UK Investment Ratios
|
FTSE UK Financial Ratios
| Beta coefficients | | Beta (60-Mnth) | Beta (36-Mnth) | | Sorry No Data Available | Sorry No Data Available |
|
FTSE UK Operating Ratios
|
FTSE UK Dividends
|
|
FTSE UK Fundamentals |
|
|
FTSE UK Balance Sheet
|
FTSE UK Cash Flow Statement
|
FTSE UK Brokers| Broker infomation is not available for this class of share. |
|
| |
| |
| |
| |