FTSEurofirst 300 Automob... Key Figures
|
FTSEurofirst 300 Automob... Balance Sheet| %1$s Balance Sheet | | Sorry No Data Available |
|
 Share Price Performance| Share Price Performance | | Sample Period † | High | Low | | 1 week | 1,181.45 | 1,113.25 |
| 4 weeks | 1,228.98 | 1,113.25 |
| 12 weeks | 1,228.98 | 1,082.60 |
| 1 year | 1,228.98 | 892.50 |
Share Price Chart (5 years)| Share Price Chart (5 years) | 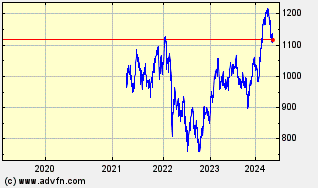 |
|
FTSEurofirst 300 Automob... Historic Returns| %1$s Historic Returns | | Giorni da oggi † | Open | Change | % | Open Avg. | Avg. Daily Vol [m] | Total Vol [m] | VWAP | | 1 week | 1,158.19 | -27.79 | -2.40 | 1,113.25 | - | | - |
| 4 weeks | 1,214.14 | -83.74 | -6.90 | 1,113.25 | - | | - |
| 12 weeks | 1,082.60 | 47.80 | 4.42 | 1,082.60 | - | | - |
| 26 weeks | 939.33 | 191.07 | 20.34 | 928.49 | - | | - |
| 1 year | 966.00 | 164.40 | 17.02 | 892.50 | - | | - |
| 3 years | 980.50 | 149.90 | 15.29 | 741.63 | - | | - |
| 5 years | 192.06 | 938.34 | 488.57 | 192.06 | - | | - |
| † periods calculated are whole weeks rather than calendar months | |
|
FTSEurofirst 300 Automob... Key Management Ratios
|
FTSEurofirst 300 Automob... Investment Ratios
|
FTSEurofirst 300 Automob... Financial Ratios
| Beta coefficients | | Beta (60-Mnth) | Beta (36-Mnth) | | Sorry No Data Available | Sorry No Data Available |
|
FTSEurofirst 300 Automob... Operating Ratios
|
FTSEurofirst 300 Automob... Dividends
|
|
FTSEurofirst 300 Automob... Fundamentals |
|
|
FTSEurofirst 300 Automob... Balance Sheet
|
FTSEurofirst 300 Automob... Cash Flow Statement
|
FTSEurofirst 300 Automob... Brokers| Broker infomation is not available for this class of share. |
|
| |
| |
| |
| |