FTSE AIM All Share Key Figures
|
FTSE AIM All Share Balance Sheet| %1$s Balance Sheet | | Sorry No Data Available |
|
 Share Price Performance| Share Price Performance | | Sample Period † | High | Low | | 1 week | 726.01 | 711.43 |
| 4 weeks | 726.01 | 707.32 |
| 12 weeks | 743.07 | 707.32 |
| 1 year | 812.27 | 707.32 |
Share Price Chart (5 years)| Share Price Chart (5 years) | 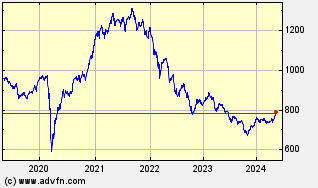 |
|
FTSE AIM All Share Historic Returns| %1$s Historic Returns | | Giorni da oggi † | Open | Change | % | Open Avg. | Avg. Daily Vol [m] | Total Vol [m] | VWAP | | 1 week | 712.70 | 10.69 | 1.50 | 711.43 | - | | - |
| 4 weeks | 707.32 | 16.07 | 2.27 | 707.32 | - | | - |
| 12 weeks | 724.23 | -0.84 | -0.12 | 707.32 | - | | - |
| 26 weeks | 766.24 | -42.85 | -5.59 | 707.32 | - | | - |
| 1 year | 747.41 | -24.02 | -3.21 | 707.32 | - | | - |
| 3 years | 1,084.27 | -360.88 | -33.28 | 669.84 | - | | - |
| 5 years | 969.92 | -246.53 | -25.42 | 581.10 | - | | - |
| † periods calculated are whole weeks rather than calendar months | |
|
FTSE AIM All Share Key Management Ratios
|
FTSE AIM All Share Investment Ratios
|
FTSE AIM All Share Financial Ratios
| Beta coefficients | | Beta (60-Mnth) | Beta (36-Mnth) | | Sorry No Data Available | Sorry No Data Available |
|
FTSE AIM All Share Operating Ratios
|
FTSE AIM All Share Dividends
|
|
FTSE AIM All Share Fundamentals |
|
|
FTSE AIM All Share Balance Sheet
|
FTSE AIM All Share Cash Flow Statement
|
FTSE AIM All Share Brokers| Broker infomation is not available for this class of share. |
|
| |
| |
| |
| |