FTSE All-World Developed... Key Figures
|
FTSE All-World Developed... Balance Sheet| %1$s Balance Sheet | | Sorry No Data Available |
|
 Share Price Performance| Share Price Performance | | Sample Period † | High | Low | | 1 week | 341.31 | 330.28 |
| 4 weeks | 341.31 | 323.20 |
| 12 weeks | 341.31 | 291.54 |
| 1 year | 341.31 | 291.54 |
Share Price Chart (5 years)| Share Price Chart (5 years) | 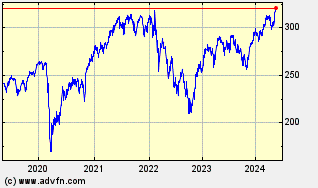 |
|
FTSE All-World Developed... Historic Returns| %1$s Historic Returns | | Giorni da oggi † | Open | Change | % | Open Avg. | Avg. Daily Vol [m] | Total Vol [m] | VWAP | | 1 week | 339.63 | -7.25 | -2.13 | 330.28 | - | | - |
| 4 weeks | 323.20 | 9.18 | 2.84 | 323.20 | - | | - |
| 12 weeks | 304.58 | 27.80 | 9.13 | 291.54 | - | | - |
| 26 weeks | 318.44 | 13.94 | 4.38 | 291.54 | - | | - |
| 1 year | 311.41 | 20.97 | 6.73 | 291.54 | - | | - |
| 3 years | 265.99 | 66.39 | 24.96 | 204.17 | - | | - |
| 5 years | 183.08 | 149.30 | 81.55 | 166.57 | - | | - |
| † periods calculated are whole weeks rather than calendar months | |
|
FTSE All-World Developed... Key Management Ratios
|
FTSE All-World Developed... Investment Ratios
|
FTSE All-World Developed... Financial Ratios
| Beta coefficients | | Beta (60-Mnth) | Beta (36-Mnth) | | Sorry No Data Available | Sorry No Data Available |
|
FTSE All-World Developed... Operating Ratios
|
FTSE All-World Developed... Dividends
|
|
FTSE All-World Developed... Fundamentals |
|
|
FTSE All-World Developed... Balance Sheet
|
FTSE All-World Developed... Cash Flow Statement
|
FTSE All-World Developed... Brokers| Broker infomation is not available for this class of share. |
|
| |
| |
| |
| |