Dogecoin Price Consolidates In Symmetrical Expanding Triangle, What’s Next For DOGE?
February 19 2025 - 9:00AM
NEWSBTC
Dogecoin (DOGE) is once again making waves in the crypto
market. This time, it’s due to a fascinating technical pattern
forming on its price chart: a symmetrical expanding triangle. Known
for signaling periods of heightened volatility and potential
breakout opportunities, this pattern has traders and investors on
the edge of their seats, wondering what’s next for DOGE. The
symmetrical expanding triangle is a rare and dynamic formation,
marked by its widening price range and converging trendlines. For
Dogecoin, this pattern reflects a tug-of-war between bulls and
bears, with neither side gaining a clear upper hand yet. As the
triangle continues to develop, the likelihood of a decisive price
movement grows, setting the stage for an explosive breakout or
breakdown. Analyzing Dogecoin’s Current Price Action Within The
Expanding Triangle Dogecoin’s price action within the symmetrical
expanding triangle suggests heightened market indecision as both
bulls and bears attempt to assert dominance. The widening nature of
the triangle indicates increasing volatility, with each price swing
becoming more extreme. Related Reading: Dogecoin (DOGE) Stuck In
Limbo—What’s Holding Back The Recovery? Currently, DOGE is
oscillating between the upper resistance trendline and the lower
support trendline of the expanding triangle. Each swing is becoming
more pronounced, with a higher high of $0.2923 and a lower low of
$0.2403, reflecting increasing market uncertainty and aggressive
trading activity. These key support and resistance trendlines
will determine the next major move. If buyers push the price toward
the upper boundary, a breakout could signal a bullish continuation.
Conversely, a drop toward the lower trendline hints at a possible
bearish breakdown. Volume trends and technical indicators
like RSI will provide further confirmation of market sentiment as
DOGE approaches a decisive move. A rising RSI toward the 50%
threshold may indicate a strengthening upside momentum, whereas a
continued downward move might reinforce the bearish outlook.
Furthermore, an uptick in volume alongside a price surge would
support a sustained rally while declining volume leads to weakening
conviction among market participants. Key Levels To Watch For A
Confirmed Breakout As DOGE continues to trade within a symmetrical
expanding triangle, identifying key levels for a confirmed breakout
is crucial for traders and investors. When a bullish or bearish
breakout occurs, it could signal the start of a new trend, making
it essential to monitor these levels closely. Related Reading:
Dogecoin Rally To $0.35 Could Trigger Massive Short Squeeze
Specifically, a strong close above the upper boundary of the
pattern near $0.2923, coupled with a notable surge in trading
volume, would confirm an upward breakout. This move will probably
pave the way for further growth, driving the price toward $0.3563
or beyond. However, If DOGE fails to hold support near $0.2403,
selling pressure could intensify, pushing the price down to $0.1800
or lower. A sustained bearish move below this level points to a
deeper correction, bringing historical support zones into focus.
Featured image from Adobe Stock, chart from Tradingview.com
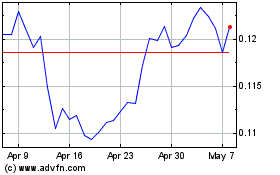
TRON (COIN:TRXUSD)
Historical Stock Chart
From Jan 2025 to Feb 2025

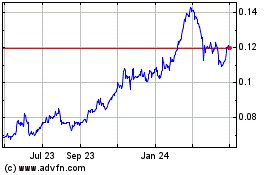
TRON (COIN:TRXUSD)
Historical Stock Chart
From Feb 2024 to Feb 2025
