Ethereum Tests Massive Falling Wedge – Breakout Could Target $4K Cycle Highs
January 26 2025 - 4:50AM
NEWSBTC
Ethereum (ETH) has been trading within a narrow 4-hour range
between $3,150 and $3,500, leaving investors frustrated with its
lackluster performance in recent weeks. As other assets in the
crypto market make strides, Ethereum’s sideways movement has caused
many to question whether it can regain its momentum this year. The
prolonged consolidation has dampened sentiment, with some investors
beginning to lose patience and faith in ETH’s ability to deliver
substantial returns. Related Reading: Cardano Consolidates In A
Symmetrical Triangle – Analyst Expects A 40% Move However, optimism
remains among technical analysts who see Ethereum nearing a
critical inflection point. Top crypto analyst Daan recently shared
a technical analysis on X, highlighting a massive falling wedge
pattern forming on Ethereum’s chart. This setup is widely
considered a bullish reversal indicator, with the potential to
spark significant upward movement if the price breaks out.
According to Daan, a breakout from this falling wedge would likely
pave the way for Ethereum to test the $4,000–$4,100 level, offering
a glimmer of hope for bullish investors. Such a move could
reinvigorate market confidence and set the stage for Ethereum to
reclaim its status as a leading altcoin. For now, all eyes are on
ETH as traders await confirmation of the next big move in this
highly-watched range. Ethereum Facing Serious Risks Ethereum has
remained in a downtrend since late December, struggling to regain
momentum as bearish sentiment continues to dominate the market. The
lackluster price action has left investors and analysts
increasingly concerned about the possibility of a deeper
correction, as ETH consolidates near critical support levels. While
some remain hopeful for a turnaround, the current outlook suggests
Ethereum faces significant challenges ahead. Top crypto analyst
Daan recently shared his insights on X, highlighting a massive
falling wedge pattern on Ethereum’s chart. This pattern is often
regarded as a bullish reversal signal, with the potential to
trigger a significant breakout if confirmed. According to Daan, a
successful breakout could propel ETH toward the $4,000–$4,100
range, revisiting its cycle highs. However, he also expressed
caution, suggesting that if ETH does manage to reach this level, it
may encounter strong resistance, potentially leading to another
sharp rejection. Daan emphasized the importance of monitoring the
falling wedge trendline, noting that it will play a crucial role in
determining Ethereum’s next move. For now, the market remains in a
wait-and-see mode, with ETH navigating a precarious balance between
bullish breakout potential and the risk of further downside.
Related Reading: XRP Forms A Bullish Pattern In 4-Hour Chart –
Analyst Expects $4.20 After Breakout As Ethereum hovers around key
levels, traders and investors are closely watching for signs of a
definitive move. A breakout above the falling wedge could breathe
new life into ETH and reignite optimism, while failure to hold
support may lead to an extended period of consolidation or even a
deeper correction. The coming days will be critical in shaping
Ethereum’s trajectory, with its performance likely to influence
broader market sentiment. ETH Consolidates Above Key Demand
Ethereum (ETH) is trading at $3,322 after enduring several days of
choppy price action, reflecting the broader uncertainty in the
crypto market. The price has struggled to gain momentum as it
remains stuck in a tight range, testing the patience of investors
and traders alike. To ignite an uptrend, bulls must hold the
critical $3,300 support level, which has served as a key demand
zone in recent sessions. A decisive push above the $3,500
resistance level, which has capped ETH’s upward movement for weeks,
is essential to confirm a bullish breakout. Clearing this level
would likely reinvigorate market sentiment and attract fresh buying
interest, setting the stage for Ethereum to target higher price
levels in the coming days. Related Reading: Hedera Successfully
Retests Key Demand Level – Expert Says The Next Stop Could Be $0.52
However, the downside risks are significant. If ETH fails to hold
the $3,300 mark, it could trigger a wave of selling pressure,
leading to a deeper correction. Such a move could also cause
capitulation among investors who have grown disillusioned with
Ethereum’s underperformance compared to Bitcoin and other altcoins.
Featured image from Dall-E, chart from TradingView
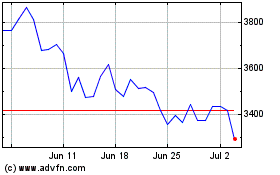
Ethereum (COIN:ETHUSD)
Historical Stock Chart
From Dec 2024 to Jan 2025

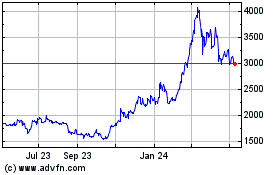
Ethereum (COIN:ETHUSD)
Historical Stock Chart
From Jan 2024 to Jan 2025
