Dogecoin Flashes Oversold Signal—Rebound Ahead?
February 19 2025 - 12:00PM
NEWSBTC
Dogecoin has once again dipped into oversold territory on its
4-hour chart on Tuesday, marking the most pronounced level of
selling pressure since the sudden capitulation on February 3.
During that episode, the price plunged to around $0.20 before
rebounding by 45% within the same trading day—a move that
underscored how quickly Dogecoin can rally from oversold
conditions. Dogecoin Price Plunges Into Oversold Zone In an
analysis today, crypto Analyst Cas Abbé (@cas_abbe) highlights an
RSI reading that has dipped to 30 on Tuesday, indicating that
selling pressure may be nearing its limit. Dogecoin’s path to this
oversold level began after it failed to maintain momentum near
$0.28. The cryptocurrency currently trades around $0.25, a zone
that Abbé identifies as historically prone to strong support. He
suggests that negative sentiment toward memecoins triggered by the
LIBRA meme coin disaster by Argentinian President Javier Milei
appears to have reached unprecedented lows. This, according to him,
could paradoxically create an attractive accumulation opportunity.
Related Reading: Dogecoin Repeating History? This Setup Led To 150%
Gains Abbé projects that Dogecoin could stage a short-term push to
$0.30, a psychologically significant level that coincides with
prior resistance. A move beyond $0.30 could open the door for a
test of the yearly high, although a sustained uptrend may hinge on
how broader market sentiment evolves and whether broader
risk-appetite improves. “DOGE has reached its most oversold level
since the February 3rd capitulation. Sentiment for memes has
reached an all-time low, which also presents a good opportunity to
accumulate cult memecoins. I’m expecting a short-term move towards
$0.3, followed by a new yearly high,” Abbé concludes. Related
Reading: Dogecoin Crash Signal Flashes: Analyst Warns Of A
Potential 40% Drop On Monday, Abbé also discussed a recurring
bullish pattern visible on the 3-day chart of Dogecoin. He traced
three distinct descending channels in Dogecoin’s price action—one
in Q4 2023, another in Q3 2024, and the current one unfolding in
early 2025. In both of the previous instances, Dogecoin broke above
the descending channel’s upper boundary, sparking gains exceeding
150%. Abbé points out that Dogecoin appears to be following a
similar downward-sloping channel today, ranging from approximately
$0.36 at its upper boundary to around $0.24 at its lower end. If
the same pattern holds true, a decisive break above the channel’s
resistance could trigger another triple-digit percentage rally.
However, if Dogecoin moves below that lower boundary, the bullish
setup observed in the prior two breakouts would face potential
invalidation. At press time, DOGE traded at $0.25. Featured image
created with DALL.E, chart from TradingView.com
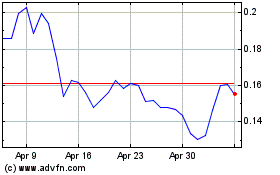
Dogecoin (COIN:DOGEUSD)
Historical Stock Chart
From Jan 2025 to Feb 2025

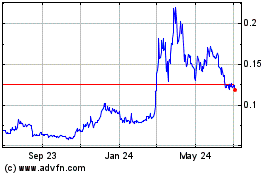
Dogecoin (COIN:DOGEUSD)
Historical Stock Chart
From Feb 2024 to Feb 2025
