UNITED STATES
SECURITIES AND EXCHANGE
COMMISSION
Washington, DC 20549
FORM 6-K
Report of Foreign Private
Issuer
Pursuant to Rule 13a-16
or 15d-16
Of the Securities Exchange
Act of 1934
For the month of
May 2024
Commission File Number:
001-38164
CALEDONIA
MINING CORPORATION PLC
(Translation of registrant's name into English)
B006 Millais House
Castle Quay
St Helier
Jersey JE2 3EF
(Address of principal executive offices)
Indicate by check mark whether the registrant
files or will file annual reports under cover Form 20-F or Form 40-F
Form 20-F
X Form 40-F ______
INCORPORATION
BY REFERENCE
Exhibits
99.1 to 99.4 included with this report on Form 6-K are expressly incorporated by reference into this report and are hereby
incorporated by reference as exhibits to the Registration Statement on Form F-3 of Caledonia Mining Corporation Plc (File No. 333-255500), as amended or supplemented.
Signatures
Pursuant to the requirements of the Securities
Exchange Act of 1934, the registrant has duly caused this report to be signed on its behalf by the undersigned, thereunto duly
authorized.
| |
CALEDONIA MINING CORPORATION
PLC
|
| |
(Registrant) |
|
| |
|
|
|
| |
By: |
/s/ Mark Learmonth |
|
| Dated: May 13, 2024 |
Name:
|
Mark Learmonth |
|
| |
Title: |
CEO and Director |
|
Exhibit Index
Exhibit 99.1
Caledonia Mining Corporation Plc
| MANAGEMENT’S
RESPONSIBILITY FOR FINANCIAL INFORMATION |
To the Shareholders of Caledonia Mining Corporation Plc:
Management has prepared the information and representations
in this interim report. The unaudited condensed consolidated interim financial statements of Caledonia Mining Corporation Plc and its
subsidiaries (the “Group”) have been prepared in accordance with IFRS Accounting Standards, as issued by the International
Accounting Standards Board (“IFRS”) and, where appropriate, these statements include some amounts that are based on best estimates
and judgment. Management has determined such amounts on a reasonable basis in order to ensure that the unaudited condensed consolidated
interim financial statements are presented fairly, in all material respects.
The accompanying Management Discussion and Analysis (“MD&A”)
also includes information regarding the impact of current transactions, sources of liquidity, capital resources, operating trends, risks
and uncertainties. Actual results in the future may differ materially from our present assessment of this information because future events
and circumstances may not occur as expected.
The Group maintains adequate systems of internal accounting
and administrative controls, within reasonable cost. Such systems are designed to provide reasonable assurance that relevant and reliable
financial information are produced.
Management is responsible for establishing and maintaining adequate
internal controls over financial reporting (“ICOFR”). Any system of ICOFR, no matter how well designed, has inherent limitations.
Therefore, even those systems determined to be effective can provide only reasonable assurance with respect to financial statement preparation
and presentation.
At March 31, 2024 management evaluated the effectiveness of
the Group’s ICOFR and concluded that such ICOFR was effective based on the criteria set forth in the Internal Control Integrated
Framework (2013) issued by the Committee of Sponsoring Organisations of the Treadway Commission.
The Board of Directors, through its Audit Committee, is responsible
for ensuring that management fulfils its responsibilities for financial reporting and internal control. The Audit Committee is composed
of four independent non-executive directors. This Committee meets periodically with management, the external auditor and internal auditor
to review accounting, auditing, internal control and financial reporting matters.
These unaudited condensed consolidated interim financial statements
have not been audited by the Group’s independent auditor.
The unaudited condensed consolidated interim financial statements
for the period ended March 31, 2024 were approved by the Board of Directors and signed on its behalf on May 13, 2024.
| (Signed) J.M. Learmonth | |
(Signed) C.O. Goodburn |
| | |
|
| Chief Executive Officer | |
Chief Financial Officer |
Caledonia Mining Corporation Plc
Consolidated statements of profit or loss and other comprehensive
income
(in thousands of United States Dollars, unless indicated otherwise)
| For the | |
| |
Three months ended | |
| | |
| |
March 31, | |
| Unaudited | |
Note | |
2024 | | |
2023 | |
| | |
| |
| | |
| |
| Revenue | |
| |
| 38,528 | | |
| 29,435 | |
| Royalty | |
| |
| (1,934 | ) | |
| (1,480 | ) |
| Production costs | |
6 | |
| (18,960 | ) | |
| (19,850 | ) |
| Depreciation | |
14 | |
| (3,819 | ) | |
| (2,255 | ) |
| Gross profit | |
| |
| 13,815 | | |
| 5,850 | |
| Net foreign exchange (loss) gain | |
7 | |
| (4,139 | ) | |
| 1,533 | |
| Administrative expenses | |
8 | |
| (2,611 | ) | |
| (5,938 | ) |
| Net derivative financial instrument expense | |
9 | |
| (302 | ) | |
| (434 | ) |
| Equity-settled share-based expense | |
10.2 | |
| (201 | ) | |
| (110 | ) |
| Cash-settled share-based expense | |
10.1 | |
| (53 | ) | |
| (280 | ) |
| Other expenses | |
11 | |
| (600 | ) | |
| (640 | ) |
| Other income | |
| |
| 164 | | |
| 18 | |
| Operating profit (loss) | |
| |
| 6,073 | | |
| (1 | ) |
| Finance income | |
12 | |
| 6 | | |
| 5 | |
| Finance cost | |
12 | |
| (732 | ) | |
| (772 | ) |
| Profit (loss) before tax | |
| |
| 5,347 | | |
| (768 | ) |
| Tax expense | |
| |
| (2,530 | ) | |
| (3,502 | ) |
| Profit (loss) for the period | |
| |
| 2,817 | | |
| (4,270 | ) |
| | |
| |
| | | |
| | |
| Other comprehensive income | |
| |
| | | |
| | |
| Items that are or may be reclassified to profit or loss | |
| |
| | | |
| | |
| Exchange differences on translation of foreign operations | |
| |
| (144 | ) | |
| (369 | ) |
| Total comprehensive income for the period | |
| |
| 2,673 | | |
| (4,639 | ) |
| | |
| |
| | | |
| | |
| Profit (loss) attributable to: | |
| |
| | | |
| | |
| Owners of the Company | |
| |
| 2,131 | | |
| (5,030 | ) |
| Non-controlling interests | |
| |
| 686 | | |
| 760 | |
| Profit (loss) for the period | |
| |
| 2,817 | | |
| (4,270 | ) |
| | |
| |
| | | |
| | |
| Total comprehensive income attributable to: | |
| |
| | | |
| | |
| Owners of the Company | |
| |
| 1,987 | | |
| (5,399 | ) |
| Non-controlling interests | |
| |
| 686 | | |
| 760 | |
| Total comprehensive income for the period | |
| |
| 2,673 | | |
| (4,639 | ) |
| | |
| |
| | | |
| | |
| Earnings (loss) per share | |
| |
| | | |
| | |
| Basic earnings (loss) per share ($) | |
| |
| 0.10 | | |
| (0.30 | ) |
| Diluted earnings (loss) per share ($) | |
| |
| 0.10 | | |
| (0.30 | ) |
The accompanying notes on pages 6 to 30 are an integral part of these consolidated financial
statements.
On behalf of the Board: “J.M. Learmonth”- Chief Executive Officer and “C.O.
Goodburn”- Chief Financial Officer.
Caledonia Mining Corporation Plc
Consolidated statements of financial position
(in thousands of United States Dollars, unless indicated otherwise)
| Unaudited | |
| |
March 31, | | |
December 31, | |
| As at | |
Note | |
2024 | | |
2023 | |
| | |
| |
| | |
| |
| Assets | |
| |
| | | |
| | |
| Exploration and evaluation assets | |
13 | |
| 94,702 | | |
| 94,272 | |
| Property, plant and equipment | |
14 | |
| 179,424 | | |
| 179,649 | |
| Deferred tax asset | |
| |
| 181 | | |
| 153 | |
| Total non-current assets | |
| |
| 274,307 | | |
| 274,074 | |
| | |
| |
| | | |
| | |
| Income tax receivable | |
| |
| 80 | | |
| 1,120 | |
| Inventories | |
15 | |
| 20,542 | | |
| 20,304 | |
| Derivative financial assets | |
9.1 | |
| 26 | | |
| 88 | |
| Trade and other receivables | |
16 | |
| 7,558 | | |
| 9,952 | |
| Prepayments | |
17 | |
| 3,947 | | |
| 2,538 | |
| Cash and cash equivalents | |
18 | |
| 1,831 | | |
| 6,708 | |
| Assets held for sale | |
19 | |
| 13,486 | | |
| 13,519 | |
| Total current assets | |
| |
| 47,470 | | |
| 54,229 | |
| Total assets | |
| |
| 321,777 | | |
| 328,303 | |
| | |
| |
| | | |
| | |
| Equity and liabilities | |
| |
| | | |
| | |
| Share capital | |
20 | |
| 165,147 | | |
| 165,068 | |
| Reserves | |
| |
| 137,876 | | |
| 137,819 | |
| Retained loss | |
| |
| (66,414 | ) | |
| (63,172 | ) |
| Equity attributable to shareholders | |
| |
| 236,609 | | |
| 239,715 | |
| Non-controlling interests | |
| |
| 24,407 | | |
| 24,477 | |
| Total equity | |
| |
| 261,016 | | |
| 264,192 | |
| | |
| |
| | | |
| | |
| Liabilities | |
| |
| | | |
| | |
| Deferred tax liabilities | |
| |
| 5,340 | | |
| 6,131 | |
| Provisions | |
21 | |
| 10,395 | | |
| 10,985 | |
| Loan notes - long term portion | |
22 | |
| 6,405 | | |
| 6,447 | |
| Cash-settled share-based payment - long term portion | |
10.1 | |
| 441 | | |
| 374 | |
| Lease liabilities - long term portion | |
| |
| 30 | | |
| 41 | |
| Total non-current liabilities | |
| |
| 22,611 | | |
| 23,978 | |
| | |
| |
| | | |
| | |
| Cash-settled share-based payment - short term portion | |
10.1 | |
| 313 | | |
| 920 | |
| Income tax payable | |
| |
| 102 | | |
| 10 | |
| Lease liabilities - short term portion | |
| |
| 141 | | |
| 167 | |
| Loan notes - short term portion | |
22 | |
| 665 | | |
| 665 | |
| Trade and other payables | |
23 | |
| 20,842 | | |
| 20,503 | |
| Overdraft and term loans | |
18 | |
| 15,991 | | |
| 17,740 | |
| Liabilities associated with assets held for sale | |
19 | |
| 96 | | |
| 128 | |
| Total current liabilities | |
| |
| 38,150 | | |
| 40,133 | |
| Total liabilities | |
| |
| 60,761 | | |
| 64,111 | |
| Total equity and liabilities | |
| |
| 321,777 | | |
| 328,303 | |
The accompanying notes on pages 6 to 30 are an integral part of these consolidated
financial statements.
Caledonia Mining Corporation Plc
Consolidated statements of changes in equity
For the years ended December 31,
(in thousands of United States Dollars, unless indicated otherwise)
Unaudited
| | |
Note | |
Share
capital | | |
Foreign
currency
translation
reserve | | |
Contributed
surplus | | |
Equity-
settled
share-based
payment
reserve | | |
Retained
loss | | |
Total | | |
Non-
controlling
interests
(NCI) | | |
Total
equity | |
| Balance December 31, 2022 | |
| |
| 83,471 | | |
| (9,787 | ) | |
| 132,591 | | |
| 14,997 | | |
| (50,222 | ) | |
| 171,050 | | |
| 22,409 | | |
| 193,459 | |
| Transactions with
owners: | |
| |
| | | |
| | | |
| | | |
| | | |
| | | |
| | | |
| | | |
| | |
| Dividends declared | |
| |
| - | | |
| - | | |
| - | | |
| - | | |
| (627 | ) | |
| (627 | ) | |
| (1,512 | ) | |
| (2,139 | ) |
| Share-based payments: | |
| |
| | | |
| | | |
| | | |
| | | |
| | | |
| | | |
| | | |
| | |
| - Shares issued on settlement of incentive plan awards | |
10.1 | |
| 351 | | |
| - | | |
| - | | |
| - | | |
| - | | |
| 351 | | |
| - | | |
| 351 | |
| - Equity-settled share-based expense | |
10.2 | |
| - | | |
| - | | |
| - | | |
| 110 | | |
| - | | |
| 110 | | |
| - | | |
| 110 | |
| Shares issued: | |
| |
| | | |
| | | |
| | | |
| | | |
| | | |
| | | |
| | | |
| | |
| - Bilboes acquisition | |
| |
| 62,394 | | |
| - | | |
| - | | |
| - | | |
| - | | |
| 62,394 | | |
| - | | |
| 62,394 | |
| - Equity raise (net of transaction cost) | |
20 | |
| 10,014 | | |
| - | | |
| - | | |
| - | | |
| - | | |
| 10,014 | | |
| - | | |
| 10,014 | |
| Total comprehensive
income: | |
| |
| - | | |
| - | | |
| - | | |
| - | | |
| - | | |
| | | |
| | | |
| | |
| (Loss) profit for the period | |
| |
| - | | |
| - | | |
| - | | |
| - | | |
| (5,030 | ) | |
| (5,030 | ) | |
| 760 | | |
| (4,270 | ) |
| Other comprehensive income for the
period | |
| |
| - | | |
| (369 | ) | |
| - | | |
| - | | |
| - | | |
| (369 | ) | |
| - | | |
| (369 | ) |
| Balance at March 31, 2023 | |
| |
| 156,230 | | |
| (10,156 | ) | |
| 132,591 | | |
| 15,107 | | |
| (55,879 | ) | |
| 237,893 | | |
| 21,657 | | |
| 259,550 | |
| | |
| |
| | | |
| | | |
| | | |
| | | |
| | | |
| | | |
| | | |
| | |
| Balance December 31, 2023 | |
| |
| 165,068 | | |
| (10,409 | ) | |
| 132,591 | | |
| 15,637 | | |
| (63,172 | ) | |
| 239,715 | | |
| 24,477 | | |
| 264,192 | |
| Transactions with
owners: | |
| |
| | | |
| | | |
| | | |
| | | |
| | | |
| | | |
| | | |
| | |
| Dividends declared* | |
| |
| - | | |
| - | | |
| - | | |
| - | | |
| (5,373 | ) | |
| (5,373 | ) | |
| (756 | ) | |
| (6,129 | ) |
| Share-based payments: | |
| |
| | | |
| | | |
| | | |
| | | |
| | | |
| | | |
| | | |
| | |
| - Shares issued on settlement of incentive plan awards | |
10.1 | |
| 79 | | |
| - | | |
| - | | |
| - | | |
| - | | |
| 79 | | |
| - | | |
| 79 | |
| - Equity-settled share-based expense | |
10.2 | |
| - | | |
| - | | |
| - | | |
| 201 | | |
| - | | |
| 201 | | |
| - | | |
| 201 | |
| Total comprehensive
income: | |
| |
| | | |
| | | |
| | | |
| | | |
| | | |
| | | |
| | | |
| | |
| Profit for the period | |
| |
| - | | |
| - | | |
| - | | |
| - | | |
| 2,131 | | |
| 2,131 | | |
| 686 | | |
| 2,817 | |
| Other comprehensive income for the
period | |
| |
| - | | |
| (144 | ) | |
| - | | |
| - | | |
| - | | |
| (144 | ) | |
| - | | |
| (144 | ) |
| Balance at March 31, 2024 | |
| |
| 165,147 | | |
| (10,553 | ) | |
| 132,591 | | |
| 15,838 | | |
| (66,414 | ) | |
| 236,609 | | |
| 24,407 | | |
| 261,016 | |
| | |
Note | |
| 20 | | |
| | | |
| | | |
| | | |
| | | |
| | | |
| | | |
| | |
* Dividends of $2.7
million declared on January 2, 2024 was paid on January 26, 2024. Dividends declared and accrued for on March 27, 2024 were $2.7 million.
Dividends to NCI declared and accrued for during the period amounted to $756.
The accompanying notes on pages 6 to 30 are an integral part of these consolidated
financial statements.
Caledonia Mining Corporation Plc
Consolidated statements of cash flows
For the years ended December 31,
(in thousands of United States Dollars, unless indicated otherwise)
| Unaudited | |
| |
Three months ended
March 31, | |
| | |
Note | |
2024 | | |
2023 | |
| | |
| |
| | |
| |
| Cash inflow from operations | |
24 | |
| 6,535 | | |
| 664 | |
| Interest received | |
| |
| 6 | | |
| 5 | |
| Finance costs paid | |
| |
| (573 | ) | |
| (200 | ) |
| Tax paid | |
| |
| (1,081 | ) | |
| (1,345 | ) |
| Net cash inflow (outflow) from operating activities | |
| |
| 4,887 | | |
| (876 | ) |
| | |
| |
| | | |
| | |
| Cash flows used in investing activities | |
| |
| | | |
| | |
| Acquisition of property, plant and equipment | |
14 | |
| (3,741 | ) | |
| (4,593 | ) |
| Acquisition of exploration and evaluation assets | |
13 | |
| (430 | ) | |
| (144 | ) |
| Acquisition of put options | |
9.1 | |
| (240 | ) | |
| – | |
| Net cash used in investing activities | |
| |
| (4,411 | ) | |
| (4,737 | ) |
| | |
| |
| | | |
| | |
| Cash flows from financing activities | |
| |
| | | |
| | |
| Dividends paid | |
| |
| (2,720 | ) | |
| (2,424 | ) |
| Payment of lease liabilities | |
| |
| (37 | ) | |
| (37 | ) |
| Shares issued – equity raise (net of transaction cost) | |
20 | |
| – | | |
| 10,823 | |
| Loan notes - Motapa payment | |
22.1 | |
| – | | |
| (5,399 | ) |
| Loan notes - solar bond issue receipts (net of transaction cost) | |
22.2 | |
| – | | |
| 4,500 | |
| Net cash (used in) from financing activities | |
| |
| (2,757 | ) | |
| 7,463 | |
| | |
| |
| | | |
| | |
| Net (decrease) increase in cash and cash equivalents | |
| |
| (2,281 | ) | |
| 1,850 | |
| Effect of exchange rate fluctuations on cash and cash equivalents | |
| |
| (847 | ) | |
| (157 | ) |
| Net cash and cash equivalents at the beginning of the period | |
| |
| (11,032 | ) | |
| 1,496 | |
| Net cash and cash equivalents at the end of the period | |
| |
| (14,160 | ) | |
| 3,189 | |
The accompanying notes on pages 6 to 30 are an integral part of these consolidated
financial statements.
Caledonia Mining Corporation Plc
Notes to the Condensed Consolidated Interim Financial Statements
For the period ended March 31, 2024 and 2023
(in thousands of United States Dollars, unless indicated otherwise)
Caledonia Mining Corporation Plc (“Caledonia” or
the “Company”) is a company domiciled in Jersey, Channel Islands. The Company’s registered office address is B006 Millais
House, Castle Quay, St Helier, Jersey, Channel Islands.
These unaudited condensed consolidated interim financial statements
as at and for the three months ended March 31, 2024 are of the Company and its subsidiaries (the “Group”). The Group’s
primary involvement is in the operation of a gold mine and the exploration and development of mineral properties for precious metals.
Caledonia’s shares are listed on the NYSE American LLC
stock exchange (symbol – “CMCL”). Depository interests in Caledonia’s shares are admitted to trading on AIM of
the London Stock Exchange plc (symbol – “CMCL”). Caledonia listed on the Victoria Falls Stock Exchange (“VFEX”)
(symbol – “CMCL”) on December 2, 2021. Caledonia voluntary delisted from the Toronto Stock Exchange (the “TSX”)
on June 19, 2020. After the delisting the Company remains a Canadian reporting issuer and has to comply with Canadian securities
laws until it demonstrates that Canadian shareholders represent less than 2% of issued share capital.
| (a) | Statement of compliance |
These unaudited condensed consolidated interim financial statements
have been prepared in accordance with IAS 34 Interim Financial Reporting and do not include all the information required for full annual
financial statements. Accordingly, certain information and disclosures normally included in the annual financial statements prepared in
accordance with IFRS Accounting Standards, as issued by the International Accounting Standards Board (“IFRS”) have been omitted
or condensed. Selected explanatory notes are included to explain events and transactions that are significant to an understanding of the
changes in the financial position and performance of the Group since the last annual consolidated financial statements as at and for the
year ended December 31, 2023.
These unaudited condensed consolidated interim financial statements
have been prepared on the historical cost basis except for:
| · | cash-settled share-based payment arrangements measured at fair value on grant and
re-measurement dates; |
| · | equity-settled share-based payment arrangements measured at fair value on the grant
date; and |
| · | derivative financial assets measured at fair value. |
These unaudited condensed consolidated interim financial statements
are presented in United States Dollar (“$” or “US Dollars” or “USD”), which is also the functional
currency of the Company. All financial information presented in US Dollars has been rounded to the nearest thousand, unless indicated
otherwise. Refer to note 7 for changes to Zimbabwean real-time gross settlement, bond notes or bond coins (“RTGS$”), the Zimbabwe
Gold (“ZiG”) and its effect on the consolidated statement of profit or loss and other comprehensive income.
Caledonia Mining Corporation Plc
Notes to the Condensed Consolidated Interim Financial Statements
For the period ended March 31, 2024 and 2023
(in thousands of United States Dollars, unless indicated otherwise)
| 3 | Use of accounting assumptions, estimates and judgements |
In preparing these unaudited condensed consolidated interim
financial statements, management has made accounting assumptions, estimates and judgements that affect the application of the Group’s
accounting policies and the reported amounts of assets, liabilities, income and expenses. Actual results may differ from these estimates.
Estimates and underlying assumptions are reviewed on an ongoing basis. Changes in estimates are recognised prospectively.
Judgement is required when assessing whether the Group controls
an entity or not. Controlled entities are consolidated. Further information is given in notes 4.
For judgement applied to:
| · | determine functional currency of entities in the Group and the use of the interbank
rate of exchange to translate RTGS$, refer to note 7. |
| 4 | Material accounting policies |
The same accounting policies and methods of computation, except
as included below, have been applied consistently to all periods presented in these unaudited condensed consolidated interim financial
statements as compared to the Group’s annual consolidated financial statements for the year ended December 31, 2023. In addition,
the accounting policies have been applied consistently throughout the Group.
| (a) | Exploration and evaluation assets |
Qualifying exploration costs are capitalised as incurred. Costs
incurred before the legal rights to explore are obtained are recognised in profit or loss. The costs related to speculative drilling on
unestablished orebodies at the Blanket Mine, general administrative or overhead costs are expensed as incurred. Exploration and evaluation
costs capitalised are disclosed under Exploration and evaluation assets. Qualifying direct expenditures include such costs as mineral
rights, options to acquire mineral rights, materials used, surveying costs, drilling costs, payments made to contractors, direct administrative
costs and depreciation on property, plant and equipment during the exploration phase.
Costs not directly attributable to exploration and evaluation
activities, including general administrative overhead costs, are expensed in the period they occur.
Once the technical feasibility and commercial viability of the
mining project have been determined, the property is considered to be a mine under development and moved to the mine development, infrastructure
and other asset category within property, plant and equipment. Capitalised direct costs related to the acquisition, exploration and development
of mineral properties remain capitalised, at their initial cost, until the properties to which they relate are ready for their intended
use, sold, abandoned or management has determined there to be impairment. Exploration and evaluation assets are tested for impairment
at least annually, and before the assets are transferred to mine development, infrastructure and other assets or when an indicator of
impairment is identified.
Exploration and evaluation assets are not depreciated.
Caledonia Mining Corporation Plc
Notes to the Condensed Consolidated Interim Financial Statements
For the period ended March 31, 2024 and 2023
(in thousands of United States Dollars, unless indicated otherwise)
| 4 | Material accounting policies (continued) |
| (a) | Exploration and evaluation assets (continued) |
The Group also makes assumptions and estimates regarding the
technical feasibility and commercial viability of its mineral projects and the possible impairment of E&E assets by evaluating whether
it is likely that future economic benefits will flow to the Group, which may be based on assumptions about future events or circumstances
e.g. such as the completion of a feasibility study indicating construction, funding and economic returns that are sufficient. Assumptions
and estimates made may change if new information becomes available. If information becomes available suggesting that the recovery of expenditures
is unlikely, the amount capitalised is written off in profit or loss in the period the new information becomes available. The recoverability
of the carrying amount of exploration and evaluation assets depends on the availability of sufficient funding to bring the properties
into commercial production, the price of the products to be recovered and the undertaking of profitable mining operations. As a result
of these uncertainties, the actual amount recovered may vary significantly from the carrying amount.
Non-current assets, or disposal groups comprising assets and
liabilities, are classified as held for sale if it is highly probable that they will be recovered primarily through sale rather than through
continuing use.
Such assets, or disposal groups, are generally measured at the
lower of their carrying amount or fair value less costs to sell. Impairment losses on initial classification as held for sale or held
for distribution and subsequent gains and losses on remeasurement are recognised in profit or loss.
Once classified as held for sale property, plant and equipment
are no longer depreciated.
Revenue comprises the sale of bullion.
Revenue is measured based on the consideration specified in
a contract with the customer. Revenue is recognised when bullion is transferred to the customer and the sales price is fixed. It is at
this point that the customer obtains control of the bullion and recovery of the consideration is probable.
In accordance with the requirements of the Zimbabwe Government,
all gold must be delivered to Fidelity Gold Refinery (Private) Limited (Fidelity), a subsidiary of the Reserve Bank of Zimbabwe), for
initial in-country refining.
In accordance with the requirements of the Zimbabwe Government,
25% of the gold must be sold to Fidelity and 75% may be exported under the gold dealing licence held by Fidelity and proceeds of gold
revenue are received 75% in USD and 25% in RTGS$.
Bilboes revenue during the year was recognised from sales to
Fidelity as a “small-scale producer” measured at the previous day’s 6pm London Bullion Market Association price less
a 5% discount. The revenue was received 100% in USD and settlement occurs immediately after the bullion is delivered.
Caledonia Mining Corporation Plc
Notes to the Condensed Consolidated Interim Financial Statements
For the period ended March 31, 2024 and 2023
(in thousands of United States Dollars, unless indicated otherwise)
| 5 | Blanket Zimbabwe Indigenisation Transaction |
On February 20, 2012 the Group announced it had signed a Memorandum
of Understanding (“MoU”) with the Minister of Youth, Development, Indigenisation and Empowerment of the Zimbabwean Government
pursuant to which the Group agreed that indigenous Zimbabweans would acquire an effective 51% ownership interest in the Zimbabwean company
owning the Blanket Mine (also referred to herein as “Blanket” or “Blanket Mine” as the context requires) for a
paid transactional value of $30.09 million. Pursuant to the above, members of the Group entered into agreements with each indigenous shareholder
to transfer 51% of the Group’s ownership interest in Blanket Mine whereby it:
| · | sold a 16% interest to the National Indigenisation and Economic Empowerment Fund
(“NIEEF”) for $11.74 million; |
| · | sold a 15% interest to Fremiro Investments (Private) Limited (“Fremiro”),
which is owned by indigenous Zimbabweans, for $11.01 million; |
| · | sold a 10% interest to Blanket Employee Trust Services (Private) Limited (“BETS”)
for the benefit of present and future managers and employees for $7.34 million. The shares in BETS are held by the Blanket Mine Employee
Trust (“Employee Trust”) with Blanket Mine’s employees holding participation units in the Employee Trust; and |
| · | donated a 10% ownership interest to the Gwanda Community Share Ownership Trust (“Community
Trust”). In addition, Blanket Mine paid a non-refundable donation of $1 million to the Community Trust. |
The Group facilitated the vendor funding of these transactions
which is repaid by way of dividends from Blanket Mine. 80% of dividends declared by Blanket Mine are used to repay such loans and the
remaining 20% unconditionally accrues to the respective indigenous shareholders. Following a modification to the interest rate on June
23, 2017, outstanding balances on these facilitation loans attract interest at a rate of the lower of a fixed 7.25% per annum payable
quarterly or 80% of the Blanket Mine dividend in the quarter. The timing of the loan repayments depends on the future financial performance
of Blanket Mine and the extent of future dividends declared by Blanket Mine. The Group related facilitation loans were transferred as
dividends in specie intra-group and now the loans and most of the interest thereon is payable to the Company.
Accounting treatment
The directors of Caledonia Holdings Zimbabwe (Private) Limited
(“CHZ”), a wholly-owned subsidiary of the Company, performed an assessment using the requirements of IFRS 10: Consolidated
Financial Statements (IFRS 10). It was concluded that CHZ should consolidate Blanket Mine after the indigenisation. The subscription agreements
with the indigenous shareholders have been accounted for accordingly as a transaction with non-controlling interests and as a share-based
payment transaction.
The subscription agreements, concluded on February 20, 2012,
were accounted for as follows:
| · | Non-controlling interests (“NCI”) were recognised on the portion of
shareholding upon which dividends declared by Blanket Mine will accrue unconditionally to equity holders as follows: |
| (a) | 20% of the 16% shareholding of NIEEF; |
| (b) | 20% of the 15% shareholding of Fremiro; and |
| (c) | 100% of the 10% shareholding of the Community Trust. |
| · | This effectively means that NCI was initially recognised at 16.2% of the net assets
of Blanket Mine, until the completion of the transaction with Fremiro, whereby the NCI reduced to 13.2% (see below). |
Caledonia Mining Corporation Plc
Notes to the Condensed Consolidated Interim Financial Statements
For the period ended March 31, 2024 and 2023
(in thousands of United States Dollars, unless indicated otherwise)
| 5 | Blanket Zimbabwe Indigenisation Transaction (continued) |
Accounting treatment (continued)
| · | The remaining 80% of the shareholding of NIEEF and Fremiro was recognised as NCI
to the extent that their attributable share of the net asset value of Blanket Mine exceeds the balance on the facilitation loans, including
interest. |
| · | The transaction with BETS is accounted for in accordance with IAS 19 Employee
Benefits (profit sharing arrangement) as the ownership of the shares does not ultimately pass to the employees. The employees are
entitled to participate in 20% of the dividends accruing to the 10% shareholding in Blanket Mine if they are employed at the date of such
distribution. To the extent that 80% of the attributable dividends exceeds the balance on the BETS facilitation loan, they will accrue
to the employees at the date of such declaration. |
| · | BETS is an entity effectively controlled and consolidated by Blanket Mine. Accordingly,
the shares held by BETS are effectively treated as treasury shares in Blanket Mine and no NCI is recognised. |
Fremiro purchase agreement
On November 5, 2018 the Company and Fremiro entered into a sale
agreement for Caledonia to purchase Fremiro’s 15% shareholding in Blanket Mine. On January 20, 2020 all substantive conditions to
the transaction were satisfied. The Company issued 727,266 shares to Fremiro for the cancellation of their facilitation loan and purchase
of Fremiro’s 15% shareholding in Blanket Mine. The transaction was accounted for as a repurchase of a previously vested equity instrument.
As a result, the Fremiro share of the NCI of $3,600 was derecognised, shares were issued at fair value, the share-based payment reserve
was reduced by $2,247 and the Company’s shareholding in Blanket Mine increased to 64% on the effective date.
Blanket Mine’s indigenisation shareholding percentages and facilitation loan
balances
| | |
| | |
Effective
interest & NCI | | |
NCI subject
to facilitation | | |
Balance of facilitation loan # | |
| USD | |
Shareholding | | |
recognised | | |
loan | | |
March 31, 2024 | | |
December 31, 2023 | |
| NIEEF | |
| 16 | % | |
| 3.2 | % | |
| 12.8 | % | |
| 8,087 | | |
| 8,489 | |
| Community Trust | |
| 10 | % | |
| 10.0 | % | |
| 0.0 | % | |
| – | | |
| – | |
| BETS ~ | |
| 10 | % | |
| - | * | |
| - | * | |
| 4,595 | | |
| 4,908 | |
| | |
| 36 | % | |
| 13.2 | % | |
| 12.8 | % | |
| 12,682 | | |
| 13,397 | |
* The shares held by BETS are effectively
treated as treasury shares (see above).
~ Accounted for under
IAS19 Employee Benefits.
# Facilitation loans are accounted
for as equity instruments and are accordingly not recognised as loans receivable.
The balance on the facilitation
loans is reconciled as follows:
| | |
2024 | | |
2023 | |
| | |
| | |
| |
| Balance at January 1 | |
| 13,397 | | |
| 15,026 | |
| Interest incurred | |
| 229 | | |
| 259 | |
| Dividends used to repay loan | |
| (944 | ) | |
| (1,888 | ) |
| Balance at March 31 | |
| 12,682 | | |
| 13,397 | |
Caledonia Mining Corporation Plc
Notes to the Condensed Consolidated Interim Financial Statements
For the period ended March 31, 2024 and 2023
(in thousands of United States Dollars, unless indicated otherwise)
| | |
2024 | | |
2023 | |
| | |
| | |
| |
| Blanket Mine | |
| 18,176 | | |
| 16,504 | |
| Salaries and wages | |
| 7,113 | | |
| 6,184 | |
| Consumable materials | |
| 6,319 | | |
| 5,569 | |
| Electricity costs | |
| 3,196 | | |
| 2,934 | |
| Safety | |
| 220 | | |
| 261 | |
| Cash-settled share-based expense (note 10.1(a)) | |
| 90 | | |
| 394 | |
| On mine administration | |
| 823 | | |
| 625 | |
| Security | |
| 305 | | |
| 239 | |
| Solar operations and maintenance services | |
| 51 | | |
| 279 | |
| Pre-feasibility exploration costs | |
| 59 | | |
| 19 | |
| | |
| | | |
| | |
| Bilboes | |
| 784 | | |
| 3,346 | |
| Salaries and wages | |
| 281 | | |
| 849 | |
| Consumable materials | |
| 169 | | |
| 1,862 | |
| Electricity costs | |
| 105 | | |
| 338 | |
| Cash-settled share-based expense (note 10.1(a)) | |
| 9 | | |
| – | |
| On mine administration | |
| 220 | | |
| 297 | |
| | |
| | | |
| | |
| | |
| 18,960 | | |
| 19,850 | |
| 7 | Net foreign exchange (loss) gain |
On October 1, 2018 the RBZ issued a directive to Zimbabwean banks
to separate foreign currency from RTGS$ in the accounts held by their clients and pegged the RTGS$ at 1:1 to the US Dollar. On February
20, 2019 the RBZ issued a further monetary policy statement, which allowed inter-bank trading between RTGS$ and foreign currency. The
interbank rate was introduced at 2.5 RTGS$ to 1 US Dollar and traded at 22,055.47 RTGS$ to 1 US Dollar as at March 31, 2024 (December
31, 2023: 6,104.72 RTGS$).
On April 5, 2024 the Reserve Bank of Zimbabwe issued a Monetary
Statement policy that introduced a structured currency (which is generally defined as a currency that is pegged to a specific exchange
rate or currency basket and backed by a bundle of foreign exchange assets (potentially including gold). The structured currency called
the ZiG replaced the RTGS$ from the said date. Banks were instructed to convert the RTGS$ balances into the new currency to foster simplicity,
certainty, and predictability in monetary and financial affairs. The new currency will co-circulate with other foreign currencies in the
economy. 75% of gold sales proceeds were received in US Dollar and the remainder in RTGS$ during the quarter. Post introduction of the
ZiG, 75% of gold proceeds were received in US Dollar and the remainder in ZiG.
The US Dollar has remained the primary currency in which the
Group’s Zimbabwean entities operate and the functional currency of these entities.
Caledonia Mining Corporation Plc
Notes to the Condensed Consolidated Interim Financial Statements
For the period ended March 31, 2024 and 2023
(in thousands of United States Dollars, unless indicated otherwise)
| 7 | Net foreign exchange (loss) gain (continued) |
The table below illustrates the effect the weakening of the
RTGS$ and other foreign currencies had on the consolidated statement of profit or loss.
| | |
2024 | | |
2023 | |
| | |
| | |
| |
| Net unrealised foreign exchange (loss) gain | |
| (574 | ) | |
| 1,749 | |
| Taxation foreign exchange gains | |
| 1,297 | | |
| 1,694 | |
| VAT receivable foreign exchange losses | |
| (1,292 | ) | |
| (304 | ) |
| Other unrealised foreign exchange (losses) gains | |
| (579 | ) | |
| 359 | |
| | |
| | | |
| | |
| Net realised foreign exchange loss | |
| (3,565 | ) | |
| (216 | ) |
| Bullion sales receivable foreign exchange losses | |
| (1,293 | ) | |
| (301 | ) |
| Cash and cash equivalents foreign exchange losses | |
| (1,130 | ) | |
| (384 | ) |
| VAT receivables foreign exchange losses | |
| (364 | ) | |
| (66 | ) |
| Trade and other payables foreign exchange (losses) gains | |
| 69 | | |
| 1,217 | |
| Other realised foreign exchange losses | |
| (847 | ) | |
| (682 | ) |
| | |
| | | |
| | |
| Net foreign exchange (loss) gain | |
| (4,139 | ) | |
| 1,533 | |
| | |
2024 | | |
2023 | |
| | |
| | |
| |
| Investor relations | |
| 135 | | |
| 163 | |
| Audit fee | |
| 79 | | |
| 69 | |
| Advisory services fees | |
| 244 | | |
| 3,427 | |
| Listing fees | |
| 149 | | |
| 239 | |
| Directors fees – Company | |
| 170 | | |
| 172 | |
| Directors fees – Blanket | |
| 19 | | |
| 15 | |
| Employee costs | |
| 1,205 | | |
| 1,380 | |
| Other office administration cost | |
| 52 | | |
| 67 | |
| Information technology and communication cost– Group related | |
| 83 | | |
| 29 | |
| Management liability insurance | |
| 353 | | |
| 243 | |
| Travel costs | |
| 122 | | |
| 134 | |
| | |
| 2,611 | | |
| 5,938 | |
Caledonia Mining Corporation Plc
Notes to the Condensed Consolidated Interim Financial Statements
For the period ended March 31, 2024 and 2023
(in thousands of United States Dollars, unless indicated otherwise)
| 9 | Derivative financial instruments |
The fair value of derivative financial instruments not traded in an active
market is determined by using valuation techniques. These valuation techniques maximise the use of observable market data where available.
The company did not apply hedge accounting to the derivative financial instruments and all fair value losses were recorded in the consolidated
statements of profit or loss and other comprehensive income. Transaction costs are recognised in profit or loss as incurred.
| Derivative financial instrument expenses | |
| |
2024 | | |
2023 | |
| | |
| |
| | |
| |
| Put options | |
9.1(a) | |
| 302 | | |
| 434 | |
| | |
| |
| 302 | | |
| 434 | |
| 9.1 | Derivative financial assets |
| | |
| |
2024 | | |
December 31,
2023 | |
| | |
| |
| | |
| |
| Put options | |
9.1(a) | |
| 26 | | |
| 88 | |
| | |
| |
| 26 | | |
| 88 | |
From December 2022 to the date of approval of these financial statements the Company had the
following put options to hedge our gold price risk:
| Purchase date |
Ounces hedged |
Strike price |
Period of hedge |
| December 22, 2022 |
16,672 |
$1,750 |
December 2022 - May 2023 |
| May 22, 2023 |
28,000 |
$1,900 |
June - December 2023 |
| December 19, 2023 |
12,000 |
$1,950 |
January - March 2024 |
| March 7, 2024 |
12,000 |
$2,050 |
April to June 2024 |
| April 10, 2024 |
12,000 |
$2,100 |
July to September 2024 |
The put options were entered into to protect the Company against gold prices
lower than the strike price over the period hedged. The options are “out-of-the-money" put options which lock in a minimum
price over the number of ounces that are subject to the hedge for an initial option price. These arrangements carry no further financial
obligations, such as margin calls.
All put options were classified as level 1 in the fair value hierarchy.
Caledonia Mining Corporation Plc
Notes to the Condensed Consolidated Interim Financial Statements
For the period ended March 31, 2024 and 2023
(in thousands of United States Dollars, unless indicated otherwise)
| 10.1 | Cash-settled share-based payments |
| (a) | Restricted Share Units and Performance Units |
Certain management and employees within the Group are granted
Restricted Share Units (“RSUs”) and Performance Units (”PUs”) pursuant to provisions of the 2015 Omnibus Equity
Incentive Compensation Plan (“OEICP”). All RSUs and PUs were granted and approved at the discretion of the Compensation Committee
of the Board of Directors.
RSUs vest three years after grant date given that the service
conditions of the relevant employees have been fulfilled. The value of the vested RSUs is the number of RSUs vested multiplied by the
fair market value of the Company’s shares, as specified by the OEICP, on the date of settlement.
PUs have a performance condition based on gold production and,
in recent awards, average normalised controllable cost per ounce of gold and a performance period of one to three years. The number of
PUs that vest will be the relevant portion of the PUs granted multiplied by the performance multiplier, which will reflect the actual
performance in terms of the performance conditions compared to expectations on the date of the award.
RSU holders are entitled to receive dividends over the vesting
period. Such dividends will be reinvested in additional RSUs at the then applicable share price. PUs have rights to dividends only after
they have vested.
RSUs and PUs allow for settlement of the vesting date value in
cash or, subject to conditions, shares issuable at fair market value or a combination of both at the discretion of the unitholder.
The fair value of the RSUs at the reporting date was based on
the Black Scholes option valuation model less the fair value of the expected dividends during the vesting period multiplied by the performance
multiplier expectation. The fair value of the PUs at the reporting date was based on the Black Scholes option valuation model. At the
reporting date it was assumed that there is a 93%-100% probability that the performance conditions will be met and therefore a 93%-100%
(2023: 93%-100%) average performance multiplier was used in calculating the estimated liability.
The liability as at March 31, 2024 amounted to $754 (December
31, 2023: $1,294). Included in the liability as at March 31, 2024 is an amount of $99 (2023: $394) that was expensed and classified as
production costs; refer to note 6.
Caledonia Mining Corporation Plc
Notes to the Condensed Consolidated Interim Financial Statements
For the period ended March 31, 2024 and 2023
(in thousands of United States Dollars, unless indicated otherwise)
| 10 | Share-based payments (continued) |
| 10.1 | Cash-settled share-based payments (continued) |
| (a) | Restricted Share Units and Performance Units (continued) |
The cash-settled share-based expense for PUs for the period amounted
to $53 (2023: $280). During the period PUs to the value of $79 were settled in share capital (net of employee tax) (2023: $351) with the
employee tax portion recognised in profit or loss.
On April 8, 2024 167,935 PUs were granted to certain management
and employees within the Group.
The following assumptions were used in estimating the fair value
of the cash-settled share-based payment liability on:
| | |
March 31, 2024 | | |
December 31, 2023 | |
| | |
PUs | | |
PUs | |
| Risk free rate | |
| 3.88 | % | |
| 3.88 | % |
| Fair value (USD) | |
| 11.07 | | |
| 12.20 | |
| Share price (USD) | |
| 11.07 | | |
| 12.20 | |
| Performance multiplier percentage | |
| 93-100 | % | |
| 93-100 | % |
| Volatility | |
| 0.76 | | |
| 0.90 | |
| | |
| | | |
| | |
| Share units granted: | |
PUs | | |
PUs | |
| Grant - January 11, 2021 | |
| 35,341 | | |
| 56,244 | |
| Grant - May 14, 2021 | |
| 482 | | |
| 964 | |
| Grant - June 1, 2021 | |
| 375 | | |
| 1,310 | |
| Grant - June 14, 2021 | |
| 199 | | |
| 398 | |
| Grant - September 6, 2021 | |
| 229 | | |
| 458 | |
| Grant - September 20, 2021 | |
| 230 | | |
| 460 | |
| Grant - October 1, 2021 | |
| 508 | | |
| 1,016 | |
| Grant - October 11, 2021 | |
| 225 | | |
| 450 | |
| Grant - November 12, 2021 | |
| 923 | | |
| 1,846 | |
| Grant - December 1, 2021 | |
| 225 | | |
| 900 | |
| Grant - January 11, 2022 | |
| 41,386 | | |
| 75,198 | |
| Grant - January 12, 2022 | |
| 556 | | |
| 825 | |
| Grant - May 13, 2022 | |
| 1,894 | | |
| 2,040 | |
| Grant - June 1, 2022 | |
| – | | |
| 1,297 | |
| Grant - July 1, 2022 | |
| 1,899 | | |
| 2,375 | |
| Grant - October 1, 2022 | |
| 1,800 | | |
| 2,024 | |
| Grant - April 7, 2023 | |
| 73,464 | | |
| 79,521 | |
| Grant - May 15, 2023 | |
| – | | |
| 581 | |
| Grant - June 1, 2023 | |
| 617 | | |
| 617 | |
| Grant - June 7, 2023 | |
| 572 | | |
| 572 | |
| Grant - August 10, 2023 | |
| 5,514 | | |
| 5,514 | |
| Grant - September 1, 2023 | |
| 1,617 | | |
| 1,617 | |
| Grant - October 3, 2023 | |
| 14,258 | | |
| 14,258 | |
| Settlements/ terminations | |
| (62,540 | ) | |
| (68,171 | ) |
| Total awards outstanding | |
| 119,774 | | |
| 182,314 | |
Caledonia Mining Corporation Plc
Notes to the Condensed Consolidated Interim Financial Statements
For the period ended March 31, 2024 and 2023
(in thousands of United States Dollars, unless indicated otherwise)
| 10 | Share-based payments (continued) |
| 10.2 | Equity-settled share-based payments |
PUs which are classified as equity-settled (i.e. there is no
option to vest in cash) (“EPUs”) have a performance condition based on gold production, average normalised controllable cost
per ounce of gold and a performance period of three years. The number of EPUs that vest will be the relevant portion of the EPUs granted
multiplied by the performance multiplier, which will reflect the actual performance in terms of the performance conditions compared to
expectations on the date of the award.
EPUs have rights to dividends only after they have vested.
The shares issued are subject to a minimum holding period of
until at least the first anniversary of the EPUs vesting date.
The fair value of the EPUs at the reporting date was based on
the Black Scholes option valuation model less the fair value of the expected dividends during the vesting period multiplied by the performance
percentage. At the reporting date it was assumed that there is a 100% probability that the performance conditions will be met and therefore
a 100% performance multiplier was used in calculating the expense. The equity-settled share-based expense for EPUs as at March 31, 2024
amounted to $201 (2023: $110).
The following assumptions were used in estimating the fair value
of the equity-settled share-based payment that are in issue on:
| Grant date | |
| January 24, 2022 | | |
| April 7, 2023 | |
| Number of units - remaining at reporting date | |
| 113,693 | | |
| 80,773 | |
| Share price (USD) - grant date | |
| 11.50 | | |
| 16.91 | |
| Fair value (USD) - grant date | |
| 10.15 | | |
| 15.33 | |
| Performance multiplier percentage at grant date | |
| 100 | % | |
| 100 | % |
On April 8, 2024 125,433 EPUs were granted to certain management
within the Group.
| | |
2024 | | |
2023 | |
| | |
| | |
| |
| Intermediated Money Transaction Tax* | |
| 254 | | |
| 382 | |
| Community and social responsibility cost | |
| 346 | | |
| 258 | |
| | |
| 600 | | |
| 640 | |
| * |
Intermediated Money Transfer Tax ("IMTT”) is tax chargeable
in Zimbabwe on transfer of physical money, electronically or by any other means, between two or more persons. IMTT is levied at a
rate of 2% on RTGS transactions and 1% on foreign currency transactions. |
Caledonia Mining Corporation Plc
Notes to the Condensed Consolidated Interim Financial Statements
For the period ended March 31, 2024 and 2023
(in thousands of United States Dollars, unless indicated otherwise)
| 12 | Finance income and finance cost |
| | |
2024 | | |
2023 | |
| | |
| | |
| |
| Finance income received - Bank | |
| 6 | | |
| 5 | |
| | |
| | | |
| | |
| Unwinding of rehabilitation provision (note 21) | |
| 198 | | |
| 66 | |
| Finance cost - Leases | |
| 3 | | |
| 6 | |
| Finance cost - Overdraft and term loans | |
| 357 | | |
| 200 | |
| Finance cost - Solar loan notes payable (note 22.1) | |
| 174 | | |
| 25 | |
| Finance cost - Motapa loan notes payable | |
| – | | |
| 475 | |
| | |
| 732 | | |
| 772 | |
Caledonia Mining Corporation Plc
Notes to the Condensed Consolidated Interim Financial Statements
For the period ended March 31, 2024 and 2023
(in thousands of United States Dollars, unless indicated otherwise)
| 13 | Exploration and evaluation assets |
| | |
Bilboes Gold | | |
Motapa | | |
Maligreen | | |
GG | | |
Sabiwa | | |
Abercorn | | |
Valentine | | |
Total | |
| | |
| | |
| | |
| | |
| | |
| | |
| | |
| | |
| |
| Balance at January 1, 2023 | |
| – | | |
| 7,844 | | |
| 5,626 | | |
| 3,723 | | |
| 294 | | |
| 27 | | |
| 65 | | |
| 17,579 | |
| Acquisition costs: | |
| | | |
| | | |
| | | |
| | | |
| | | |
| | | |
| | | |
| | |
| - Bilboes Gold | |
| 73,198 | | |
| – | | |
| – | | |
| – | | |
| – | | |
| – | | |
| – | | |
| 73,198 | |
| Decommissioning asset acquired | |
| – | | |
| 1,466 | | |
| 152 | | |
| – | | |
| – | | |
| – | | |
| – | | |
| 1,618 | |
| Exploration costs: | |
| | | |
| | | |
| | | |
| | | |
| | | |
| | | |
| | | |
| | |
| - Consumables and drilling | |
| – | | |
| 903 | | |
| 102 | | |
| – | | |
| – | | |
| – | | |
| – | | |
| 1,005 | |
| - Contractor | |
| – | | |
| 2 | | |
| – | | |
| – | | |
| – | | |
| – | | |
| – | | |
| 2 | |
| - Labour | |
| – | | |
| 377 | | |
| 111 | | |
| – | | |
| – | | |
| – | | |
| – | | |
| 488 | |
| - Power | |
| – | | |
| – | | |
| 7 | | |
| – | | |
| – | | |
| – | | |
| – | | |
| 7 | |
| - Other | |
| 375 | | |
| – | | |
| – | | |
| – | | |
| – | | |
| – | | |
| – | | |
| 375 | |
| Balance at December 31, 2023 | |
| 73,573 | | |
| 10,592 | | |
| 5,998 | | |
| 3,723 | | |
| 294 | | |
| 27 | | |
| 65 | | |
| 94,272 | |
| Exploration costs: | |
| | | |
| | | |
| | | |
| | | |
| | | |
| | | |
| | | |
| | |
| - Consumables and drilling | |
| – | | |
| 209 | | |
| 2 | | |
| – | | |
| – | | |
| – | | |
| – | | |
| 211 | |
| - Contractor | |
| – | | |
| – | | |
| 5 | | |
| – | | |
| – | | |
| – | | |
| – | | |
| 5 | |
| - Labour | |
| – | | |
| 115 | | |
| – | | |
| 51 | | |
| – | | |
| – | | |
| – | | |
| 166 | |
| - Power | |
| – | | |
| – | | |
| – | | |
| – | | |
| – | | |
| – | | |
| – | | |
| – | |
| - Other | |
| 48 | | |
| – | | |
| – | | |
| – | | |
| – | | |
| – | | |
| – | | |
| 48 | |
| Balance at March 31, 2024 | |
| 73,621 | | |
| 10,916 | | |
| 6,005 | | |
| 3,774 | | |
| 294 | | |
| 27 | | |
| 65 | | |
| 94,702 | |
Caledonia Mining Corporation Plc
Notes to the Condensed Consolidated Interim Financial Statements
For the period ended March 31, 2024 and 2023
(in thousands of United States Dollars, unless indicated otherwise)
| 14 | Property, plant and equipment |
| Cost | |
Land
and Buildings | | |
Right
of
use assets | | |
Mine
development,
infrastructure
and other | | |
Assets
under
construction and
decommissioning
assets | | |
Plant
and
equipment | | |
Furniture
and
fittings | | |
Motor
vehicles | | |
Solar Plant& | | |
Total | |
| | |
| | |
| | |
| | |
| | |
| | |
| | |
| | |
| | |
| |
| Balance at January 1, 2023 | |
| 15,194 | | |
| 525 | | |
| 82,154 | | |
| 46,453 | | |
| 70,485 | | |
| 1,563 | | |
| 3,314 | | |
| 14,138 | | |
| 233,826 | |
| Additions* | |
| – | | |
| – | | |
| – | | |
| 28,276 | | |
| 538 | | |
| 335 | | |
| 294 | | |
| 163 | | |
| 29,606 | |
| Impairments~ | |
| – | | |
| – | | |
| (872 | ) | |
| – | | |
| (36 | ) | |
| – | | |
| – | | |
| – | | |
| (908 | ) |
| Disposals | |
| – | | |
| – | | |
| – | | |
| – | | |
| (33 | ) | |
| – | | |
| – | | |
| – | | |
| (33 | ) |
| Reallocate to assets held for sale | |
| – | | |
| – | | |
| – | | |
| – | | |
| – | | |
| – | | |
| – | | |
| (14,301 | ) | |
| (14,301 | ) |
| Reallocations between asset classes | |
| 1,492 | | |
| – | | |
| 37,116 | | |
| (39,099 | ) | |
| 491 | | |
| – | | |
| – | | |
| – | | |
| – | |
| Foreign exchange movement | |
| – | | |
| (24 | ) | |
| – | | |
| (2 | ) | |
| – | | |
| (37 | ) | |
| (3 | ) | |
| – | | |
| (66 | ) |
| Balance at December 31, 2023 | |
| 16,686 | | |
| 501 | | |
| 118,398 | | |
| 35,628 | | |
| 71,445 | | |
| 1,861 | | |
| 3,605 | | |
| – | | |
| 248,124 | |
| Additions* | |
| – | | |
| – | | |
| – | | |
| 3,612 | | |
| (16 | ) | |
| 2 | | |
| – | | |
| – | | |
| 3,598 | |
| Reallocations between asset classes | |
| – | | |
| – | | |
| – | | |
| 131 | | |
| (131 | ) | |
| – | | |
| – | | |
| – | | |
| – | |
| Foreign exchange movement | |
| – | | |
| (5 | ) | |
| – | | |
| (1 | ) | |
| – | | |
| (10 | ) | |
| (1 | ) | |
| – | | |
| (17 | ) |
| Balance at March 31, 2024 | |
| 16,686 | | |
| 496 | | |
| 118,398 | | |
| 39,370 | | |
| 71,298 | | |
| 1,853 | | |
| 3,604 | | |
| – | | |
| 251,705 | |
| * |
Included in additions is the change in estimate for the decommissioning
asset of ($788) (2023: $1,962) due to change in the Life of Mine (“LoM”) estimate to 2041. |
| & |
The solar plant was fully commissioned
on February 2, 2023 and the sale agreement between Caledonia Mining Corporation Plc and Caledonia Mining Services (Private) Limited
was concluded for the sale of the solar plant. Depreciation on the solar plant commenced on February 2, 2023 and the power
purchase agreement, between Caledonia Mining Services (Private) Limited and Blanket Mine, became effective. From September 28, 2023
the solar plant is classified as held for sale.
In December 2022, the Caledonia board
approved a proposal for Caledonia Mining Services (Private) Limited (which owns the solar plant) to issue loan notes pursuant to
a loan note instrument (“bonds”) up to a value of $12 million. The decision was taken in order to optimise the capital
structure of the Group and provide additional debt instruments to the Zimbabwean financial market. Refer to note 22.1 for more information
on these loan notes. |
| ~ |
On June 27, 2023 the decision was taken to place the Bilboes oxide mine
on care and maintenance as the cost related to removing the waste and accessing the orebody could exceed the benefit from the gold
revenues to be received. The impairment loss that was recognised amounted to a carrying value of $851 on impairing the Bilboes oxide
asset classified under mine development, infrastructure and other. Mining and metallurgical processing continued at the Bilboes oxide
mine until the end of September 2023 when the contract miner's notice period came to an end. Leaching of material that has
already been deposited on the leach pad will continue while the revenue from these activities contributes to the cost of the asset.
Oxide mining and processing will resume when the stripping of the waste for the sulphide project commences and can be economically
justified. |
Caledonia Mining Corporation Plc
Notes to the Condensed Consolidated Interim Financial Statements
For the period ended March 31, 2024 and 2023
(in thousands of United States Dollars, unless indicated otherwise)
| 14 | Property, plant and equipment (continued) |
Accumulated depreciation and
Impairment losses | |
Land
and
Buildings | | |
Right
of
use assets | | |
Mine
development,
infrastructure
and other | | |
Assets
under
construction and
decommissioning
assets | | |
Plant
and
equipment | | |
Furniture
and
fittings | | |
Motor
vehicles | | |
Solar
Plant | | |
Total | |
| | |
| | |
| | |
| | |
| | |
| | |
| | |
| | |
| | |
| |
| Balance at January 1, 2023 | |
| 8,350 | | |
| 230 | | |
| 12,368 | | |
| 693 | | |
| 29,257 | | |
| 1,100 | | |
| 2,845 | | |
| – | | |
| 54,843 | |
| Depreciation for the year | |
| 1,012 | | |
| 124 | | |
| 5,459 | | |
| 93 | | |
| 6,573 | | |
| 185 | | |
| 258 | | |
| 782 | | |
| 14,486 | |
| Assets held for sale | |
| – | | |
| – | | |
| – | | |
| – | | |
| – | | |
| – | | |
| – | | |
| (782 | ) | |
| (782 | ) |
| Accumulated depreciation impairments | |
| – | | |
| – | | |
| (21 | ) | |
| – | | |
| (10 | ) | |
| – | | |
| – | | |
| – | | |
| (31 | ) |
| Foreign exchange movement | |
| – | | |
| (9 | ) | |
| – | | |
| – | | |
| – | | |
| (30 | ) | |
| (2 | ) | |
| – | | |
| (41 | ) |
| Balance at December 31, 2023 | |
| 9,362 | | |
| 345 | | |
| 17,806 | | |
| 786 | | |
| 35,820 | | |
| 1,255 | | |
| 3,101 | | |
| – | | |
| 68,475 | |
| Depreciation for the period | |
| 279 | | |
| 31 | | |
| 1,480 | | |
| 23 | | |
| 1,901 | | |
| 43 | | |
| 62 | | |
| – | | |
| 3,819 | |
| Foreign exchange movement | |
| – | | |
| (4 | ) | |
| – | | |
| – | | |
| – | | |
| (8 | ) | |
| (1 | ) | |
| – | | |
| (13 | ) |
| Balance at March 31, 2024 | |
| 9,641 | | |
| 372 | | |
| 19,286 | | |
| 809 | | |
| 37,721 | | |
| 1,290 | | |
| 3,162 | | |
| – | | |
| 72,281 | |
| | |
| | | |
| | | |
| | | |
| | | |
| | | |
| | | |
| | | |
| | | |
| | |
| Carrying amounts | |
| | | |
| | | |
| | | |
| | | |
| | | |
| | | |
| | | |
| | | |
| | |
| At December 31, 2023 | |
| 7,324 | | |
| 156 | | |
| 100,592 | | |
| 34,842 | | |
| 35,625 | | |
| 606 | | |
| 504 | | |
| – | | |
| 179,649 | |
| At March 31, 2024 | |
| 7,045 | | |
| 124 | | |
| 99,112 | | |
| 38,561 | | |
| 33,577 | | |
| 563 | | |
| 442 | | |
| – | | |
| 179,424 | |
Caledonia Mining Corporation Plc
Notes to the Condensed Consolidated Interim Financial Statements
For the period ended March 31, 2024 and 2023
(in thousands of United States Dollars, unless indicated otherwise)
| | |
2024 | | |
December 31,
2023 | |
| | |
| | |
| |
| Consumable stores* | |
| 19,206 | | |
| 18,001 | |
| Gold in progress @ | |
| 1,336 | | |
| 2,303 | |
| | |
| 20,542 | | |
| 20,304 | |
| * |
Included in consumables stores is an amount of ($1,793) (December 31, 2023: ($1,793)) for provision
for obsolete stock for items that are not compatible with plant and equipment currently in use. |
| @ |
Gold work in progress balance as at March 31, 2024 consists of 1,656 ounces (December 31, 2023:
3,057 ounces). |
| 16 | Trade and other receivables |
| | |
2024 | | |
December 31,
2023 | |
| | |
| | |
| |
| Bullion sales receivable | |
| 3,879 | | |
| 5,403 | |
| VAT receivables | |
| 3,152 | | |
| 4,259 | |
| Deposits for stores, equipment and other receivables | |
| 527 | | |
| 290 | |
| | |
| 7,558 | | |
| 9,952 | |
The carrying value of trade receivables is considered a reasonable approximation
of fair value and are short term in nature. No provision for expected credit losses was recognised in the current or prior period as none
of the debtors were past due and there has been no doubtful debt on debtors. Up to the date of approval of these financial statements
all of the outstanding bullion sales receivable were settled in full. The Company allocated the VAT receivables equating to $0.74 million
on March 25, 2024 against liabilities due for the March Quarterly Payment Dates (“QPD’s”) administrated by the Zimbabwe
Revenue Authority.
| | |
2024 | | |
December 31,
2023 | |
| | |
| | |
| |
| Caledonia Mining South Africa (Proprietary) Limited (“CMSA”) suppliers | |
| 269 | | |
| 527 | |
| Blanket Mine third party suppliers | |
| 3,462 | | |
| 1,746 | |
| Other prepayments | |
| 216 | | |
| 265 | |
| | |
| 3,947 | | |
| 2,538 | |
Caledonia Mining Corporation Plc
Notes to the Condensed Consolidated Interim Financial Statements
For the period ended March 31, 2024 and 2023
(in thousands of United States Dollars, unless indicated otherwise)
| 18 | Cash and cash equivalents |
| | |
2024 | | |
December 31,
2023 | |
| | |
| | |
| |
| Bank balances | |
| 1,831 | | |
| 4,252 | |
| Restricted cash * | |
| – | | |
| 2,456 | |
| Cash and cash equivalents | |
| 1,831 | | |
| 6,708 | |
| Bank overdrafts and short term loans used for cash management purposes | |
| (15,991 | ) | |
| (17,740 | ) |
| Net cash and cash equivalents | |
| (14,160 | ) | |
| (11,032 | ) |
| * |
Cash of $2,456 (denominated in RTGS$) held by Blanket Mine was earmarked
by Stanbic Bank Zimbabwe as a letter of credit in favour of CMSA. The letter of credit was issued by Stanbic Bank Zimbabwe on November
28, 2023 and settled in January, 2024. The cash on maturity was transferred to CMSA’s bank account, denominated in South African
Rands. |
| |
Date drawn |
Expiry |
Repayment
term |
Principal
value |
Balance drawn at
March 31, 2024 |
| Overdraft facilities and term loans |
|
|
|
|
|
| Stanbic Bank - RTGS$ denomination |
September 2023 |
June 2024 |
On demand |
RTGS$350 million |
$Nil million |
| Stanbic Bank - USD denomination |
September 2023 |
June 2024 |
On demand |
$4 million |
$3.9 Million |
| Ecobank - USD denomination |
November 2022 |
December 2024 |
On demand |
$5 million |
$5.1 million |
| Nedbank Zimbabwe - USD denomination |
April 2023 |
April 2025 |
On demand |
$7 million |
$5.0 million |
| CABS - USD denomination |
August 2023 |
July 2024 |
On demand |
$2 million |
$2 million |
| CABS - USD denomination |
March 2023 |
March 2027 |
On demand |
$3 million |
$Nil million |
Caledonia Mining Corporation Plc
Notes to the Condensed Consolidated Interim Financial Statements
For the period ended March 31, 2024 and 2023
(in thousands of United States Dollars, unless indicated otherwise)
| 19 | Assets and liabilities associated with assets held for sale |
| | |
2024 | | |
December 31,
2023 | |
| Non-current assets held for sale | |
| | | |
| | |
| Solar plant | |
| 13,486 | | |
| 13,519 | |
| | |
| | | |
| | |
| Liabilities associated with assets held for sale | |
| | | |
| | |
| Site restoration liability | |
| 96 | | |
| 128 | |
In the second quarter of 2023 management embarked on a marketing process
to locate a buyer for the Company’s solar plant located next to Blanket Mine. Various offers were received and a counterparty with
a non-binding offer was given exclusivity to further negotiate the sale of the plant after proving their ability to operate and fund solar
plants of similar size and complexity. The offer was received from a reputable global renewable energy operator and management is in an
advanced stage of executing agreements to sell the solar plant. It is proposed that the new owners will exclusively supply Blanket with
electricity from the plant, on a take-or-pay basis and in doing so secure Blanket’s future power supply. This has the benefit of
realising a cash profit on the sale of the plant and generate cash for reinvestment in our gold projects. In addition, management can
focus on Caledonia’s core business of gold mining.
On September 28, 2023 the Board approved management to negotiate the sale
of the solar plant with the potential buyer. The assets were available for sale in their condition on September 28, 2023 and therefore
met the criteria to be classified as held for sale.
Management determined the value of the carrying amount as the lower of
the fair value less cost to sell and the carrying amount. The proceeds of the disposal are expected to substantially exceed the carrying
amount of the related net assets and accordingly no impairment losses have been recognised on the classification of the solar plant. The
asset was classified as property, plant and equipment before the reclassification to assets held for sale.
The change in estimate for the liability held for sale is due to the Blanket
Mine’s LoM that was extended to 2041 (that is inclusive of inferred resources and is based on an internal estimate representing
management’s best estimate of the LoM inclusive of the latest drilling results).
Caledonia Mining Corporation Plc
Notes to the Condensed Consolidated Interim Financial Statements
For the period ended March 31, 2024 and 2023
(in thousands of United States Dollars, unless indicated otherwise)
Authorised
Unlimited number of ordinary shares of no par value.
Unlimited number of preference shares of no par value.
Issued ordinary shares
| | |
Number of
fully paid
shares | | |
Amount | |
| | |
| | |
| |
| January 1, 2023 | |
| 12,833,126 | | |
| 83,471 | |
| Shares issued: | |
| | | |
| | |
| - share-based payment - employees (note 10.1(a)) | |
| 24,389 | | |
| 351 | |
| - equity raise* | |
| 1,207,514 | | |
| 15,569 | |
| - Bilboes Gold Limited acquisition | |
| 5,123,044 | | |
| 65,677 | |
| December 31, 2023 | |
| 19,188,073 | | |
| 165,068 | |
| Shares issued: | |
| | | |
| | |
| - share-based payment - employees (note 10.1(a)) | |
| 6,452 | | |
| 79 | |
| March 31, 2024 | |
| 19,194,525 | | |
| 165,147 | |
| * |
Gross proceeds of $10,770 with a transaction
cost of $846 were raised by issuing depository interests on the AIM of the London Stock Exchange
Gross proceeds of $5,850 with a transaction
cost of $205 were raised by issuing depository receipts on the VFEX.
During quarter one of 2023, Mark Learmonth,
Chief Executive Officer, and Toziyana Resources Limited, a company affiliated with Victor Gapare, executive Director of the Company,
subscribed for 3,587 and 11,000 depositary interests respectively in the equity raise. |
Site restoration
Site restoration relates to the estimated cost of closing down the mines
and projects and represent the site and environmental restoration costs, estimated to be paid as a result of mining activities or previous
mining activities. For the Blanket Mine site restoration costs are capitalised in property, plant and equipment with an increase in the
provision at the net present value of the estimated future and inflated cost of site rehabilitation. Subsequently the capitalised cost
is amortised over the life of the mine and the provision is unwound over the period to estimated restoration. For properties in the exploration
and evaluation phase, such as the Bilboes, Maligreen and Motapa projects, site restoration costs are capitalised in exploration and evaluation
assets with an increase in the provision at the undiscounted value of the estimated cost of site rehabilitation. Subsequently the costs
capitalised are not amortised and the provision is not unwound.
Caledonia Mining Corporation Plc
Notes to the Condensed Consolidated Interim Financial Statements
For the period ended March 31, 2024 and 2023
(in thousands of United States Dollars, unless indicated otherwise)
| Reconciliation of site restoration provision | |
March 31,
2024 | | |
December 31,
2023 | |
| | |
| | |
| |
| Blanket Mine | |
| | | |
| | |
| Balance January 1 | |
| 4,766 | | |
| 2,823 | |
| Unwinding of discount (note 13) | |
| 198 | | |
| 109 | |
| Change in estimate (Blanket) (note 14)* | |
| (788 | ) | |
| 1,834 | |
| Balance | |
| 4,176 | | |
| 4,766 | |
| | |
| | | |
| | |
| Motapa, Maligreen and Bilboes | |
| | | |
| | |
| Balance January 1 | |
| 6,219 | | |
| 135 | |
| Change in estimate (Motapa) (note 13) | |
| – | | |
| 1,466 | |
| Change in estimate (Maligreen) (note 13) | |
| – | | |
| 152 | |
| Acquisition - (Bilboes) | |
| – | | |
| 4,466 | |
| Balance | |
| 6,219 | | |
| 6,219 | |
| | |
| | | |
| | |
| Total balance | |
| 10,395 | | |
| 10,985 | |
| | |
| | | |
| | |
| Current | |
| – | | |
| – | |
| Non-current | |
| 10,395 | | |
| 10,985 | |
| | |
| 10,395 | | |
| 10,985 | |
| * |
The change in estimate is due the Blanket Mine’s LoM that was
extended to 2041 (that is inclusive of inferred resources and it based on an internal estimate representing management’s best
estimate of the LoM inclusive of the latest drilling results). |
The discount rate in calculating the present
value of the Blanket Mine provision is 4.45% (2023: 4.14%) and is based on a risk-free rate and cash flows are estimated at an average
2.37% inflation (2023: 2.40%). The gross rehabilitation costs, before discounting, amounted to $5,950 (2023: $5,629) for Blanket Mine
as at March 31, 2024.
The undiscounted gross rehabilitation costs
for exploration and evaluation assets as March 31, 2024, amounted to $4,466 (2023: $4,466) for Bilboes Holdings, $1,466 (2023: $1,466)
for Motapa and $287 (2023: $287) for Maligreen.
| Loan note instruments - finance costs | |
| |
2024 | | |
2023 | |
| | |
| |
| | |
| |
| Solar loan notes | |
22.1 | |
| 174 | | |
| 25 | |
| Motapa loan notes | |
| |
| – | | |
| 475 | |
| | |
| |
| 174 | | |
| 500 | |
Caledonia Mining Corporation Plc
Notes to the Condensed Consolidated Interim Financial Statements
For the period ended March 31, 2024 and 2023
(in thousands of United States Dollars, unless indicated otherwise)
| 22 | Loan note instruments (continued) |
| Loan note instruments - financial liabilities | |
| |
2024 | | |
December 31,
2023 | |
| | |
| |
| | |
| |
| Solar loan notes | |
22.1 | |
| 7,070 | | |
| 7,112 | |
| Motapa loan notes | |
| |
| – | | |
| – | |
| | |
| |
| 7,070 | | |
| 7,112 | |
| | |
| |
| | | |
| | |
| Current | |
| |
| 665 | | |
| 665 | |
| Non-current | |
| |
| 6,405 | | |
| 6,447 | |
| | |
| |
| 7,070 | | |
| 7,112 | |
Following the commissioning of Caledonia’s wholly owned solar plant
on February 2, 2023, the decision was taken to optimise the capital structure of the Group and provide additional debt instruments to
the Zimbabwean financial market by way of issuing loan notes pursuant to a loan note instrument (“bonds”). The bonds were
issued by the Zimbabwean registered entity owning the solar plant, Caledonia Mining Services (Private) Limited. The bonds carry a fixed
interest rate of 9.5% payable bi-annually and have a tenure of 3 years from the date of issue. The bond repayments are guaranteed by the
Company. $7 million of bonds were in issue at the date of approval of these financial statements. All bonds were issued to Zimbabwean
registered commercial entities. Subsequently these bonds were transferred to Caledonia Holdings Zimbabwe (Private) Limited (“CHZ”)
a subsidiary of the Company.
A summary of the bonds is as follows:
| | |
2024 | | |
December 31,
2023 | |
| Opening balance | |
| 7,112 | | |
| – | |
| Amounts received | |
| – | | |
| 7,000 | |
| Transaction costs | |
| – | | |
| (105 | ) |
| Finance cost accrued | |
| 174 | | |
| 549 | |
| Repayment - finance cost paid | |
| (216 | ) | |
| (332 | ) |
| Closing balance | |
| 7,070 | | |
| 7,112 | |
| | |
| | | |
| | |
| Current | |
| 665 | | |
| 665 | |
| Non-current | |
| 6,405 | | |
| 6,447 | |
| | |
| 7,070 | | |
| 7,112 | |
In April 2024, CHZ issued loan notes at the same interest rate, to the
value of $2 million to Zimbabwean registered commercial entities. The bonds were issued to optimise the capital structure of the Group
and provide additional debt instruments to the Zimbabwean financial market. The bonds have an interest rate of 9.5% payable bi-annually
and have a tenor of 3 years from the date of issue. The bond repayments are guaranteed by the Company.
Caledonia Mining Corporation Plc
Notes to the Condensed Consolidated Interim Financial Statements
For the period ended March 31, 2024 and 2023
(in thousands of United States Dollars, unless indicated otherwise)
| 23 | Trade and other payables |
| | |
2024 | | |
December 31, 2023 | |
| | |
| | |
| |
| Trade payables | |
| 5,246 | | |
| 6,166 | |
| Electricity accrual | |
| 2,864 | | |
| 2,676 | |
| Audit fee | |
| 401 | | |
| 395 | |
| Dividends due | |
| 4,481 | | |
| 1,048 | |
| Other payables | |
| 1,271 | | |
| 692 | |
| Financial liabilities | |
| 14,263 | | |
| 10,977 | |
| | |
| | | |
| | |
| Production and management bonus accrual - Blanket Mine | |
| 89 | | |
| 214 | |
| Other employee benefits - other | |
| 1,209 | | |
| 3,817 | |
| Leave pay | |
| 2,968 | | |
| 2,655 | |
| Bonus provision | |
| 70 | | |
| 190 | |
| Accruals | |
| 2,243 | | |
| 2,650 | |
| Non-financial liabilities | |
| 6,579 | | |
| 9,526 | |
| Total | |
| 20,842 | | |
| 20,503 | |
Non-cash items and information presented separately on the statements of cash flows statement:
| | |
2024 | | |
2023 | |
| | |
| | |
| |
| Operating profit | |
| 6,073 | | |
| (1 | ) |
| Adjustments for: | |
| | | |
| | |
| Unrealised foreign exchange gains (note 7) | |
| 574 | | |
| (1,749 | ) |
| Fair value loss on derivative instruments (note 9) | |
| 302 | | |
| 434 | |
| Cash-settled share-based expense (note 10.1) | |
| 53 | | |
| 280 | |
| Cash-settled share-based expense included in production costs (note 10.1) | |
| 99 | | |
| 394 | |
| Cash portion of cash-settled share-based expense | |
| (613 | ) | |
| (1,672 | ) |
| Equity-settled share-based expense (note 10.2) | |
| 201 | | |
| 110 | |
| Depreciation (note 14) | |
| 3,819 | | |
| 2,255 | |
| Cash generated from operations before working capital changes | |
| 10,508 | | |
| 51 | |
| Inventories | |
| (272 | ) | |
| (71 | ) |
| Prepayments | |
| (1,640 | ) | |
| 738 | |
| Trade and other receivables | |
| 1,157 | | |
| (59 | ) |
| Trade and other payables | |
| (3,218 | ) | |
| 5 | |
| Cash generated from operations | |
| 6,535 | | |
| 664 | |
Caledonia Mining Corporation Plc
Notes to the Condensed Consolidated Interim Financial Statements
For the period ended March 31, 2024 and 2023
(in thousands of United States Dollars, unless indicated otherwise)
The Group's operating segments have been identified based on geographic
areas. The strategic business units are managed separately because they require different technology and marketing strategies. For each
of the strategic business units, the Group’s CEO reviews internal management reports on at least a quarterly basis. Blanket Mine,
Bilboes oxide mine, exploration and evaluation assets (“E&E projects”) and South Africa describe the Group's reportable
segments. The Blanket operating segment comprises Caledonia Holdings Zimbabwe (Private) Limited, Blanket Mine (1983) (Private) Limited,
Blanket’s satellite projects and Caledonia Mining Services (Private) Limited (“CMS”). The Bilboes oxide mine segment
comprises the oxide mining activities. The E&E projects segment includes the exploration and evaluation activities of the Bilboes
sulphide project as well as the Motapa and Maligreen projects. The South African segment represents the sales made by Caledonia Mining
South Africa Proprietary Limited to the Blanket Mine. The holding company (Caledonia Mining Corporation Plc) and Greenstone Management
Services Holdings Limited (a UK company) are responsible for corporate administrative functions within the Group and contribute to the
strategic decision making process of the CEO and are therefore included in the disclosure below and combined with corporate and other
reconciling amounts that do not represent a separate segment. Information regarding the results of each reportable segment is included
below. Performance is measured based on profit before income tax, as included in the internal management report that is reviewed by the
Group's CEO. Segment profit or exploration and evaluation cost is used to measure performance as management believes that such information
is the most relevant in evaluating the results of certain segments relative to other entities that operate within these industries. The
accounting policies of the reportable segments are the same as the Group’s accounting policies.
Information about reportable segments
| For the three months ended March 31, 2024 | |
Blanket | | |
South
Africa | | |
Bilboes
oxide
mine | | |
E&E
projects | | |
Inter-group
eliminations
adjustments | | |
Corporate
and other
reconciling
amounts | | |
Total | |
| | |
| | |
| | |
| | |
| | |
| | |
| | |
| |
| Revenue | |
| 37,695 | | |
| – | | |
| 833 | | |
| – | | |
| – | | |
| – | | |
| 38,528 | |
| Inter-segmental revenue | |
| – | | |
| 3,788 | | |
| – | | |
| – | | |
| (3,788 | ) | |
| – | | |
| – | |
| Royalty | |
| (1,892 | ) | |
| – | | |
| (42 | ) | |
| – | | |
| – | | |
| – | | |
| (1,934 | ) |
| Production costs | |
| (18,501 | ) | |
| (3,308 | ) | |
| (784 | ) | |
| – | | |
| 3,633 | | |
| – | | |
| (18,960 | ) |
| Depreciation | |
| (4,007 | ) | |
| (33 | ) | |
| – | | |
| – | | |
| 232 | | |
| (11 | ) | |
| (3,819 | ) |
| Net foreign exchange (loss) gain | |
| (4,243 | ) | |
| (36 | ) | |
| (60 | ) | |
| – | | |
| (5 | ) | |
| 205 | | |
| (4,139 | ) |
| Administrative expenses | |
| (51 | ) | |
| (513 | ) | |
| (1 | ) | |
| (2 | ) | |
| 2 | | |
| (2,046 | ) | |
| (2,611 | ) |
| Net derivative financial instrument expense | |
| – | | |
| – | | |
| – | | |
| – | | |
| – | | |
| (302 | ) | |
| (302 | ) |
| Equity-settled share-based expense | |
| – | | |
| – | | |
| – | | |
| – | | |
| – | | |
| (201 | ) | |
| (201 | ) |
| Cash-settled share-based expense | |
| – | | |
| – | | |
| – | | |
| – | | |
| – | | |
| (53 | ) | |
| (53 | ) |
| Other expenses | |
| (593 | ) | |
| – | | |
| (7 | ) | |
| – | | |
| – | | |
| – | | |
| (600 | ) |
| Other income | |
| 65 | | |
| 1 | | |
| – | | |
| – | | |
| (2 | ) | |
| 100 | | |
| 164 | |
| Management fee | |
| (682 | ) | |
| 682 | | |
| – | | |
| – | | |
| – | | |
| – | | |
| – | |
| Finance income | |
| – | | |
| 159 | | |
| – | | |
| – | | |
| (683 | ) | |
| 530 | | |
| 6 | |
| Finance cost | |
| (893 | ) | |
| (2 | ) | |
| (89 | ) | |
| (21 | ) | |
| 683 | | |
| (410 | ) | |
| (732 | ) |
| Profit (loss) before tax | |
| 6,898 | | |
| 738 | | |
| (150 | ) | |
| (23 | ) | |
| 72 | | |
| (2,188 | ) | |
| 5,347 | |
| Tax expense | |
| (2,306 | ) | |
| (224 | ) | |
| – | | |
| – | | |
| – | | |
| – | | |
| (2,530 | ) |
| Profit (loss) after tax | |
| 4,592 | | |
| 514 | | |
| (150 | ) | |
| (23 | ) | |
| 72 | | |
| (2,188 | ) | |
| 2,817 | |
Caledonia Mining Corporation Plc
Notes to the Condensed Consolidated Interim Financial Statements
For the period ended March 31, 2024 and 2023
(in thousands of United States Dollars, unless indicated otherwise)
| 25 | Operating Segments (continued) |
Information about reportable segments (continued)
| As at March 31, 2024 | |
Blanket | | |
South
Africa | | |
Bilboes
oxide
mine | | |
E&E
projects | | |
Inter-group
eliminations
adjustments | | |
Corporate
and other
reconciling
amounts | | |
Total | |
| Segment assets: | |
| | | |
| | | |
| | | |
| | | |
| | | |
| | | |
| | |
| Non-Current (excluding intercompany) | |
| 188,112 | | |
| 794 | | |
| – | | |
| 93,367 | | |
| (5,212 | ) | |
| (2,754 | ) | |
| 274,307 | |
| Current (excluding intercompany, including Assets held for sale) | |
| 45,574 | | |
| 2,054 | | |
| – | | |
| 666 | | |
| (1,662 | ) | |
| 838 | | |
| 47,470 | |
| Expenditure on evaluation and exploration assets (note 13) | |
| – | | |
| – | | |
| – | | |
| 430 | | |
| – | | |
| – | | |
| 430 | |
| Expenditure on property, plant and equipment (note 14) | |
| 3,641 | | |
| 108 | | |
| – | | |
| – | | |
| (151 | ) | |
| – | | |
| 3,598 | |
| Assets held for sale (note 19) | |
| 13,486 | | |
| – | | |
| – | | |
| – | | |
| – | | |
| – | | |
| 13,486 | |
| Intercompany balances | |
| 47,378 | | |
| 16,893 | | |
| (90 | ) | |
| – | | |
| (149,135 | ) | |
| 84,954 | | |
| – | |
| | |
| | | |
| | | |
| | | |
| | | |
| | | |
| | | |
| | |
| Segment liabilities: | |
| | | |
| | | |
| | | |
| | | |
| | | |
| | | |
| | |
| Non-current (excluding intercompany) | |
| (16,212 | ) | |
| – | | |
| – | | |
| (5,932 | ) | |
| 4 | | |
| (471 | ) | |
| (22,611 | ) |
| Current (excluding intercompany) | |
| (30,207 | ) | |
| (1,857 | ) | |
| – | | |
| (2,030 | ) | |
| – | | |
| (4,056 | ) | |
| (38,150 | ) |
| Intercompany balances | |
| (21,275 | ) | |
| (35,458 | ) | |
| – | | |
| (6,342 | ) | |
| 149,135 | | |
| (86,060 | ) | |
| – | |
| For the three months ended March 31, 2023 | |
Blanket | | |
South
Africa | | |
Bilboes
oxide
mine | | |
E&E
projects | | |
Inter-group
eliminations
adjustments | | |
Corporate
and other
reconciling
amounts | | |
Total | |
| | |
| | |
| | |
| | |
| | |
| | |
| | |
| |
| Revenue | |
| 29,263 | | |
| – | | |
| 172 | | |
| – | | |
| – | | |
| – | | |
| 29,435 | |
| Inter-segmental revenue | |
| – | | |
| 2,109 | | |
| – | | |
| – | | |
| (2,109 | ) | |
| – | | |
| – | |
| Royalty | |
| (1,471 | ) | |
| – | | |
| (9 | ) | |
| – | | |
| – | | |
| – | | |
| (1,480 | ) |
| Production costs | |
| (16,079 | ) | |
| (2,111 | ) | |
| (3,346 | ) | |
| – | | |
| 1,686 | | |
| – | | |
| (19,850 | ) |
| Depreciation | |
| (2,794 | ) | |
| (36 | ) | |
| – | | |
| – | | |
| 585 | | |
| (10 | ) | |
| (2,255 | ) |
| Net foreign exchange gain (loss) | |
| 859 | | |
| (65 | ) | |
| (4 | ) | |
| – | | |
| 354 | | |
| 389 | | |
| 1,533 | |
| Administrative expenses | |
| (39 | ) | |
| (676 | ) | |
| (216 | ) | |
| – | | |
| – | | |
| (5,007 | ) | |
| (5,938 | ) |
| Net derivative financial instrument expense | |
| – | | |
| – | | |
| – | | |
| – | | |
| – | | |
| (434 | ) | |
| (434 | ) |
| Equity-settled share-based expense | |
| – | | |
| – | | |
| – | | |
| – | | |
| – | | |
| (110 | ) | |
| (110 | ) |
| Cash-settled share-based expense | |
| – | | |
| – | | |
| – | | |
| – | | |
| 394 | | |
| (674 | ) | |
| (280 | ) |
| Other expenses | |
| (638 | ) | |
| – | | |
| (2 | ) | |
| – | | |
| – | | |
| – | | |
| (640 | ) |
| Other income | |
| 5 | | |
| 13 | | |
| – | | |
| – | | |
| – | | |
| – | | |
| 18 | |
| Management fee | |
| (560 | ) | |
| 560 | | |
| – | | |
| – | | |
| – | | |
| – | | |
| – | |
| Finance income | |
| – | | |
| 122 | | |
| – | | |
| – | | |
| (983 | ) | |
| 866 | | |
| 5 | |
| Finance cost | |
| (518 | ) | |
| (5 | ) | |
| (1 | ) | |
| – | | |
| 983 | | |
| (1,231 | ) | |
| (772 | ) |
| Profit (loss) before tax | |
| 8,028 | | |
| (89 | ) | |
| (3,406 | ) | |
| – | | |
| 910 | | |
| (6,211 | ) | |
| (768 | ) |
| Tax expense | |
| (2,992 | ) | |
| (73 | ) | |
| – | | |
| – | | |
| (137 | ) | |
| (300 | ) | |
| (3,502 | ) |
| Profit (loss) after tax | |
| 5,036 | | |
| (162 | ) | |
| (3,406 | ) | |
| – | | |
| 773 | | |
| (6,511 | ) | |
| (4,270 | ) |
Caledonia Mining Corporation Plc
Notes to the Condensed Consolidated Interim Financial Statements
For the period ended March 31, 2024 and 2023
(in thousands of United States Dollars, unless indicated otherwise)
| 25 | Operating Segments (continued) |
Information about reportable segments (continued)
| As at March 31, 2023 | |
Blanket | | |
South
Africa | | |
Bilboes
oxide
mine | | |
E&E
projects | | |
Inter-group
eliminations
adjustments | | |
Corporate
and other
reconciling
amounts | | |
Total | |
| Segment assets: | |
| | | |
| | | |
| | | |
| | | |
| | | |
| | | |
| | |
| Non-Current (excluding intercompany) | |
| 181,191 | | |
| 713 | | |
| 872 | | |
| 85,020 | | |
| (6,685 | ) | |
| 7,958 | | |
| 269,069 | |
| Current (excluding intercompany) | |
| 32,620 | | |
| 2,012 | | |
| – | | |
| 3,081 | | |
| (11 | ) | |
| 13,197 | | |
| 50,899 | |
| Expenditure on evaluation and exploration assets (note 13) | |
| – | | |
| – | | |
| – | | |
| 71,550 | | |
| – | | |
| – | | |
| 71,550 | |
| Expenditure on property, plant and equipment (note 14) | |
| 16,346 | | |
| 27 | | |
| – | | |
| – | | |
| (1,824 | ) | |
| (11,438 | ) | |
| 3,111 | |
| Intercompany balances | |
| 43,984 | | |
| 13,135 | | |
| – | | |
| – | | |
| (139,737 | ) | |
| 82,618 | | |
| – | |
| | |
| | | |
| | | |
| | | |
| | | |
| | | |
| | | |
| | |
| Segment liabilities: | |
| | | |
| | | |
| | | |
| | | |
| | | |
| | | |
| | |
| Current (excluding intercompany) | |
| (30,079 | ) | |
| (2,234 | ) | |
| – | | |
| (2,879 | ) | |
| – | | |
| (12,030 | ) | |
| (47,222 | ) |
| Non-current (excluding intercompany) | |
| (11,902 | ) | |
| (69 | ) | |
| – | | |
| (730 | ) | |
| (37 | ) | |
| (458 | ) | |
| (13,196 | ) |
| Intercompany balances | |
| (22,930 | ) | |
| (34,673 | ) | |
| – | | |
| (6,296 | ) | |
| 139,737 | | |
| (75,838 | ) | |
| – | |
Major customer
Revenues received from Fidelity amounted to $7,012 (2023: $29,435) for
the three months ended March 31, 2024.
The Group has made $31,516 (2023: $Nil) of sales to AEG up to March 31,
2024, representing 14,687 ounces (2023: Nil ounces). Management believes this new sales mechanism reduces the risk associated with selling
and receiving payment from a single refining source in Zimbabwe. It may allow for the Company to raise debt funding secured against offshore
gold sales.
The Bullion trade receivables outstanding have been paid in full, after
the year end.
There were no significant subsequent events between March 31,
2024 and the date of issue of these financial statements other than included in the preceding notes to the condensed consolidated interim
financial statements.
The directors have, at the time of approving these consolidated
financial statements, a reasonable expectation that Caledonia has adequate resources to continue in operational existence for the foreseeable
future. Thus, they continue to adopt the going concern basis of accounting in preparing these consolidated financial statements.
Caledonia Mining Corporation Plc
For the period ended March 31, 2024 and 2023
(in thousands of United States Dollars, unless indicated otherwise)
Additional information
DIRECTORS AND OFFICERS at May 13, 2024
| BOARD OF DIRECTORS |
OFFICERS |
| J. L. Kelly (2) (3) (5) (7) |
M. Learmonth (4) (5) (6) (7) |
| Non-executive Director |
Chief Executive Officer |
| Connecticut, United States of America |
Jersey, Channel Islands |
| |
|
| J. Holtzhausen (1) (2) (3) (4) (5) |
C.O. Goodburn (5) (6) |
| Chairman Audit Committee |
Chief Financial Officer |
| Non-executive Director |
Johannesburg, South Africa |
| Cape Town, South Africa |
|
| |
A. Chester (6) (7) |
| M. Learmonth (4) (5) (6) (7) |
General Counsel, Company Secretary and Head of |
| Chief Executive Officer |
Risk and Compliance |
| Jersey, Channel Islands |
Jersey, Channel Islands |
| |
|
| N. Clarke (3) (4) (5) (7) |
J. Mufara (4) (5) (6) |
| Non-executive Director |
Chief Operating Officer |
| East Molesey, United Kingdom |
Johannesburg, South Africa |
| |
|
| G. Wildschutt (1) (3) (5) (7) |
BOARD COMMITTEES |
| Non-executive Director |
(1) Audit Committee |
| Johannesburg, South Africa |
(2) Compensation Committee |
| |
(3) Nomination and Corporate Governance Committee |
|
G. Wylie (1) (2) (3) (4) (5) |
(4) Technical Committee |
| Non-executive Director |
(5) Strategic Planning Committee |
| Malta, Europe |
(6) Disclosure Committee |
| |
(7) ESG Committee |
| V. Gapare (4) (5) (7) |
|
| Executive Director |
|
| Harare, Zimbabwe |
|
| |
|
| T. Gadzikwa (1) (2) (3) (5) |
|
| Non-executive Director |
|
| Johannesburg, South Africa |
|
Caledonia Mining Corporation Plc
For the period ended March 31, 2024 and 2023
(in thousands of United States Dollars, unless indicated otherwise)
Additional information
CORPORATE DIRECTORY as at May 13, 2024
| CORPORATE OFFICES |
|
|
| Jersey |
|
|
| Head and Registered Office |
|
|
| Caledonia Mining Corporation Plc |
|
|
| B006 Millais House |
|
|
| Castle Quay |
|
|
| St Helier |
|
|
| Jersey JE2 3NF |
|
|
| |
|
|
| South Africa |
|
|
| Caledonia Mining South Africa Proprietary Limited |
|
|
| No. 1 Quadrum Office Park |
|
|
| Constantia Boulevard |
|
|
| Floracliffe |
|
|
| South Africa |
|
|
| |
|
|
| Zimbabwe |
|
|
| Caledonia Holdings Zimbabwe (Private) Limited |
|
|
| P.O. Box CY1277 |
|
|
| Causeway, Harare |
|
|
| Zimbabwe |
|
|
| |
|
|
| Capitalisation (May 13, 2024) |
|
|
| Authorised: |
|
Unlimited |
| Shares, Warrants and Options Issued: |
|
|
| Shares: |
|
19,194,860 |
| Options: |
|
20,000 |
| |
|
|
| SHARE TRADING SYMBOLS |
|
|
| NYSE American - Symbol “CMCL” |
|
|
| AIM - Symbol “CMCL” |
|
|
| VFEX - Symbol “CMCL” |
|
|
| |
|
|
| BANKER |
|
|
| Barclays |
|
|
| Level 11 |
|
|
| 1 Churchill Place |
|
|
| Canary Wharf |
|
|
| London E14 5HP |
|
|
| |
|
|
| NOMINATED ADVISOR |
|
|
| Cavendish Securities PLC |
|
|
| One Bartholomew Close |
|
|
| London EC1A 7BL |
|
|
| United Kingdom |
|
|
| Tel: +44 20 7220 0500 |
|
|
| |
|
|
| MEDIA AND INVESTOR RELATIONS |
|
|
| Capital Market Communication Ltd (Camarco) |
|
|
| 40 Strand |
|
|
| London WC2N 5RW |
|
|
| United Kingdom |
|
|
Tel: +44 20 7138 3204
|
|
|
| SOLICITORS |
| Mourant Ozannes (Jersey) |
| 22 Grenville Street |
| St Helier |
| Jersey |
| Channel Islands |
| |
| Borden Ladner Gervais LLP (Canada) |
| Suite 4100, Scotia Plaza |
| 40 King Street West |
| Toronto, Ontario M5H 3Y4 |
| Canada |
| |
| Memery Crystal LLP (United Kingdom) |
| 165 Fleet Street |
| London EC4A 2DY |
| United Kingdom |
| |
| Dorsey & Whitney LLP (US) |
| TD Canada Trust Tower |
| Brookfield Place |
| 161 Bay Street |
| Suite 4310 |
| Toronto, Ontario |
| M5J 2S1 |
| Canada |
| |
| Gill, Godlonton and Gerrans (Zimbabwe) |
| Beverley Court |
| 100 Nelson Mandela Avenue |
| Harare, Zimbabwe |
| |
| Bowman Gilfillan Inc (South Africa) |
| 11 Alice Lane |
| Sandton |
| Johannesburg |
| 2196 |
| |
| AUDITOR |
| BDO South Africa Incorporated |
| Wanderers Office Park |
| 52 Corlett Drive |
| Illovo 2196 |
| South Africa |
| Tel: +27(0)10 590 7200 |
| |
| REGISTRAR AND TRANSFER AGENT |
| Computershare |
| 150 Royall Street, |
| Canton, |
| Massachusetts, 02021 |
| Tel: +1 800 736 3001 or +1 781 575 3100 |
32
Exhibit 99.2
| CALEDONIA MINING CORPORATION PLC | |
May 13, 2024 |
Management’s Discussion and Analysis
This management’s discussion and analysis (“MD&A”)
of the consolidated operating results and financial position of Caledonia Mining Corporation Plc (“Caledonia” or the “Company”)
is for the quarter ended March 31, 2024 (“Q1 2024” or the “Quarter”). It should be read in conjunction with the
Unaudited Consolidated Interim Financial Statements of Caledonia for the Quarter (the “Interim Financial Statements”) which
are available from the System for Electronic Data Analysis and Retrieval at www.sedar.com or from Caledonia’s website at www.caledoniamining.com.
The Interim Financial Statements and related notes have been prepared in accordance with IFRS Accounting Standards, as issued by the International
Accounting Standards Board (“IFRS”). In this MD&A, the terms “Caledonia”, the “Company”, the “Group”,
“we”, “our” and “us” refer to the consolidated operations of Caledonia Mining Corporation Plc and
its subsidiaries unless otherwise specifically noted or the context requires otherwise.
Note that all currency references in this document are in US Dollars
(also “$”, “US$” or “USD”), unless stated otherwise.
Caledonia is a Zimbabwean focussed exploration, development, and mining
corporation. Caledonia owns a 64% stake in the gold-producing Blanket mine (“Blanket”), and 100% stakes in the Bilboes oxide
mine, the Bilboes sulphide project (together with the Bilboes oxide mine “Bilboes”), the Motapa and Maligreen gold mining
claims, all situated in Zimbabwe. Caledonia’s shares are listed on the NYSE American LLC (“NYSE American”), depositary
interests in Caledonia’s shares are admitted to trading on AIM of the London Stock Exchange plc and depositary receipts in Caledonia’s
shares are listed on the Victoria Falls Stock Exchange (“VFEX”) (all under the symbols “CMCL”).
| |
Q1 |
Comment |
| 2024 |
2023 |
| Gold produced (oz) |
17,476 |
16,141 |
Gold produced in the Quarter was 8.3% higher than the first quarter of
2023 (the “comparative” or “comparable quarter” or “Q1 2023”)
17,050 ounces of gold was produced at Blanket in the Quarter, a 6% increase
from the comparable quarter due to higher tonnage and grade and improved gold recovery.
426 ounces of gold were produced from the Bilboes oxide mine in the Quarter
(Q1 2023: 105 ounces). Although the mine was placed on care and maintenance at the end of September 2023,leaching of the heap leach pads
continues for as long as it makes a cash contribution. |
| Blanket On-mine cost per ounce ($/oz)1 |
993 |
991 |
On-mine cost per ounce at Blanket in the Quarter was virtually unchanged
from the comparable quarter.
|
| All-in sustaining cost (“AISC”) per ounce 1 |
1,296 |
1,412 |
The AISC per ounce in the Quarter decreased by 8.2% compared to the comparative quarter, predominantly due to the lower production costs incurred at Bilboes after it was placed on care and maintenance and the non-recurrence of advisory costs for the Bilboes acquisition in 2023. AISC includes the benefit of the solar plant electricity saving ($51 per ounce for the Quarter). |
| Average gold price ($/oz)1 |
2,040 |
1,863 |
The average gold price reflects international spot prices. |
| Gross profit2 ($’000) |
13,815 |
5,850 |
Gross profit for the Quarter increased from the comparable quarter, due
to higher gold revenue and lower production costs.
Increased depreciation costs were incurred as a result of a shortening
of the useful life of certain property, plant and equipment items in 2023. |
| |
Q1 |
Comment |
| 2024 |
2023 |
| Net profit (loss) attributable to shareholders ($’000) |
2,131 |
(5,030) |
Net profit for the Quarter increased due to higher gross profits and lower administrative expenses compared to the comparable quarter, partly offset by foreign exchange losses versus foreign exchange gains in the comparable quarter. |
| Basic IFRS earnings (loss) per share (“EPS”) (cents) |
10.6 |
(30.3) |
Basic IFRS EPS reflects the increase in IFRS profit attributable to shareholders from the EPS loss in the comparable quarter. |
| Adjusted EPS (cents)1 |
26.9 |
(29.1) |
Adjusted EPS excludes, inter alia, net foreign exchange gains and losses, deferred tax and fair value movements on derivative financial instruments. |
| Net cash from operating activities ($’000) |
4,887 |
(876) |
The higher operating profit increased the net cash from operating activities in the Quarter, partly offset by $4.1 million of short-term working capital movements at the end of the Quarter. |
|
Net cash and cash equivalents ($’000):
-
Beginning of the period Jan 1
-
End of the period March 31 |
(11,032)
(14,160)
|
Net cash decreased by $4.1 million
due to short-term working capital movements at the end of the Quarter. Working capital movements are expected to normalise in future
quarters. |
1 Non-IFRS measures such as
“On-mine cost per ounce”, “AISC”, “average gold price” and “adjusted EPS” are used throughout
this document. Refer to section 10 of this MD&A for a discussion of non-IFRS measures.
2 Gross profit is after deducting
royalties, production costs and depreciation but before administrative expenses, other income, interest and finance charges and taxation.
Production at Blanket
Quarterly gold production at Blanket was 17,050 ounces, a 6% increase from
the comparative quarter. The increase was due to higher tonnes milled, an improved grade and improved metallurgical recoveries. Production
in the Quarter was in-line with internal forecasts.
Blanket sold 18,450 ounces in the Quarter. This represented a 18% increase
from comparable quarter, when 15,692 ounces were sold. The ounces sold in Q1 2024 include 3,057 ounces of gold work in progress classified
as inventory at the end of 2023 (Q1 2024: 1,657 ounces)The increased production was derived from 8 fewer production days compared to the
comparable quarter due to the cut-off date for gold deliveries being March 21, 2024, due to the logistical issues relating to the refining
and shipping of gold over the Easter period.
7,956 ounces of gold were produced in April 2024, which was 2,762 ounces
higher than April 2023.
Production and cost guidance for the year ending December 31, 2024 remains
between 74,000 and 78,000 ounces and cost guidance is maintained at an an on-mine cost per ounce of between $870 and $970 and all-in sustaining
cost of between $1,370 and $1,470 per ounce.
Bilboes Feasibility Study
Work to refresh the existing feasibility study for the large-scale sulphide
project at Bilboes is well-advanced. Management is considering alternative development paths for Bilboes, with a view to optimising capital
allocation and maximising the uplift in value for Caledonia shareholders. The preliminary results of the work done to date are expected
to be published during the second quarter of 2024. Thereafter, the work on the selected development route will be upgraded to a feasibility
study which process will take place in parallel with a process to secure debt finance for the project. .
Devaluation of the Zimbabwean dollar (RTGS$) and introduction
of the Zimbabwean gold (“ZiG”) currency
During the Quarter, the RTGS$ devalued from RTGS$ 6,104: US$1
on December 31, 2023 to RTGS$ 22,055: US$1 on March 31, 2024. The significant and accelerating rate of devaluation in the RTGS$ led the
Reserve Bank of Zimbabwe (“RBZ”) to introduce a new currency which is referred to as the “ZiG” on April 5, 2024.
The ZiG is a structured currency which is pegged to a specific
exchange rate or currency basket and backed by a bundle of foreign exchange assets, such as gold reserves. The ZiG replaced the RTGS$
with immediate effect and was introduced at a rate of ZiG13.56:US$1 on April 5, 2024. On the same date, all RTGS$ balances were translated
from RTGS$ to ZiG using an exchange rate of ZiG1: RTGS$ 2,499 which was determined by the RBZ using a combination of the then prevailing
interbank exchange rate of US$1: RTGS$ 30,674 and gold price of US$2,299/oz. The ZiG will co-circulate with other foreign currencies in
the economy. The retention threshold on gold receipts remained unchanged: gold producers will continue to receive 75% of their revenues
in US dollars and the balance in local currency i.e.the ZiG.
The significant devaluation of the RTGS$ in the Quarter resulted
in foreign exchange losses of $4.1 million which was predominantly incurred on the RTGS$-denominated receivables for gold sales and VAT
refunds which reduced in value in US dollar terms between the date on which the receivable was recognised and the date on which the receivable
was settled.
At the same time as the introduction of the ZiG, the Zimbabwe
authorities announced a liberalisation of the foreign exchange market in Zimbabwe. Whereas previously the exchange rate for RTGS$ was
determined by the RBZ, in future the exchange rate will be determined by a process of transparent price discovery in an interbank market.
In the first week after the introduction of the ZiG there were
challenges by banking institutions failing to accomodate ZiG transactions. In recent weeks, prior to approval of this MDA, there was increased
purchasing activities in ZiG by suppliers. The ZiG has remained relatively stable to the USD due to the stability of gold spot prices
on the international market. The ZiG notes were rolled out with effect from April 30, 2024. We have seen no increase in US$ allocations
on the newly established ZiG willing buyer willing seller foreign exchange market.
Proposed solar sale
Due to the unique operating environment in Zimbabwe and Caledonia’s
significant in-country expertise, Caledonia opted to build the solar plant using its own resources rather than relying on an external
party to build and own the solar plant by using its own financial resources and selling the resultant power to Blanket on a long-term
contract. Accordingly, Caledonia constructed the solar plant at a cost of $14.2 million. As the solar plant is now fully commissioned
and is working as planned, Caledonia no longer needs to own the solar plant, provided it retains long term access to the power it produces.
In the second quarter of 2023 management embarked on a process to sell
the solar plant. Various offers were received, and a bidder has been given exclusivity to further negotiate the sale of the plant after
proving their ability to operate and fund solar plants of similar size and complexity. In recent months the terms of the transaction have
been revised to cater for the extension to Blanket's life of mine, based on internal estimates, and increased the terms of the power purchase
agreement which in turn has implications for the overall transaction value. Management is at an advanced stage of finalising the contractual
arrangements to sell the solar plant under which the new owners will exclusively supply Blanket with electricity from the plant, on a
take-or-pay basis. This transaction is expected to realise a profit on Caledonia's investment in the plant, and release cash for reinvestment
in Caledonia’s core business of gold mining that yields higher returns to our shareholders.
Changes to Board and Management
Mr. Dana Roets, stepped down as director and Chief Operations Officer on
February 28, 2024 and Mr. James Mufara was appointed as Chief Operations Officer on May 1, 2024.
Mr. Steve Curtis, did not stand for re-election as Non-executive Director
at the May 7, 2024 annual general meeting. Mr. Curtis remains a consultant to the Company.
Ms. Tariro Gadzikwa joined the board of directors as an independent non-executive
director on March 15, 2024.
Strategy and Outlook: increased focus on growth opportunities
The immediate strategic focus is to:
| · | maintain
production at Blanket at the targeted range of 74,000 - 78,000 ounces for 2024 and at a similar level for 2025; |
| · | communicate
the approach to the Bilboes sulphide project, commence financing process, complete the Caledonia feasibility study on the Bilboes sulphide
project and commence development of the sulphide project; and |
| · | continue
with exploration activities at Motapa. |
The strategy and outlook of Caledonia is further discussed in section 4.12
of this MD&A.
| 3. | SUMMARY FINANCIAL RESULTS |
The table below sets out the consolidated profit or loss for the Quarter
and the comparative period prepared under IFRS.
| Condensed Consolidated Statements of profit or loss and Other comprehensive income (Unaudited) |
| ($’000’s) | |
| | | |
| | |
| | |
| 3 Months ended
March 31 | |
| | |
| 2024 | | |
| 2023 | |
| Revenue | |
| 38,528 | | |
| 29,435 | |
| Royalty | |
| (1,934 | ) | |
| (1,480 | ) |
| Production costs | |
| (18,960 | ) | |
| (19,850 | ) |
| Depreciation | |
| (3,819 | ) | |
| (2,255 | ) |
| Gross profit | |
| 13,815 | | |
| 5,850 | |
| Net foreign exchange (loss) gain | |
| (4,139 | ) | |
| 1,533 | |
| Administrative expenses | |
| (2,611 | ) | |
| (5,938 | ) |
| Net derivative financial instrument expenses | |
| (302 | ) | |
| (434 | ) |
| Equity-settled share-based expense | |
| (201 | ) | |
| (110 | ) |
| Cash-settled share-based expense | |
| (53 | ) | |
| (280 | ) |
| Other expenses | |
| (600 | ) | |
| (640 | ) |
| Other income | |
| 164 | | |
| 18 | |
| Operating profit (loss) | |
| 6,073 | | |
| (1 | ) |
| Net finance costs | |
| (726 | ) | |
| (767 | ) |
| Profit (loss) before tax | |
| 5 347 | | |
| (768 | ) |
| Tax expense | |
| (2,530 | ) | |
| (3,502 | ) |
| Profit (loss) for the period | |
| 2,817 | | |
| (4,270 | ) |
| | |
| | | |
| | |
| Other comprehensive income | |
| | | |
| | |
| Items that are or may be reclassified to profit or loss | |
| | | |
| | |
| Exchange differences on translation of foreign operations | |
| (144 | ) | |
| (369 | ) |
| Total comprehensive income (loss) for the period | |
| 2,673 | | |
| (4,639 | ) |
| | |
| | | |
| | |
| Profit (loss) attributable to: | |
| | | |
| | |
| Owners of the Company | |
| 2,131 | | |
| (5,030 | ) |
| Non-controlling interests | |
| 686 | | |
| 760 | |
| Profit (loss) for the period | |
| 2,817 | | |
| (4,270 | ) |
| | |
| | | |
| | |
| Total comprehensive income (loss) attributable to: | |
| | | |
| | |
| Owners of the Company | |
| 1 987 | | |
| (5,399 | ) |
| Non-controlling interests | |
| 686 | | |
| 760 | |
| Total comprehensive income (loss) for the period | |
| 2,673 | | |
| (4,639 | ) |
| | |
| | | |
| | |
| Earnings (loss) per share (cents) | |
| | | |
| | |
| Basic earnings (loss) per share | |
| 10.6 | | |
| (30.3 | ) |
| Diluted earnings (loss) per share | |
| 10.6 | | |
| (30.2 | ) |
| Adjusted earnings (loss) per share (cents) | |
| | | |
| | |
| Basic | |
| 26.9 | | |
| (29.1 | ) |
| Dividends paid per share (cents) | |
| 14.0 | | |
| 14.0 | |
Revenue in the Quarter was 30.9% higher than the comparative quarter due
to a 19.5% increase in the quantity of gold sold and a 9.3% increase in the average price of gold sold. Sales in the Quarter exclude 1,657
ounces of gold that was held as work-in-progress at March 31, 2024 and which were sold early in April 2024, and include 3,057 ounces of
gold sold that were held as work-in-progress as at December 31, 2023.
The royalty rate payable to the Zimbabwe Government was unchanged at 5%.
Production costs comprise the costs of electricity, labour, administrative
and other costs such as insurance, software licencing and security that are directly related to production.
| Analysis of IFRS production costs between Blanket and Bilboes |
| | |
3 months ended
Mar 31
($’000) | |
| | |
2024 | | |
2023 | |
| Blanket | |
| 18,176 | | |
| 16,481 | |
| Bilboes | |
| 784 | | |
| 3,369 | |
| Total | |
| 18,960 | | |
| 19,850 | |
| | |
| | | |
| | |
| On mine cost per ounce ($/oz) (section 10) | |
| 1,012 | | |
| 1,196 | |
| | |
| | | |
| | |
Total production costs (i.e. at Blanket and Bilboes) decreased by 4.5%
in the Quarter compared to the comparative quarter. The reduction was due to the lower operating costs at Bilboes oxide mine offset by
higher operating costs at Blanket. Bilboes oxide mine was put on care and maintenance with effect from end of September, 2023; however,
leaching of the heap leach pads continues for as long as it makes a positive cash contribution to the care and maintenance cost. At Blanket,
production cost increased by 10.1% in the Quarter compared to the comparative quarter.
Production costs, in conjunction with on-mine and all-in sustaining cost
per ounce of gold sales are discussed in section 4.6; guidance for on-mine costs is included in Section 4.12.
The depreciation charge in the Quarter increased because of an increase
in the depreciable cost base following the commissioning of the Central shaft and the solar plant. The shortening of the useful lives
of certain plant and equipment items, late in 2023, also increased the depreciation charge for the Quarter compared to the comparable
quarter. The useful life of the Jethro Shaft reduced due to increased focus on optimally utilising and centralising hoisting activities
at the new Central Shaft in the future. Depreciation during the Quarter and the comparable quarter was calculated on a life of mine to
2041, based on an internal estimate taking into account inferred resources.
Net foreign exchange movements in the Quater relate to profits and losses
arising on monetary assets and liabilities that are held in currencies other than the USD - principally the volatile RTGS$, but also,
to a much lesser effect, the South African rand and the British pound. The net foreign exchange loss in the Quarter amounted to $4.1 million
and the net losses were predominantly due to the significant devaluation of the RTGS$ exchange rate in 2024. Foreign exchange losses were
predominantly incurred on the RTGS$-denominated bullion receivables for gold sales and VAT refunds which reduced in value in US dollar
terms between the date on which the receivable was recognised and the date on which the receivable was settled. On April 5, 2024 the Zimbabwe
authorities replaced the RTGS$ with a new currency called the “ZiG”, as discussed further in section 4.10.
Administrative expenses are detailed in note 8 to the Interim Financial
Statements and include the costs of Caledonia’s offices and personnel in Harare, Johannesburg, Bulawayo, the UK and Jersey which
provide the following functions: technical services, finance, procurement, investor relations, corporate development, legal and company
secretarial.
| Administrative expenses |
| | |
3 months ended
Mar 31 | |
| | |
($ ’000’s) | |
| | |
| 2024 | | |
| 2023 | |
| Investor relations | |
| 135 | | |
| 163 | |
| Advisory services | |
| - | | |
| 90 | |
| Listing fees | |
| 149 | | |
| 239 | |
| Directors (Caledonia and Blanket) | |
| 189 | | |
| 187 | |
| Wages and salaries | |
| 1,205 | | |
| 1 380 | |
| Professional consulting fees | |
| 235 | | |
| 2,947 | |
| Other | |
| 698 | | |
| 932 | |
| Total | |
| 2,611 | | |
| 5,938 | |
Administrative expenses in the Quarter were 56.0% lower than the comparative
quarter predominantly due to lower professional consulting fees which were high in the comparative quarter due to the fees payable on
the conclusion of the acquisition of Bilboes Gold Limited in January 2023. Excluding the effect of the advisory fees in the comparable
quarter, administrative expenses were aproximately 18% lower in the Quarter due to lower management bonuses.
Other expenses are detailed in note 11 to the Interim Financial Statements.
During the Quarter, community and social responsibility cost amounted to $346,000 and is further explained in section 4.2. Other expenses
include Intermediate Monetary Transaction Tax of $254,000 for the Quarter that is chargeable on the transfer of physical money, electronically
or by any other means and ranges from 1% to 2% per transaction performed in Zimbabwe.
The tax expense comprised:
| Analysis of consolidated tax expense for the Quarter |
| ($’000’s) | |
Blanket | | |
South
Africa | | |
UK | | |
Bilboes
and CHZ | | |
Total | |
| Income tax | |
| 2,284 | | |
| 221 | | |
| - | | |
| - | | |
| 2,505 | |
| Withholding tax | |
| | | |
| | | |
| | | |
| | | |
| | |
| Management fee | |
| - | | |
| 33 | | |
| - | | |
| - | | |
| 33 | |
| Deemed dividend | |
| 71 | | |
| - | | |
| - | | |
| - | | |
| 71 | |
| CHZ dividends to GMS-UK | |
| - | | |
| - | | |
| - | | |
| - | | |
| - | |
| Deferred tax | |
| (49 | ) | |
| (30 | ) | |
| - | | |
| - | | |
| (79 | ) |
| | |
| 2,306 | | |
| 224 | | |
| - | | |
| - | | |
| 2,530 | |
The overall effective taxation rate for the Quarter was 47.3%
(2023: -456%). The effective tax rate bears little relationship to reported consolidated profit before tax. The effective tax rate is
lower due to the following reasons:
| · | The rate of income tax in Jersey, the tax domicile of the parent company of the Group (i.e. the Company),
is zero, which means there is no benefit to be realised by offsetting administrative expenses, derivatives, and share-based payment awards
incurred. |
| · | Zimbabwean taxable income is calculated in both
RTGS$ and USD, whereas the group reports in USD. Large devaluations in the RTGS$ against the USD result in substantial foreign
exchange movements on the RTGS$ tax payable which have a significant effect on the income tax calculation. |
The effective taxation rate for Blanket was 30% (2023: 33%). Deferred tax
predominantly comprises the difference between the accounting and tax treatments of capital investment expenditure. Deferred tax liabilities,
denominated in RTGS$ (ZiG post April 5, 2024), devalued significantly during the Quarter with limited value remaining. Most of the tax
expense comprised income tax and deferred tax incurred in Zimbabwe.
South African income tax that arises on intercompany profits
arising at Caledonia Mining South Africa Proprietary Limited (“CMSA”) amounted to $213,000 during the Quarter.
Zimbabwe withholding tax arose on the dividends paid from Caledonia
Holdings Zimbabwe (Private) Limited (“CHZ”) to the Company’s subsidiary in the UK Greenstone Management Services Holdings
Limited (“GMS-UK”).
Basic IFRS EPS for the Quarter improved from a loss of 30.3
cents in the comparative quarter to a profit of 10.6 cents in the Quarter. Adjusted EPS for the Quarter excludes inter alia the
effect of foreign net exchange movements and deferred tax. Adjusted EPS improved to 26.9 cents from a loss of 29.1 cents in the comparative
quarter. A reconciliation from Basic IFRS EPS to adjusted EPS is set out in section 10.3.
A quarterly dividend of 14 cents per share was paid on January
26, 2024 and again on April 26, 2024. Caledonia’s dividends are discussed further in section 14.
Risks that may affect Caledonia’s future financial condition
are discussed in section 17.
The table below sets out the consolidated statements of cash
flows for the Quarter and the comparative quarter prepared under IFRS.
| Condensed Consolidated Statements of Cash Flows | |
| |
| ($’000’s) | |
| | |
| |
| | |
3 months ended Mar 31 | |
| | |
2024 | | |
2023 | |
| | |
| | |
| |
| Cash inflow from operations | |
| 6,535 | | |
| 664 | |
| Interest received | |
| 6 | | |
| 5 | |
| Finance costs paid | |
| (573 | ) | |
| (200 | ) |
| Tax paid | |
| (1,081 | ) | |
| (1,345 | ) |
| Net cash inflow (outflow) from operating activities | |
| 4,887 | | |
| (876 | ) |
| | |
| | | |
| | |
| Cash flows used in investing activities | |
| | | |
| | |
| Acquisition of property, plant and equipment | |
| (3,741 | ) | |
| (4,593 | ) |
| Acquisition of exploration and evaluation assets | |
| (430 | ) | |
| (144 | ) |
| Acquisition of put options | |
| (240 | ) | |
| - | |
| Net cash used in investing activities | |
| (4,411 | ) | |
| (4,737 | ) |
| | |
| | | |
| | |
| Cash flows from financing activities | |
| | | |
| | |
| Dividends paid | |
| (2,720 | ) | |
| (2,424 | ) |
| Payment of lease liabilities | |
| (37 | ) | |
| (37 | ) |
| Shares issued – equity raise (net of transaction cost) | |
| - | | |
| 10,823 | |
| Loan note instrument – Motapa payment | |
| - | | |
| (5,399 | ) |
| Loan note instrument – solar bond issue receipts (net of transaction cost) | |
| - | | |
| 4,500 | |
| Net cash (used in) from financing activities | |
| (2,757 | ) | |
| 7,463 | |
| | |
| | | |
| | |
| Net (decrease) increase in cash and cash equivalents | |
| (2,281 | ) | |
| 1,850 | |
| Effect of exchange rate fluctuations on cash and cash equivalents | |
| (847 | ) | |
| (157 | ) |
| Net cash and cash equivalents at beginning of the period | |
| (11,032 | ) | |
| 1,496 | |
| Net cash and cash equivalents at end of the period | |
| (14,160 | ) | |
| 3,189 | |
Cash flows from operating activities in the Quarter is detailed in note
24 to the Interim Financial Statements. Cash inflows from operations before working capital changes in the Quarter were $10.5 million,
compared to $0.5 million in the previous quarter.
The table below illustrates the operating cash flow for the Quarter and
the last 8 preceding quarters:
| Cash generated from operations before working capital changes |
| ($'000's) |
Q1 2022 |
Q2 2022 |
Q3 2022 |
Q4 2022 |
Q1 2023 |
Q2 2023 |
Q3 2023 |
Q4 2023 |
Q1 2024 |
| Operating cash flow |
13,470 |
13,499 |
13,731 |
7,099 |
51 |
4,865 |
16,303 |
297 |
10,508 |
Cash generated from operations before working capital changes in the Quarter
improved significantly from the comparable quarter due to increased gold sales, the higher average gold price and lower costs at the Bilboes
oxide mine after it had been placed on care and maintenance in October 2023. Cash generated from operations before working capital at
Blanket in April was $7.1 million, which reflects the high production level achieved in the month and the improved gold price. Finance
costs paid in the Quarter remained stable. Solar loan note interest, rehabilitation liability unwinding interest and overdraft interest
increased from the comparable quarter.
The acquisition of property, plant and equipment relates to the investment
at Blanket as discussed further in section 4.7; the investment in exploration and evaluation assets relates to the exploration work at
Motapa and Maligreen.
Dividends for the Quarter comprise $2.7 million paid to shareholders of
the Company and $0.03 to Blanket’s minority shareholders as discussed in section 14. A quarterly dividend of 14 cents per share
was declared on January 2, 2024 and paid on January 26, 2024; a further dividend was declared on March 27, 2024 which was paid on April
26, 2024. Cash inflows from operations were reduced by working capital outflows of $4 million in the Quarter due to decreased trade payables,
excluding dividends due which are presented separately as part of dividends paid in the condensed consolidated statements of cash flows,
and increased RTGS$ prepayments to local suppliers to lock in the prices of inventory and reduce the effect of the devaluation of the
RTGS$.The effect of exchange rate fluctuations on cash held reflects gains or losses on cash balances
held in currencies other than the US Dollar. The effect on cash balances forms part of an overall foreign exchange gain or loss arising
on all affected financial assets and liabilities.
The table below sets out the consolidated statements of Caledonia’s
financial position at the end of the Quarter and December 31, 2023 prepared under IFRS.
| Summarised Consolidated Statements of Financial Position |
| ($’000’s) | |
As at | |
| Mar 31 2024 | | |
| Dec 31 2023 | |
| | |
| |
| | | |
| | |
| Total non-current assets | |
| |
| 274,307 | | |
| 274,074 | |
| Income tax receivable | |
| |
| 80 | | |
| 1,120 | |
| Inventories | |
| |
| 20,542 | | |
| 20,304 | |
| Derivative financial assets | |
| |
| 26 | | |
| 88 | |
| Trade and other receivables | |
| |
| 7,558 | | |
| 9,952 | |
| Prepayments | |
| |
| 3,947 | | |
| 2,538 | |
| Cash and cash equivalents | |
| |
| 1,831 | | |
| 6,708 | |
| Assets held for sale | |
| |
| 13,486 | | |
| 13,519 | |
| Total assets | |
| |
| 321,777 | | |
| 328,303 | |
| Total non-current liabilities | |
| |
| 22,611 | | |
| 23,978 | |
| Cash-settled share-based payments – short term portion | |
| |
| 313 | | |
| 920 | |
| Income tax payable | |
| |
| 102 | | |
| 10 | |
| Lease liabilities – short term portion | |
| |
| 141 | | |
| 167 | |
| Loan note instruments – short term portion | |
| |
| 665 | | |
| 665 | |
| Trade and other payables | |
| |
| 20,842 | | |
| 20,503 | |
| Overdraft and term loans | |
| |
| 15,991 | | |
| 17,740 | |
| Liabilities associated with assets held for sale | |
| |
| 96 | | |
| 128 | |
| Total liabilities | |
| |
| 60,761 | | |
| 64,111 | |
| Total equity | |
| |
| 261,016 | | |
| 264,192 | |
| Total equity and liabilities | |
| |
| 321,777 | | |
| 328,303 | |
Property, plant and equipment additions at Blanket amounted to $4.4 million
(rehabilitation change in estimate excluded and inclusive of intercompany mark-up) in the Quarter. The additions predominantly related
to capital development and the construction of the new tailings storage facility at Blanket (“TSF”).
Inventories include 1,657 ounces of gold which were held by Fidelity Gold
Refinery (Private) Limited (“FGR”) in transit to Al Etihad Gold Refinery DMCC (“AEG”) which was sold in early
April 2024 (December 31, 2023: 3,057 ounces).
Prepayments represent deposits and advance payments for goods and services.
Prepayments increased by $1.7 million due to larger prepayments made to RTGS$ suppliers and thereby lock-in the cost of goods and services
to hedge against the weakening of the RTGS$ against the USD.
Trade and other receivables are detailed in note 16 to the Interim Financial
Statements and include $3.9 million (December 31, 2023: $5.4 million) due from FGR and AEG in respect of the RTGS$ and USD components
respectively of the revenues arising on gold deliveries prior to the close of business on March 31, 2024. All outstanding amounts due
from FGR and AEG were received in full after the end of the Quarter.
$2.4 million of the total trade and other receivables (December 31, 2023:
$3.8 million) was due from the Zimbabwe Government in respect of VAT refunds. 0.8 million in respect of VAT refunds comprises RTGS$-denominated
VAT refunds. Increased delays in the processing of VAT refunds by the Government of Zimbabwe has resulted in a decrease in the amount
receivable in USD terms; due to the accelerating devaluation of the RTGS$ towards the end of the Quarter this contributed to the high
level of foreign exchange losses that were incurred in the Quarter. The long-outstanding balances have either been repaid after the end
of the Quarter or have been recovered by way of allocating the refunds against income tax payables due to the Government of Zimbabwe.
.
Overdrafts are used for short-term working capital funding requirements
in Zimbabwe. Expiration dates and terms of the overdrafts and short-term loans are set out in section 7.
Approximately a third of cash-settled share-based payments outstanding
at December 31, 2023 related to employee incentive awards that were settled in the Quarter. In April 2024 the Company made awards of 167,935
target Performance Units (“PUs”), which could be settled in cash, and 125,433 equity-settled target PUs (“EPUs”)
to certain management and employees within the Group pursuant to the provisions of the 2015 Omnibus Equity
Incentive Compensation Plan (“OEICP”). The final number of units that will vest is subject to the achievement of certain targets
which include production, the control of operating costs and capital expenditure, resource development and progress towards the commercialisation
of the Bilboes sulphide project. The short-term portion of the cash-settled share-based payment liability is in respect of awards
made to certain employees at Caledonia, CMSA, CHZ, Blanket and Bilboes in terms of the OEICP. The awards (other than EPUs that only settle
in shares) can be settled in cash or, subject to conditions, shares at the option of the recipient.
The table below illustrates the distribution of the consolidated cash across
the jurisdictions where the Group holds its cash:
| Geographical location of net cash ($’000’s) |
| | |
Jun 30, | | |
Sep 30, | | |
Dec 31, | | |
Mar 31, | |
| As at | |
2023 | | |
2023 | | |
2023 | | |
2024 | |
| Zimbabwe | |
| (7,373 | ) | |
| (8,052 | ) | |
| (13,751 | ) | |
| (15,708 | ) |
| South Africa | |
| 834 | | |
| 1,208 | | |
| 1,051 | | |
| 919 | |
| UK/Jersey | |
| 3,632 | | |
| 3,652 | | |
| 1,668 | | |
| 629 | |
| Total net cash and cash equivalents | |
| (2,907 | ) | |
| (3,192 | ) | |
| (11,032 | ) | |
| (14,160 | ) |
Assets held for resale comprises the book value of the solar
plant which is the subject of an ongoing sale process as discussed in section 4.11.
The following information is provided for each of the eight most
recent quarterly periods ending on the dates specified. The amounts are extracted from underlying financial statements that have been
prepared using accounting policies consistent with IFRS.
| ($’000’s except | |
Jun 30, | | |
Sep 30, | | |
Dec 31, | | |
Mar 31, | | |
Jun 30, | | |
Sep 30, | | |
Dec 31, | | |
Mar 31, | |
| per share amounts) | |
2022 | | |
2022 | | |
2022 | | |
2023 | | |
2023 | | |
2023 | | |
2023 | | |
2024 | |
| Revenue | |
| 36,992 | | |
| 35,840 | | |
| 34,178 | | |
| 29,435 | | |
| 37,031 | | |
| 41,187 | | |
| 38,661 | | |
| 38,528 | |
| Profit/(loss) attributable to owners of the Company | |
| 11,378 | | |
| 8,614 | | |
| (8,029 | ) | |
| (5,030 | ) | |
| (513 | ) | |
| 4,506 | | |
| (3,162 | ) | |
| 2,131 | |
| EPS – basic (cents) | |
| 87.7 | | |
| 63.3 | | |
| (62.2 | ) | |
| (30.3 | ) | |
| (0.6 | ) | |
| 24.1 | | |
| (17.6 | ) | |
| 10.6 | |
| EPS – diluted (cents) | |
| 87.7 | | |
| 63.3 | | |
| (62.2 | ) | |
| (30.2 | ) | |
| (0.6 | ) | |
| 24.0 | | |
| (17.6 | ) | |
| 10.6 | |
| Net cash and cash equivalents | |
| 10,862 | | |
| 6,167 | | |
| 1,496 | | |
| 3,189 | | |
| (2,907 | ) | |
| (3,192 | ) | |
| (11,032 | ) | |
| (14,160 | ) |
| 4.1 | Safety, Health and Environment |
The following safety statistics have been recorded for the Quarter and
the preceding seven quarters.
| Blanket Safety Statistics | |
| | |
| | |
| | |
| | |
| | |
| | |
| | |
| |
Classification | |
Q2
2022 | | |
Q3
2022 | | |
Q4
2022 | | |
Q1
2023 | | |
Q2
2023 | | |
Q3
2023 | | |
Q4
2023 | | |
Q1
2024 | |
| Fatal | |
| 0 | | |
| 0 | | |
| 0 | | |
| 1 | | |
| 0 | | |
| 0 | | |
| 0 | | |
| 0 | |
| Lost time injury | |
| 2 | | |
| 1 | | |
| 1 | | |
| 0 | | |
| 5 | | |
| 2 | | |
| 2 | | |
| 1 | |
| Restricted work activity | |
| 1 | | |
| 1 | | |
| 2 | | |
| 6 | | |
| 7 | | |
| 5 | | |
| 0 | | |
| 5 | |
| First aid | |
| 3 | | |
| 0 | | |
| 0 | | |
| 1 | | |
| 0 | | |
| 0 | | |
| 0 | | |
| 1 | |
| Medical aid | |
| 3 | | |
| 1 | | |
| 2 | | |
| 4 | | |
| 0 | | |
| 1 | | |
| 2 | | |
| 1 | |
| Occupational illness | |
| 0 | | |
| 0 | | |
| 0 | | |
| 0 | | |
| 0 | | |
| 0 | | |
| 0 | | |
| 0 | |
| Total | |
| 9 | | |
| 3 | | |
| 5 | | |
| 12 | | |
| 12 | | |
| 8 | | |
| 4 | | |
| 8 | |
| Incidents | |
| 10 | | |
| 14 | | |
| 6 | | |
| 14 | | |
| 3 | | |
| 10 | | |
| 10 | | |
| 11 | |
| Near misses | |
| 7 | | |
| 6 | | |
| 1 | | |
| 4 | | |
| 4 | | |
| 4 | | |
| 7 | | |
| 5 | |
| Disability Injury Frequency Rate | |
| 0.36 | | |
| 0.22 | | |
| 0.33 | | |
| 0.80 | | |
| 1.35 | | |
| 0.71 | | |
| 0.20 | | |
| 0.66 | |
| Total Injury Frequency Rate | |
| 1.08 | | |
| 0.34 | | |
| 0.56 | | |
| 1.36 | | |
| 1.35 | | |
| 0.81 | | |
| 0.40 | | |
| 0.88 | |
| Man-hours worked (000’s) | |
| 1,672 | | |
| 1,788 | | |
| 1,801 | | |
| 1,760 | | |
| 1,780 | | |
| 1,982 | | |
| 2,009 | | |
| 1,817 | |
Blanket’s safety performance compares favourably with other deep
level underground gold mines; however, management believes the safety performance at Blanket should be seen as a continuous focus area.
The Nyanzvi 2 initiative is designed to increase safety awareness and reinforce strict adherence to prescribed safety procedures.
Nyanzvi Initiative
During the Quarter, Nyanzvi 2 training continued
for the mining and engineering departments. Training classes were run concurrently, and 250 employees were trained. Team rankings
for the best performers for all departments continued in the Quarter.
The following safety statistics have been recorded for the Quarter and
the preceding quarters since acquisition.
| Bilboes Oxide Mine Safety Statistics | |
| | |
| | |
| | |
| |
Classification | |
Q1
2023 | | |
Q2
2023 | | |
Q3
2023 | | |
Q4
2023 | | |
Q1
2024 | |
| Minor injury | |
| 0 | | |
| 2 | | |
| 0 | | |
| 0 | | |
| 2 | |
| Lost time injury | |
| 0 | | |
| 0 | | |
| 0 | | |
| 0 | | |
| 0 | |
| Occupational Health | |
| 0 | | |
| 0 | | |
| 0 | | |
| 0 | | |
| 0 | |
| Total | |
| 0 | | |
| 2 | | |
| 0 | | |
| 0 | | |
| 2 | |
| Incidents | |
| 9 | | |
| 15 | | |
| 2 | | |
| 4 | | |
| 1 | |
| Near misses | |
| 2 | | |
| 5 | | |
| 2 | | |
| 0 | | |
| 0 | |
| Lost Time Injury Frequency Rate | |
| 0 | | |
| 0 | | |
| 0 | | |
| 0 | | |
| 0 | |
| 4.2 | Social Investment and Contribution to the Zimbabwean Economy – Blanket |
Blanket’s investment in community and social projects (“CSR”)
which are not directly related to the operation of the mine or the welfare of Blanket’s employees, the payments made to the Gwanda
Community Share Ownership Trust (“GCSOT”) in terms of Blanket’s indigenisation, and payments of taxation and other non-taxation
charges to the Zimbabwe Government and its agencies are set out in the table below.
| Payments to the Community and the Zimbabwe Government |
| ($’000’s) |
| Period |
Year |
CSR
Investment |
Payments
to GCSOT |
Payments to
Zimbabwe
Government (excl.
royalties) |
Royalties |
Total |
| Year |
2013 |
2,147 |
2,000 |
15,354 |
4,412 |
23,913 |
| Year |
2014 |
35 |
- |
12,319 |
3,522 |
15,876 |
| Year |
2015 |
50 |
- |
7,376 |
2,455 |
9,881 |
| Year |
2016 |
12 |
- |
10,637 |
2,923 |
13,572 |
| Year |
2017 |
5 |
- |
11,988 |
3,498 |
15,491 |
| Year |
2018 |
4 |
- |
10,140 |
3,426 |
13,570 |
| Year |
2019 |
47 |
- |
10,357 |
3,854 |
14,258 |
| Year |
2020 |
1,689 |
184 |
12,526 |
5,007 |
19,406 |
| Year |
2021 |
1,163 |
948 |
16,426 |
6,083 |
24,620 |
| Year |
2022 |
888 |
1,200 |
12,060 |
7,124 |
21,272 |
| Year |
2023 |
1,491 |
550 |
11,871 |
7,316 |
21,228 |
| Q1 |
2024 |
344 |
- |
2,609 |
1,893 |
4,846 |
CSR initiatives fall under seven pillars of education, health, women's
empowerment and agriculture, environment, charity, youth empowerment and conservation.
The main CSR programme at Blanket relates to the refurbishment of the maternity
clinic, the primary and secondary schools, and the youth centre at Sitezi, which is located approximately 17km from Blanket. Activities
in respect of this project during the Quarter include:
| · | Fitting of ceilings in four classrooms, procurement of science lab equipment and construction of flush
toilets ablutions facilities at Sitezi Secondary School. A fence was also erected around the secondary school in the Quarter. |
| · | Construction of the waiting mothers’ shelter which began in the last
quarter of 2024 is 80% complete, with the fitting of doors, windows and wiring still outstanding. |
| · | The bulk of materials, such as batteries and other accessories, for the solar plant to supply the clinic,
secondary school and primary school with power, was procured in the last quarter and installation is in progress with 50% of the solar
panel stands holes having been drilled in the Quarter. The solar power will help maintain cold chains for medical supplies and samples
at the clinic and provide lighting and energy supply to the clinic and the two schools for powering IT equipment such as computers and
interactive boards. |
| · | To ensure a secure and stable supply of water for the Guqukani Garden irrigation scheme, the four boreholes
drilled in 2023 were connected to the national electricity grid in the Quarter. This will reduce the garden’s dependence on the
mine water from Smiler shaft. |
| · | Work on upgrading the Sabiwa Stadium to meet the requirements of the Zimbabwe Football Association for
Division 1/Premier Soccer League stadia in the country continued with the planting of the pitch lawn. The caretaker’s cottage is
under construction at foundation level. Male and female toilet blocks have been pegged, and the foundation excavation has started. The
stadium, which had been used exclusively by Sabiwa High School, will cater for footballing activities for the entire local community. |
Blanket undertook road repairs of a section of the old Gwanda Road which
had been undercut by artisanal miners posing danger of road collapse.
Under the women's and youth empowerment pillar, 42 members of the community
(41 females and 1 male) were trained on sewing re-usable sanitary pads. Approximately 2,000 girls will benefit from this initiative.
A dividend of $225,000 was paid to GCSOT in April, 2024. GCSOT has a 10%
shareholding in Blanket.
| 4.3 | Gold Production – Blanket |
| Blanket - Production Statistics |
| |
Year |
Tonnes Milled
(t) |
Gold Head
(Feed) Grade
(g/t Au) |
Gold Recovery
(%) |
Gold Produced
(oz) |
| Year |
2021 |
665,628 |
3.36 |
93.9 |
67,476 |
| Q1 |
2022 |
165,976 |
3.69 |
94.1 |
18,515 |
| Q2 |
2022 |
179,118 |
3.71 |
93.9 |
20,091 |
| Q3 |
2022 |
198,495 |
3.53 |
93.6 |
21,120 |
| Q4 |
2022 |
208,444 |
3.37 |
93.7 |
21,049 |
| Year |
2022 |
752,033 |
3.56 |
93.8 |
80,775 |
| Q1 |
2023 |
170,721 |
3.11 |
93.8 |
16,036 |
| Q2 |
2023 |
179,087 |
3.22 |
94.0 |
17,436 |
| Q3 |
2023 |
208,902 |
3.46 |
93.7 |
21,772 |
| Q4 |
2023 |
211,730 |
3.17 |
93.6 |
20,172 |
| Year |
2023 |
770,440 |
3.25 |
93.8 |
75,416 |
| Q1 |
2024 |
175,101 |
3.23 |
93.9 |
17,050 |
| April |
2024 |
77,603 |
3.40 |
94.0 |
7,956 |
Gold production for the Quarter was 6.3% higher
than the comparative quarter due to the higher tonnages, grade and recovery. The Quarter comprised only 79 production days due to public
holidays and a relatively early production cut-off being the on-mine smelt which took place on 21 March 21, 2024 due to logistical issues
relating to the transport and storage of gold over the Easter period. Thus, the average daily rate of production in the Quarter was 216
ounces, compared to 186 ounces per day in the comparable quarter. Tonnes milled and grade are discussed in section 4.4 of
this MD&A; gold recoveries are discussed in section 4.5 of this MD&A.
Production in April 2024 amounted to 7,956 ounces. Management is confident
that Blanket will achieve its production guidance for 2024 of between 74,000 and 78,000 ounces of gold.
A total of 175,101 tonnes were milled in the
Quarter, which is 2.6% higher than the comparative quarter; the recovered grade for the Quarter was 3.9% higher than the grade in the
comparative quarter. The increased production tonnes in the Quarter was due to several factors which include:
| · | Improved blasting to reduce blockages in ore passes and grizzlies and reduce the requirement for secondary
blasting; |
| · | optimising the usage of the Central Shaft and increasing its hoisting capacity by increasing the skip
loading factor from 8.5 tonnes to 9.7 tonnes; and |
| · | improved handling of ore at the Central Shaft loading area. |
Recoveries in the Quarter were 93.9% compared to 93.8% in the comparative
quarter.
A narrow focus on the direct costs of production (mainly labour, electricity
and consumables) does not fully reflect the total cost of gold production. Accordingly, cost per ounce data for the Quarter and the comparative
quarter have been prepared in accordance with the Guidance Note issued by the World Gold Council on June 23, 2013 and is set out in the
table below on the following bases:
| i. | On-mine cost per ounce3, which shows the on-mine costs of producing an ounce of gold
and includes direct labour, electricity, consumables and other costs that are incurred at the mine including insurance, security and on-mine
administration; |
| ii. | All-in sustaining cost per ounce3, which shows the on-mine cost per ounce plus
royalty paid, additional costs incurred outside the mine (i.e., at offices in Harare, Bulawayo, Johannesburg and Jersey), costs associated
with maintaining the operating infrastructure and resource base that are required to maintain production at the current levels (sustaining
capital investment), the share-based expense (or credit) arising from the awards made to employees under the OEICP less silver by-product
revenue; and |
| iii. | All-in cost per ounce3, which shows the all-in sustaining cost per ounce plus
the costs associated with activities that are undertaken with a view to increasing production (expansion capital investment). |
| Cost per ounce of gold sold |
| (US$/ounce) |
| | |
Bilboes oxide mine | | |
Blanket | | |
Consolidated | |
| | |
3 months ended Mar 31 | | |
3 months ended Mar 31 | | |
3 months ended Mar 31 | |
| | |
2024 | | |
2023 | | |
2024 | | |
2023 | | |
2024 | | |
2023 | |
| On-mine cost per ounce3 | |
| 1,820 | | |
| 31,857 | | |
| 993 | | |
| 991 | | |
| 1,012 | | |
| 1,196 | |
| All-in sustaining cost per ounce3 | |
| 2,549 | | |
| 31,940 | | |
| 1,267 | | |
| 1,208 | | |
| 1,296 | | |
| 1,412 | |
| All-in cost per ounce3 | |
| 2,549 | | |
| 59,923 | | |
| 1,364 | | |
| 1,475 | | |
| 1,390 | | |
| 1,863 | |
3On-mine cost per ounce, all-in
sustaining cost per ounce and all-in cost per ounce are non-IFRS measures. Refer to section 10 for a reconciliation of these amounts
to IFRS.
A reconciliation of costs per ounce to IFRS production costs is set out
in section 10.
On-mine cost
On-mine cost comprises labour, electricity, consumables, and other costs
such as security and insurance which are directly related to production. Production costs are detailed in note 6 to the Interim Financial
Statements. On-mine cost includes the procurement margin paid to CMSA and represent a fair value that Blanket would pay for consumables
if they were sourced from a third party.
The consolidated on-mine cost per ounce for the Quarter was 15.4% lower
than the comparative quarter due to the substantial reduction in the on-mine cost per ounce at the Bilboes oxide mine. The decrease in
consolidated on-mine cost per ounce compared to the comparative quarter is illustrated in the graph below.
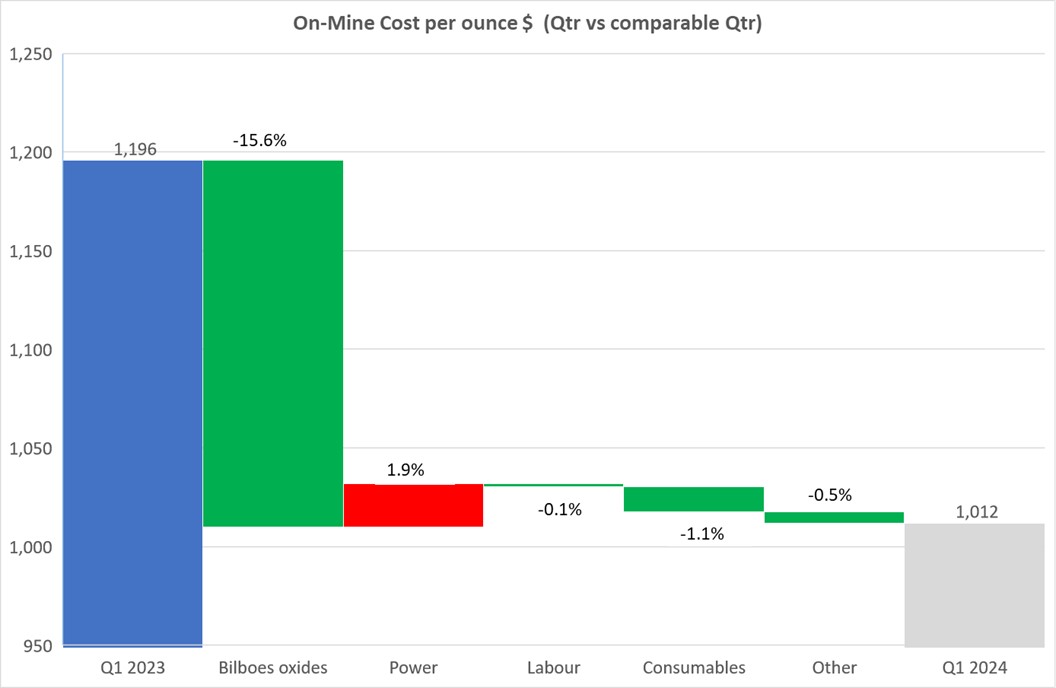
The cost of oxide mining at Bilboes contributed a reduction of $186 per
ounce compared to the comparable quarter after it was placed on care and maintenance with effect from 1 October 1, 2023. Leaching activities
related to the heap leach pad have continued and will continue for as long as it contributes to the care and maintenance cost of the Bilboes
oxide mine. Bilboes is discussed further in section 4.9.
Blanket's on-mine cost per ounce increased by 0.2% from $991 per ounce
in the comparative quarter to $993 per ounce in the Quarter.
Increased electricity usage at Blanket was due to the use of infrastructure
such as the No. 4, 6 Winze, Lima and Jethro shafts in addition to the Central shaft. The electricity usage is expected to reduce over
the next 2 -3 years as ore extraction transitions from the old mine infrastructure, above 750 meters underground, to areas below 750 meters
which are accessed via Central shaft. Other initiatives such as the installation of power factor correction equipment at Blanket is expected
to reduce the maximum demand charges which have contributed to the higher electricity cost and alleviate low voltage occurrences which
require the use of expensive diesel power to provide back-up. The phasing out of old equipment with a higher power consumption compared
to new equipment is also expected to reduce the power consumption over time.
The inter-company benefit of the solar plant (owned by Caledonia) is not
recognised in on-mine cost because the solar plant sells power to Blanket at a price per kilowatt/hour which reflects Blanket's historic
blended cost per unit of power. The economic benefit of the solar plant is therefore recognised by Caledonia, rather than by Blanket,
and the benefit ($51 per ounce of gold produced in the Quarter) is reflected in the AISC rather than the on-mine cost. The solar plant
has the added benefit of stabilising the Blanket electrical grid by improving the power factor and in turn reducing the generator use
to supplement reactive power. The proposed sale of the solar plant to a third party should have no effect on the terms or quality of supply
from the solar plant to Blanket. The power from the solar plant is more reliable and reduced the diesel consumption to262 kilo litres
of diesel in the Quarter compared to an average of 355 kilo litres per quarter in 2022, before the solar plant was commissioned.
In April 2023 Blanket concluded a power supply agreement with the Intensive
Energy Users Group (“IEUG") and the Zimbabwean power utility to allow the IEUG to obtain power outside Zimbabwe which is "wheeled”
to the IEUG members. During the Quarter Blanket paid less for IEUG sourced energy but the incidences of power outages and low voltage
occurrences did not reduce due to the poor condition of the Zimbabwe grid which meant that diesel costs continued to be incurred to supplement
the low voltage occurrences.
Labour costs at Blanket increased during the Quarter due to a higher headcount
and inflationary increases offset by a decrease in the overtime paid in the Quarter. On a per ounce basis the labour cost at Blanket decreased
by $2 per ounce from the comparable quarter due to higher ounces sold in the Quarter.
Consumable costs per ounce at Blanket in the Quarter decreased by $13 per
ounce due to higher ounces sold in the Quarter compared to the comparative quarter which meant that fixed consumable costs were spread
across more ounces and reductions in the prices of certain consumables.
Other production costs remained stable and reduced on a per ounce basis
by $6 per ounce in the Quarter compared to the comparative quarter.
All-in sustaining cost
All-in sustaining cost includes inter alia administrative expenses
incurred outside Zimbabwe and excludes the intercompany procurement margin and the benefits of solar power as this reflects the consolidated
cost incurred at the Group level. Accordingly, the all-in sustaining cost can only be calculated at a consolidated level and not at the
level of individual operations. The all-in sustaining cost per ounce for the Quarter was 8.3% lower than the comparative quarter due to
the lower on mine costs, lower sustaining capital expenditure and sustaining administrative costs that was partly offset by a higher royalty
cost per ounce due to the higher gold revenue. AISC was reduced by the intercompany procurement margin of $22 per ounce and by the solar
power generation produced and sold to Blanket by Caledonia, which together reduced AISC by $51 per ounce on a consolidated basis (inter
group charges are included in the on-mine cost and deducted from AISC).
AISC is lower than in comparable quarter because of the reduction in the cost
of the Bilboes oxides and lower general and administration cost in the Quarter.
The decrease in AISC per ounce in the Quarter compared to the comparative
quarter is illustrated in the graph below:
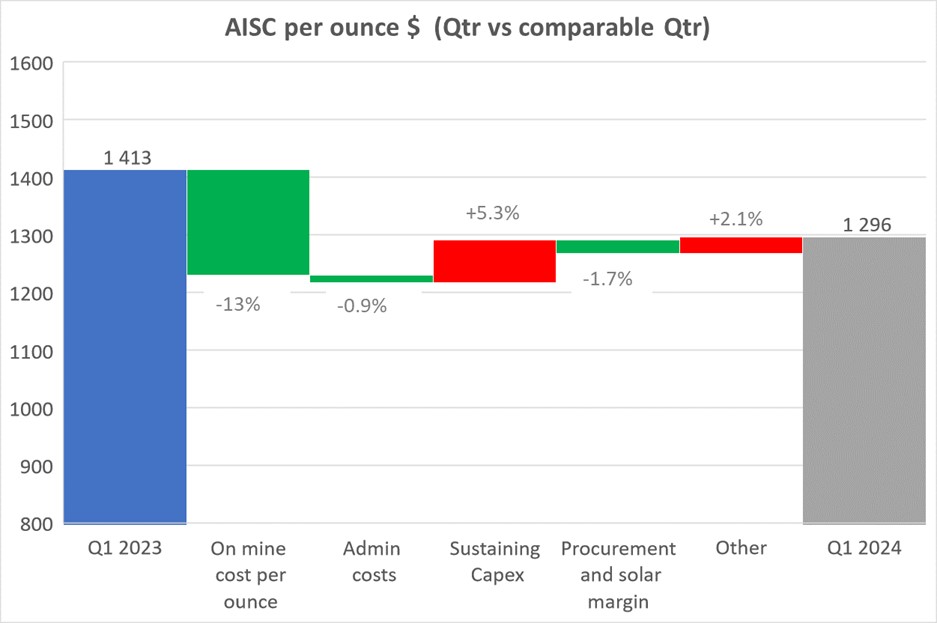
All-in cost
All-in cost includes investment in expansion projects at Blanket and Bilboes
which remained at a high level in the Quarter due to the continued investment, as discussed in section 4.7 of this MD&A. All-in cost
does not include pre-feasibility investment in exploration and evaluation projects.
| 4.7 | Capital Projects – Blanket |
The main capital development project is the infrastructure which will allow
for three new production levels (26, 30 and 34 levels); a fourth level (38 level) is to be added in due course via a twin decline that
commenced in February 2023. 4,258 development metres were achieved in the Quarter compared to 5,619 metres in the previous quarter.
Work on key development areas in the Quarter are detailed below:
| · | The 750 Lima Diamond Drilling crosscut and chamber is anticipated to be completed by the end of May 2024. |
| · | The 870-900 Eroica North Decline was successfully completed in February 2024. |
| · | 900 Eroica Extraction haulage and draw points. |
| · | The 990 Eroica North Hanging Wall Extraction haulage and draw points. This extension is necessary to facilitate
the mining of exploration drilling platforms in the northern region. |
| · | The 510 Lima extraction haulage and draw point crosscuts project is progressing, and it is anticipated
to be completed by June 2024. |
| · | The 990 Haulage north and shunting bays project extended its mining activities by 55 meters beyond the
2024 budget limit. This extension was necessary to create additional drilling platforms for exploration purposes. |
| · | The 990 Blanket Quartz Reef Hanging Wall North Extraction haulage and draw point crosscuts project. |
| · | 1110 Haulage north and shunting bays. Addition exploration Diamond Drilling cubbies are being developed
at 30-meter intervals on this haulage. |
| · | 34-38L decline return airway and connection crosscuts. |
| · | 34-38L Chairlift decline and connection crosscuts. |
| · | 34L Conveyor incline to be finalised in the second quarter of 2024. |
| · | The anticipated total cost of the new TSF is $25.1 million which will be incurred over a period of 3 years
(2023: $11.4 million, 2024: $5.4 million and 2025: $8.3 million). Work on the TSF commenced in March 2023 and the first phase of the project
was completed at the end of February 2024. Deposition on the new TSF commenced on October 30, 2023 and all of Blanket’s tailings
were deposited on the new facility from the beginning of 2024. Work on Phase 1B of the new TSF started in March 2024 and is expected to
be completed in the second quarter of 2024. The new TSF is double-lined (clay and a plastic membrane, in compliance with international
best-practice; the new TSF, when complete, will have a life until 2043 at the projected deposition rate of 900,000 tonnes per annum. |
As set out in previous MD&As, transactions that implemented the indigenisation
of Blanket (which expression in this section and in certain other sections throughout this MD&A refers to the Zimbabwe company that
owns Blanket) were completed on September 5, 2012 following which Caledonia owned 49% of Blanket.
Following the appointment of President Mnangagwa in 2017, the requirement
for gold mining companies to be indigenised was removed by a change in legislation with effect from March 2018. On November 6, 2018, the
Company announced that it had entered into a sale agreement with Fremiro Investments (Private) Limited (“Fremiro”) to purchase
Fremiro’s 15% shareholding in Blanket for a gross consideration of $16.7 million, which was to be settled through a combination
of the cancellation of the loan between the two entities which stood at $11.5 million as at June 30, 2018 and the issue of 727,266 new
shares in Caledonia at an issue price of $7.15 per share. This transaction was completed on January 20, 2020 following which Caledonia
has a 64% shareholding in Blanket and Fremiro held approximately 6.3% of Caledonia’s enlarged issued share capital.
As a 64% shareholder, Caledonia receives 64% of Blanket’s dividends
plus the repayment of vendor facilitation loans which were extended by Blanket to certain of the indigenous shareholders. The outstanding
balance of the facilitation loans at March 31, 2024 was $13.4 million (December 31, 2022: $15 million). The facilitation loans (including
interest thereon) are repaid by way of dividends from Blanket; 80% of the dividends declared by Blanket which are attributable to the
beneficiaries of the facilitation loans are used to repay such loans and the remaining 20% unconditionally accrues to the respective indigenous
shareholders. The dividends attributable to GCSOT, which holds 10% of Blanket, were withheld by Blanket to repay the advance dividends
which were paid to GCSOT in 2012 and 2013.
The final payment to settle the advance dividend loan to GCSOT was made
on September 22, 2021. Dividends to GCSOT after that date are unencumbered.
The facilitation loans are not shown as receivables in Caledonia’s
financial statements in terms of IFRS. These loans are effectively equity instruments as their only means of repayment is via dividend
distributions from Blanket. Caledonia continues to consolidate Blanket for accounting purposes. Further information on the accounting
effects of indigenisation at Blanket is set out in note 6 to the Interim Financial Statements.
Sulphides feasibility study
The main objective at Bilboes is to construct a large, multiple open-pit
operation to extract sulphide mineralisation. A feasibility study in respect of the Bilboes sulphide project was prepared by the previous
owners which targeted mine and processing operations to produce an average of 168,000 ounces of gold per annum over a 10-year life of
mine.
Work to refresh the existing feasibility study is well-advanced. Management
is considering alternative development paths for Bilboes, with a view to optimising capital allocation and maximising the uplift in value
for Caledonia shareholders.
The new body of work that has been done by Caledonia has been for the purposes
allowing the Company to decide on the best allocation of capital between different approaches to the development of Bilboes. Accordingly,
the various streams of work have been prepared to the level of a Preliminary Economic Analysis ("PEA”) also referred to as
an Initial Assessment (“IA") in the United States). The work that has been done in respect of the identified development approach
is currently being finalised for publication in the second quarter of 2024. Thereafter further work will be done to upgrade the work that
has been done on the identified development option to bring it to the level of a Feasibility Study. This work is expected to be done in
parallel with process to secure debt for the project.
A major aspect of the revised development plan relates to the design of
the TSF, which is a significant component of the total capital expenditure for the project. Caledonia has drawn upon its recent experience
of constructing the TSF at Blanket on a modular basis to reduce the initial capital cost of the project. This will be the main area of
focus when the work that has already been done is upgraded to the level of a Feasibility Study. There is currently a very high level of
activity globally in the field of tailings facilities, which means that the relevant consulting firms do not have sufficient capacity
to cope with the demand for their services. Accordingly, we have been advised that this aspect of the work required to prepare a Feasibility
Study will take at least 9 months.
Oxide mining activities
In the fourth quarter of 2022, a small operation was started to mine and
process oxide mineralisation at Bilboes. The oxide mining activities were restarted predominantly with the
objective to generate cash flows to pay for the existing cost structures at Bilboes Holdings (Private) Limited (“Bilboes Holdings”),
and later the oxide mining activities were placed on care and maintenance at the end of September 2023. Oxide mining activities
will resume in due course in conjunction with the larger sulphide project. Leaching of ore placed on the heap leach continued in the Quarter
and had no material effect on Caledonia's financial performance. Leaching activities will continue for as long
as they make a positive cash contribution
| 4.10 | Zimbabwe Commercial Environment |
Monetary Conditions
The current situation in Zimbabwe can be summarised as follows:
| · | Blanket produces dore gold that it is obliged to deliver to FGR, a subsidiary of the RBZ, which refines
the gold to a purity of 99.5% on a toll-treatment basis. With effect from April 2023, 25% of the resultant gold is sold to FGR and the
remaining 75% is exported by Caledonia to a refiner of its choice outside Zimbabwe final processing. During the Quarter, all gold exports
were sold to Al Etihad Gold Refinery DMCC in Dubai. The sale proceeds for the gold sold via the offshore refiner are paid to Blanket’s
commercial bankers in Zimbabwe within 48 hours of delivery. Management believes this new sales mechanism reduces the risk associated with
selling and receiving payment from a single refining source in Zimbabwe. It also creates the opportunity to use more competitive offshore
refiners and it may allow for the Company to raise debt funding secured against offshore gold sales. 25% of Blanket's gold is sold to
FGR at a price which reflects the prevailing London Bullion Market Association price and the official RTGS$/USD exchange rate on the date
of sale. Payment is made by FGR to Blanket in RTGS$ within 14 days of the sale. FGR deducts a refining fee of 1.24% from the RTGS$ sale
proceeds; FGR collects half of the 5% royalty which is payable to the Government of Zimbabwe in physical gold which is deducted from the
amount exported and the balance is paid in USD and RTGS$ to the proportionately 75:25 revenue split between USD and RTGS$. |
| · | The interbank RTGS$/USD and ZiG/USD exchange rates at each quarter end and at the latest practicable date
prior to the publication of this MD&A are set out below. |
| Interbank Exchange Rates | |
(RTGS$:US$1) | | |
(ZiG:US$1) | |
| February 20, 2019 | |
| 2.50 | | |
| | |
| March 31, 2019 | |
| 3.00 | | |
| | |
| June 30, 2019 | |
| 6.54 | | |
| | |
| September 30, 2019 | |
| 15.09 | | |
| | |
| December 31, 2019 | |
| 16.77 | | |
| | |
| March 31, 2020 | |
| 25.00 | | |
| | |
| June 30, 2020 | |
| 57.36 | | |
| | |
| September 30, 2020 | |
| 81.44 | | |
| | |
| December 31, 2020 | |
| 81.79 | | |
| | |
| March 31, 2021 | |
| 84.40 | | |
| | |
| June 30, 2021 | |
| 85.42 | | |
| | |
| September 30, 2021 | |
| 87.67 | | |
| | |
| December 31, 2021 | |
| 108.66 | | |
| | |
| March 31, 2022 | |
| 142.42 | | |
| | |
| June 30, 2022 | |
| 370.96 | | |
| | |
| September 30, 2022 | |
| 621.89 | | |
| | |
| December 31, 2022 | |
| 684.33 | | |
| | |
| March 31, 2023 | |
| 913.67 | | |
| | |
| June 30, 2023 | |
| 5,739.80 | | |
| | |
| September 30, 2023 | |
| 5,466.75 | | |
| | |
| December 31, 2023 | |
| 6,104.72 | | |
| | |
| March 31, 2024 | |
| 22,055.47 | | |
| | |
| April 5, 2024 | |
| 30,674.32 | | |
| 13.56 | |
| May 10, 2024 | |
| | | |
| 13.52 | |
Devaluation of the RTGS$ means that net monetary assets held in RTGS$ will
devalue in USD terms. In the ordinary course of its business, Caledonia has net RTGS$-denominated assets comprising RTGS$-denominated
cash and receivables (primarily for the 25% of gold sold to FGR and VAT receivables) and RTGS$ liabilities (mainly comprising taxes payable).
During the first quarter of 2024, due to the sharp acceleration in the rate of RTGS$ devaluation, management engaged more aggressively
in RTGS$-denominated procurement to reduce its RTGS$-denominated cash and lock in the prices of goods and services. To curb against the
devaluation of the RTGS$ on hand, Blanket made prepayments of approximately $2 million in March 2024 by using RTGS$. RTGS$ cash balances
at March 31, 2024 amounted to a USD equivalent of $0.2 million.
On April 5, 2024 the Reserve Bank of Zimbabwe issued a Monetary Policy
Statement that introduced a structured currency (which is generally defined as a currency that is pegged to a specific exchange rate or
currency basket and backed by a bundle of foreign exchange assets (including gold)). The structured currency called the ZiG replaced the
RTGS$ from the said date. Banks were instructed to convert the RTGS$ balances into the new currency to foster simplicity, certainty and
predictability in monetary and financial affairs. The new currency will co-circulate with other foreign currencies in the economy. The
retention threshold remained unchanged.
Stability in the ZiG in relation to other foreign currencies will reduce
the volitality and reduce the foreign exchange gains and losses accounted for in profit or loss.
At the same time as the introduction of the ZiG, the Zimbabwe
authorities announced a liberalisation of the foreign exchange market in Zimbabwe. Whereas previously the exchange rate for RTGS$ was
determined by the RBZ, in future the exchange rate will be determined by a process of transparent price discovery in an interbank market.
To date the price discovery in an interbank market has not been determined as trading in ZiG has been relatively limited.
Electricity supply
The poor quality of electricity supply from the Zimbabwe Electricity Supply
Authority (“ZESA”) is the most significant production risk at Blanket. During the Quarter, Blanket experienced interruptions
to its power supply from the grid due to an imbalance between electricity demand and supply.
In the absence of equipment to control these surges, Blanket needs to switch
to diesel power to allow mining and processing activity to continue, but generator use increases production costs and capital expenditure.
The following initiatives have been implemented by Blanket to alleviate
the power challenges:
| · | Over recent years it increased its diesel generating capacity to 18MVA (maximum of 13.6 MW at full capacity,
and up to 10MW on continuous running) of installed capacity which is was insufficient to maintain all operations and
capital projects both on a stand-by basis and continuous running basis. |
| · | Installed two 10MVA auto tap transformers on the ZESA supply line to protect equipment at No. 4 Shaft
and the main metallurgical plant from voltage fluctuations on the incoming grid supply. |
| · | Two further 10MVA auto tap transformers were installed to protect equipment at Central Shaft. |
| · | An additional 10MVA auto tap transformer was installed in 2023 to protect the new compressor set-up at
Central Shaft. |
| · | Caledonia’s 12.2Mwac solar plant, fully commissioned in early February 2023 at a cost of $14.2 million.
The solar plant is operating slightly better than anticipated, but the lower level of contribution to Blanket's overall electricity use
(approximately 20% compared to an initial estimate of 27%) reflects Blanket's overall increase in electricity use following the commissioning
of Central shaft. In April 2023 Blanket entered into a power supply agreement with the IEUG and the Zimbabwean power utility to allow
the IEUG to obtain power outside of Zimbabwe and contribute to the Zimbabwean power grid. As a result of this arrangement, Blanket has
paid a lower tariff for IEUG supplied energy from April 2023, but it has not improved the power quality received at Blanket due to the
continued difficulty with the Zimbabwe grid. |
The following initiatives are planned or are under consideration to alleviate
the power challenges Blanket faces:
| · | Management plans to install power factor connection equipment for the two winders at Central shaft to
reduce the peak electricity demand, specifically focusing on power usage when starting up the Central shaft winders. The very high level
of power drawn by the winders from the grid has resulted in significant penalty charges from the ZESA which has contributed to the increased
cost of power. The equipment is intended to reduce the reactive power (kVAR) drawn from the grid and reduce the actual power (kWh) consumed
when the Central Shaft winders are started up. The initiative has the further benefit of improving the power factor from 0.7 to almost
1, ensuring that proposed power factor penalties from the utility provider are not incurred. Management plans to have the power factor
correction equipment installed by quarter 4 of 2024. Increasing the hoist payload and hoisting speed, and improving the sequencing of
hoists at the Central shaft, will also allow hoisting to take place outside the peak hours that attract a higher cost per kWh. The improved
sequencing will also mean that the hoisting hours are reduced thereby allowing more time for maintenance of the winders and the shaft. |
| · | Management is considering the power-saving effect of the Central shaft winder hoisting mechanisms to reduce
the power needed to start the shaft. |
| · | Equipment with less efficient power use is being considered for replacement by more efficient modern equipment
as such equipment falls due for replacement. |
| · | Further investigations are in process to reduce Blanket's overall electricity consumption by using the
available shafts and machinery more efficiently. |
| · | Management is performing studies to consider an increase to the solar plant that will increase the stability
of supply as well as enhance the power factor of the Blanket Mine local power network. |
The options to alleviate the instability in the utility supply and further
reduce the cost of diesel generator usage to supplement low voltage occurrences and power outages will be an ongoing focus for management.
Water supply
Blanket uses water in the metallurgical process. The mine is situated
in a semi-arid region and rainfall typically only occurs in the period November to February. The 2023/2024 rainy season has been poor,
and measures to reduce water consumption or to identify additional water sources (e.g. boreholes) are under consideration. Blanket
mine commissioned a new TSF in October 2023, which is lined with a HDPE geomembrane over a compacted clay layer. The liner has significantly
reduced seepage from the TSF into groundwater, and water recycled back to the plant for re-use has increased by 81% in comparison to Q1
2023 which has resulted in a reduction in the amount of raw water extracted from the public dam.
Taxation and royalty
The main elements of the Zimbabwe tax regime insofar as it affects Blanket
and Caledonia are as follows:
| · | A royalty is levied on gold revenues at a rate of 5% if the gold price is above $1,200 per ounce; a royalty
rate at 3% applies if the gold price is below $1,200 per ounce. With effect from January 1, 2020, the royalty is allowable as a deductible
expense for the calculation of income tax. |
| · | With effect from February 4, 2022, the 5% royalty was payable in the same proportions of currencies as
revenues are received. On October 9, 2022, the Zimbabwean Government announced that 50% of royalty payments will be payable in gold. |
| · | Income tax is levied at 25.75% (2024: 24.72%) on taxable income as adjusted for tax deductions in the
tax year. The main adjustments to taxable income for the purposes of calculating tax are the add-back of depreciation and most of the
management fees paid by Blanket to CMSA. There is a deduction of 100% of all capital expenditure incurred in the year of assessment. As
noted above, the royalty is deductible for income tax purposes. The calculation of taxable income is performed using financial accounts
prepared in USD and split between USD and RTGS$ (from April 5, 2024, the ZiG) based on the currency in which the transactions are denominated
in. Large devaluations in the RTGS$ to the USD has reduced most of the deferred tax liability denominated in RTGS$. |
| · | Withholding tax is levied on certain remittances from Zimbabwe i.e. dividend payments from Zimbabwe to
the UK and payments of management fees from Blanket to CMSA. |
As noted in section 4.10, Blanket suffers from unstable grid power and
power outages. In late 2019 Caledonia initiated a tender process to identify parties to make proposals for a solar project to reduce Blanket’s
reliance on grid power. In 2020, the Caledonia board approved the project and the Company raised $13 million (before commission and expenses)
to fund the project through the sale of 597,963 shares at an average price of $21.74 per share. Caledonia’s 12.2 MWac solar plant
was connected to the Blanket grid in November 2022 and was fully commissioned in early February 2023 at a construction cost of $14.2 million.
At the date of the approval of this MD&A the plant provides approximately 20% of Blanket’s total electricity requirement.
In December 2022, the Caledonia board approved a proposal for Caledonia
Mining Services (Private) Limited (“CMS”) (which owns the solar plant) to issue bonds up to a value of $12 million in the
form of loan notes (the “bonds”). The decision was taken to optimise the capital structure of the Group and provide additional
debt instruments to the Zimbabwean financial market. The bonds have a fixed interest rate of 9.5% payable bi-annually and have a tenor
of 3 years from the date of issue. During 2024 all bonds issued by CMS were transferred to CHZ and subsequent bond issues were made by
CHZ. Bond repayments are guaranteed by the Company and up to the date of this MD&A, $9 million of bonds have been issued to Zimbabwean
commercial entities.
Due to the unique operating environment in Zimbabwe and Caledonia’s
significant in-country expertise, Caledonia opted to build the solar plant using its own resources rather than relying on an external
party to build and own the solar plant using its financial resources and selling the resultant power to Blanket on a long-term contract.
Accordingly, Caledonia constructed the solar plant using its own financial resources at a cost of $14.2 million. As the solar plant is
now fully commissioned and is working as planned, Caledonia no longer needs to own the solar project, provided it retains long term access
to the power it produces.
In the second quarter of 2023 management embarked on a process to sell
the solar plant. Various offers were received, and a bidder has been given exclusivity to conduct due diligence and further negotiate
the sale of the plant after proving their ability to operate and fund solar plants of similar size and complexity. Management is in an
advanced stage of finalising the contractual arrangements to sell the solar plant whereby the new owners will exclusively supply Blanket
with electricity from it. In recent months the terms of the transaction have been revised to cater for the extension to Blanket's life
of mine, based on internal estimates and inferred resources, that increases the life of the power purchase agreement which in turn has
implications for the overall transaction value This transaction is expected to realise a profit on Caledonia's investment in the plant
and release cash for reinvestment in Caledonia’s core business of gold.
The solar asset was classified as held for sale as at March 31, 2024 in
the Interim Financial Statements.
| 4.12 | Opportunities and Outlook |
Production guidance 2024
Production guidance for Blanket in 2024 is estimated at between 74,000
and 78,000 ounces.
This is forward looking information as defined by National Instrument 51-102.
Refer to section 18 of this MD&A for further information on forward looking statements.
On-mine cost
The on-mine cost per ounce at Blanket in the Quarter was $993. The on-mine
production cost consists of a large monthly fixed cost base which increases the on-mine cost per ounce in the Quarter with a relatively
low number of production days. The three months in the Quarter consisted of 78 production days compared to 91 average production days
planned in the quarters of the remaining nine months of 2024. Accordingly, the fixed cost base per ounce should reduce as the expected
sales ounces per quarter increases in the remaining months of 2024. The on-mine cost was within expectation and therefore the yearly on-mine
cost guidance at Blanket is maintained at the $870 to $970 per ounce range as announced on January 12, 2024.
All-in sustaining cost guidance
AISC was $1,296 during the Quarter, lower than production guidance of $1,370
to $1,470 per ounce due to the timing of the sustaining capital spending that is planned for later in 2024. Production guidance announced
on January 12, 2024 is therefore maintained at $1,370 to $1,470 per ounce.
This is forward looking information as defined by National Instrument 51-102.
Refer to section 18 of this MD&A for further information on forward looking statements.
Capital expenditure
Capital expenditure at Blanket in 2024 is estimated at $30.8 million (inclusive
of CMSA’s mark-up). Planned capital expenditure for 2024 is planned in the following areas:
| · | New TSF (Phase 1B) - $4.7 million; |
| · | Underground capital development at 30 and 34 levels - $8 million; |
| · | Utilities for the Central shaft infrastructure - $2.1 million; |
| · | Information technology infrastructure - $1.5 million; |
| · | Electrical engineering - $2.5 million; |
| · | Mill and surface engineering - $2.1 million; and |
| · | Staff housing - $1.4 million. |
Expenditure for the Quarter amounted to $4.1 million (inclusive of CMSA’s
mark-up) at Blanket and was incurred on the following:
| · | New TSF (Phase 1B) - $1.6 million; |
| · | Capital development at 30 and 34 levels - $1.8 million; |
| · | Utilities for the Central Shaft infrastructure - $0.15 million; and |
| · | Deep drilling - $0.2 million. |
Strategy
The immediate strategic focus is to:
| · | maintain production at Blanket at the targeted range of 74,000 to 78,000 ounces for 2024 and at a similar
level for 2025; |
| · | communicate the preferred development approach to the Bilboes sulphide project; commence the financing
process in parallel with upgrading the work that has already been done on the preferred development option to the level of a feasibility
study; and commence development of the sulphide project; and |
| · | continue with exploration activities at Motapa. |
Caledonia’s exploration activities are focussed on Blanket and Motapa.
Blanket
Drilling results at Blanket that targeted the continuity of the
AR south, Eroica and Blanket orebodies’ mineralised zones yielded excellent results and, in general, the Blanket, Eroica and AR
south ore bodies have better grades and widths than expected.
An updated mineral reserve and resource statement will be published in
May 2024.
Motapa
The Motapa exploration program to date has consisted of trenching which
has identified several promising drilling targets. work is currently under way to prepare the drill-pads. An initial 5-month drill-programme
comprising a total of 49 holes and approximately 8,600 meters diamond and reverse circulation drilling is planned to start in the second
quarter of 2024.
An analysis of investments is set out below.
| ($’000’s) | |
| 2021 | | |
| 2022 | | |
| 2023 | | |
| 2024 | |
| | |
| Year | | |
| Year | | |
| Year | | |
| Q1 | |
| Property, plant and equipment | |
| | | |
| | | |
| | | |
| | |
| Blanket | |
| 29,323 | | |
| 34,267 | | |
| 28,240 | | |
| 3,552 | |
| Solar | |
| 1,581 | | |
| 12,198 | | |
| 163 | | |
| - | |
| Other | |
| 365 | | |
| 967 | | |
| 1,203 | | |
| 46 | |
| Total investment – property, plant and equipment | |
| 31,269 | | |
| 47,432 | | |
| 29,606 | | |
| 3,598 | |
| | |
| | | |
| | | |
| | | |
| | |
| Exploration and evaluation assets | |
| | | |
| | | |
| | | |
| | |
| Bilboes | |
| - | | |
| - | | |
| 73,573 | | |
| 48 | |
| Connemara North | |
| 163 | | |
| 4 | | |
| - | | |
| - | |
| Glen Hume | |
| 1,176 | | |
| - | | |
| - | | |
| - | |
| Maligreen | |
| - | | |
| 1,430 | | |
| 372 | | |
| 7 | |
| Motapa | |
| - | | |
| 7,844 | | |
| 2,748 | | |
| 324 | |
| Other Satellite properties | |
| 243 | | |
| 120 | | |
| - | | |
| 51 | |
| Total investment – exploration and evaluation assets | |
| 1,582 | | |
| 9,398 | | |
| 76,693 | | |
| 430 | |
Investment in property, plant and equipment at Blanket is discussed in
section 4.7 of this MD&A; investment in exploration and evaluation assets is as set out in section 5.
Operating and investing activities at Blanket in the Quarter were funded
by Blanket's operating cashflows and from Blanket’s overdraft facilities which were as set out below at March 31, 2024.
| Overdraft facilities |
|
| Lender |
Date
drawn |
Principal
value |
Balance drawn at
March 31, 2024 |
Repayment
terms |
Security |
Expiry |
| Stanbic Bank Limited |
Sep-23 |
RTGS$350 million |
$Nil |
On demand |
Unsecured |
Jun-24 |
| Stanbic Bank Limited |
Sep-23 |
$4 million |
$3.9 million |
On demand |
Unsecured |
Jun-24 |
| CABS Bank |
Aug-23 |
$2 million |
$2 million |
On demand |
Unsecured |
Jul-24 |
| CABS Bank |
Mar-23 |
$3 million |
$Nil |
On demand |
Unsecured |
Mar-27 |
| Ecobank |
Nov-22 |
$5 million |
$5.1 million |
On demand |
Unsecured |
Dec-24 |
| Nedbank |
Apr-23 |
$7 million |
$5.0 million |
On demand |
Unsecured |
Apr-25 |
| |
|
|
|
|
|
|
Hedging
From December 2022 to the date of approval of the MD&A, the Company
had the following put options to hedge gold price risk:
| Purchase date |
Ounces hedged |
Strike price |
Period of hedge |
| December 22, 2022 |
16,672 oz |
$1,750 |
December 2022 to May 2023 |
| May 22, 2023 |
28,000 oz |
$1,900 |
June to December 2023 |
| December 19, 2023 |
12,000 oz |
$1,950 |
January to March 2024 |
| March 7, 2024 |
12,000 oz |
$2,050 |
April to June 2024 |
| April 10, 2024 |
12,000 oz |
$2,100 |
July to September 2024 |
The put options were entered into to protect the Company against
gold prices lower than the strike price over the period hedged. The options are “out-of-the-money"
put options which lock in a minimum price over the number of ounces that are subject to the hedge for an initial option price. These arrangements
carry no further financial obligations, such as margin calls.
Loan notes
In December 2022, the Caledonia board approved a proposal for Caledonia
Mining Services (Private) Limited (“CMS”) (which owns the solar plant) to issue bonds up to a value of $12 million in the
form of loan notes (the “bonds”). The decision was taken to optimise the capital structure of the Group and provide additional
debt instruments to the Zimbabwean financial market. The bonds have a fixed interest rate of 9.5% payable bi-annually and have a tenor
of 3 years from the date of issue. The bond repayments are guaranteed by the Company, and up to the date of this MD&A, $9 million
of bonds have been issued to Zimbabwean commercial entities. Due to the expected sale of CMS, the obligation for repayment of the bonds
were transferred to CHZ, a wholly owned subsidiary of Caledonia, which became the issuer of the bonds in place of CMS. Caledonia believes
the development of a Zimbabwe bond market will be a long-term strategic benefit to the Company, accordingly Caledonia wishes to retain
and develop the existing retlationships it has established with institutional bond investors in Zimbabwe who hold the bonds that have
already been issued.
| 8. | LIQUIDITY AND CAPITAL RESOURCES |
An analysis of Caledonia’s capital resources is set out below.
| Liquidity and Capital Resources | |
| |
| ($’000’s) | |
| |
| | |
| | |
| | |
| | |
| | |
| | |
| |
| As at | |
Dec 31 | | |
Mar 31 | | |
Jun 30 | | |
Sep 30 | | |
Dec 31 | | |
Mar 31 | |
| | |
| 2022 | | |
| 2023 | | |
| 2023 | | |
| 2023 | | |
| 2023 | | |
| 2024 | |
| | |
| | | |
| | | |
| | | |
| | | |
| | | |
| | |
| Net cash and cash equivalents | |
| 1,496 | | |
| 3,189 | | |
| (2,097 | ) | |
| (3,192 | ) | |
| (11,032 | ) | |
| (14,160 | ) |
| Net working capital | |
| 5,986 | | |
| 3,677 | | |
| 7,674 | | |
| 18,758 | | |
| 14,096 | | |
| 9,320 | |
During the Quarter cash flows were negatively affected by working capital
movements of $4.1 million that is expected to normalise in future quarters. Movements in Caledonia’s net cash, overdraft and working
capital and an analysis of the sources and uses of Caledonia’s cash are discussed in section 3 of this MD&A. The overdraft and
term facilities are held by Blanket with Zimbabwean banks with security and repayment periods as detailed in section 7. The Company’s
liquid assets as at March 31, 2024 plus anticipated cashflows exceeded its planned and foreseeable commitments as set out in section 9.
| 9. | OFF-BALANCE SHEET ARRANGEMENTS, CONTRACTUAL COMMITMENTS AND CONTINGENCIES |
There are no off-balance sheet arrangements apart from the facilitation
loans which are not reflected as loans receivable for IFRS purposes (refer to note 5 of the Interim Financial Statements). The Company
had the following contractual obligations at March 31, 2024:
| Payments due by period | |
| | |
| | |
| | |
| | |
| |
| ($’000’s) | |
| | |
| | |
| | |
| | |
| |
| Falling due | |
| Within 1 year | | |
| 1-3 Years | | |
| 4-5 Years | | |
| After 5 Years | | |
| Total | |
| Trade and other payables | |
| 20,842 | | |
| - | | |
| - | | |
| - | | |
| 20,842 | |
| Provisions | |
| 93 | | |
| 348 | | |
| 334 | | |
| 9,620 | | |
| 10,395 | |
| Capital expenditure commitments | |
| 3,718 | | |
| - | | |
| - | | |
| - | | |
| 3,718 | |
| Lease liabilities | |
| 141 | | |
| 30 | | |
| - | | |
| - | | |
| 171 | |
| Cash-settled share-based payments | |
| 313 | | |
| 441 | | |
| - | | |
| - | | |
| 754 | |
| Loan notes (bonds) | |
| 665 | | |
| 6,405 | | |
| - | | |
| - | | |
| 7,070 | |
The capital expenditure commitments relate to materials and equipment which
have been ordered by CMSA and which will be sold to Blanket.
Other than the proposed investment in the exploration properties, the committed
and uncommitted investment will be used to maintain Blanket’s existing operations and implement the final development relating to
the Central Shaft and the further stages of the new TSF as discussed in section 4.7 of this MD&A.
Committed and uncommitted purchase obligations are expected to be met from
the cash generated from Blanket’s existing operations and Blanket’s existing borrowing facilities. The Group leases property
for its administrative offices in Jersey, Harare and Johannesburg; following the implementation of IFRS 16 the Group recognises the liabilities
for these leases. As of March 31, 2024, the Group had liabilities for rehabilitation work on Blanket – if the mine is permanently
closed – at an estimated discounted cost of $4.2 million (December 31, 2023: $4.7 million), Motapa’s liability amounted to
$1.4 million (December 31, 2023: $1.4 million), and Bilboes’ liability amounted to $4.4 million (December 31, 2023: $4.4 million).
Throughout this document, we provide measures prepared in accordance with
IFRS in addition to some non-IFRS performance measures. As there is no standard method for calculating non-IFRS measures, they are not
a reliable way to compare Caledonia against other companies. Non-IFRS measures should be used along with other performance measures prepared
in accordance with IFRS. We define below the non-IFRS measures used in this document and reconcile such non-IFRS measures to the IFRS
measures we report.
Non-IFRS performance measures such as “on-mine cost per ounce”,
“all-in sustaining cost per ounce” and “all-in cost per ounce” are used in this document. Management believes
these measures assist investors and other stakeholders in understanding the economics of gold mining over the life cycle of a mine. These
measures are calculated on the basis set out by the World Gold Council in a Guidance Note and accordingly differ from the previous basis
of calculation. The table below reconciles non-IFRS cost measures to the production costs shown in the financial statements prepared under
IFRS.
| Reconciliation of IFRS Production Cost to Non-IFRS Costs per ounce |
| ($’000’s, unless otherwise indicated) |
| | |
Bilboes Oxides | | |
Blanket | | |
Consolidated | |
| | |
3 months ended March 31 | | |
3 months ended March 31 | | |
3 months ended March 31 | |
| | |
2024 | | |
2023 | | |
2024 | | |
2023 | | |
2024 | | |
2023 | |
| | |
| | |
| | |
| | |
| | |
| | |
| |
| Production cost (IFRS) | |
| 784 | | |
| 3,345 | | |
| 18,176 | | |
| 16,505 | | |
| 18,960 | | |
| 19,850 | |
| COVID-19 labour and consumable expenses | |
| - | | |
| - | | |
| - | | |
| (1 | ) | |
| - | | |
| (1 | ) |
| Cash-settled share-based expense | |
| (9 | ) | |
| - | | |
| (90 | ) | |
| (394 | ) | |
| (99 | ) | |
| (394 | ) |
| Less exploration and safety costs | |
| - | | |
| - | | |
| (220 | ) | |
| (261 | ) | |
| (220 | ) | |
| (261 | ) |
| On-mine admin costs, employee incentives and intercompany adjustments | |
| - | | |
| - | | |
| 462 | | |
| (298 | ) | |
| 462 | | |
| (298 | ) |
| On-mine production cost* | |
| 775 | | |
| 3,345 | | |
| 18,328 | | |
| 15,551 | | |
| 19,103 | | |
| 18,897 | |
| Gold sales (oz) | |
| 426 | | |
| 105 | | |
| 18,450 | | |
| 15,692 | | |
| 18,876 | | |
| 15,797 | |
| On-mine cost per ounce ($/oz) | |
| 1,820 | | |
| 31,857 | | |
| 993 | | |
| 991 | | |
| 1,012 | | |
| 1,196 | |
| | |
| | | |
| | | |
| | | |
| | | |
| | | |
| | |
| Royalty | |
| 319 | | |
| 9 | | |
| 1,615 | | |
| 1,471 | | |
| 1,934 | | |
| 1,480 | |
| Exploration, remediation and permitting cost | |
| - | | |
| - | | |
| 26 | | |
| - | | |
| 26 | | |
| - | |
| Sustaining capital expenditure# | |
| - | | |
| - | | |
| 2,581 | | |
| 979 | | |
| 2,581 | | |
| 979 | |
| Sustaining administrative expenses& | |
| - | | |
| - | | |
| 1,873 | | |
| 968 | | |
| 1,873 | | |
| 968 | |
| Silver by-product credit | |
| - | | |
| - | | |
| (26 | ) | |
| (25 | ) | |
| (26 | ) | |
| (25 | ) |
| Cash-settled share-based payment expense included in production cost | |
| (9 | ) | |
| - | | |
| 108 | | |
| 394 | | |
| 99 | | |
| 394 | |
| Cash-settled share-based payment expense | |
| - | | |
| - | | |
| 53 | | |
| 280 | | |
| 53 | | |
| 280 | |
| Equity-settled share-based payment expense | |
| - | | |
| - | | |
| 201 | | |
| 110 | | |
| 201 | | |
| 110 | |
| Procurement margin included in on-mine cost* | |
| - | | |
| - | | |
| (1,373 | ) | |
| (770 | ) | |
| (1,373 | ) | |
| (770 | ) |
| All-in sustaining cost | |
| 1,085 | | |
| 3,354 | | |
| 23,386 | | |
| 18,95 | | |
| 24,471 | | |
| 22,312 | |
| Gold sales (oz) | |
| 426 | | |
| 105 | | |
| 18,450 | | |
| 15,692 | | |
| 18,876 | | |
| 15,797 | |
| AISC per ounce ($/oz) | |
| 2,549 | | |
| 31,940 | | |
| 1,267 | | |
| 1,208 | | |
| 1,296 | | |
| 1,412 | |
| | |
| | | |
| | | |
| | | |
| | | |
| | | |
| | |
| Non-sustaining administrative expenses& | |
| - | | |
| 2,900 | | |
| 738 | | |
| 2,070 | | |
| 738 | | |
| 4,970 | |
| Permitting and exploration expenses | |
| - | | |
| - | | |
| 17 | | |
| 18 | | |
| 17 | | |
| 18 | |
| Non-sustaining capital expenditure# | |
| - | | |
| 38 | | |
| 1,017 | | |
| 2,094 | | |
| 1,017 | | |
| 2,132 | |
| Total all-in cost | |
| 1,085 | | |
| 6,292 | | |
| 25,158 | | |
| 23,140 | | |
| 26,243 | | |
| 29,432 | |
| Gold sales (oz) | |
| 426 | | |
| 105 | | |
| 18,450 | | |
| 15,692 | | |
| 18,876 | | |
| 15,797 | |
| All-in cost per ounce ($/oz) | |
| 2,549 | | |
| 59,923 | | |
| 1,364 | | |
| 1475 | | |
| 1,390 | | |
| 1,863 | |
* The on-mine cost reflects the cost incurred to produce gold. The
procurement margin on consumable sales between CMSA and Blanket is not deducted from on-mine cost as the cost represents a fair value
that Blanket would pay for consumables if they were sourced from a third party. The procurement margin on these sales is deducted from
all-in sustaining cost and all-in cost as these numbers represent the consolidated costs at a group level, excluding intercompany profit
margins.
& Administrative expenses relate to costs incurred by the Group
to provide services for mining and related activities. From the last quarter of 2022 administrative expenses have been allocated between
AISC and all-in cost. Prior years have been restated in the MD&A.
# Non-sustaining costs are primarily those costs incurred at ‘new
operations’ and costs related to ‘major projects at existing operations’. All other costs related to existing operations
are considered sustaining.
| 10.2 | Average gold price per ounce |
The table below reconciles “Average gold price per ounce” to
the Revenue shown in the financial statements which have been prepared under IFRS.
| Reconciliation of average gold price per ounce |
| ($’000’s, unless otherwise indicated) | |
| | |
| |
| | |
3 months ended March 31 | |
| | |
2024 | | |
2023 | |
| Revenue (IFRS) | |
| 38,528 | | |
| 29,435 | |
| Revenues from sales of silver | |
| (27 | ) | |
| (25 | ) |
| Revenues from sales of gold | |
| 38,501 | | |
| 29,410 | |
| Gold ounces sold (oz) | |
| 18,876 | | |
| 15,803 | |
| Average gold price per ounce (US$/oz) | |
| 2,040 | | |
| 1,861 | |
| 10.3 | Adjusted earnings per share |
“Adjusted earnings per share” is a non-IFRS measure which management
believes assists investors to understand the Company’s underlying performance. The table below reconciles “adjusted earnings
per share” to the profit/loss attributable to owners of the Company shown in the financial statements which have been prepared under
IFRS. Adjusted earnings per share is calculated by deducting payments to Blanket Employee Trust Services (Private) Limited (“BETS”)
(the company that owns 10% of Blanket’s shares on behalf of an employee trust), foreign exchange gains and losses, impairments,
deferred tax and inventory write-downs from the profit attributable to the owners of the Company.
| Reconciliation of Adjusted earnings (loss) per share (“Adjusted EPS”) to IFRS Profit attributable to owners of the Company |
| ($’000’s, unless otherwise indicated) |
| | |
3 months ended
March 31 | |
| | |
2024 | | |
2023 | |
| Profit (loss) for the period (IFRS) | |
| 2,817 | | |
| (4,270 | ) |
| Non-controlling interest share of profit for the period | |
| (686 | ) | |
| (760 | ) |
| Profit (loss) attributable to owners of the Company | |
| 2,131 | | |
| (5,030 | ) |
| BETS adjustment | |
| (104 | ) | |
| (115 | ) |
| Earnings (loss) (IFRS) | |
| 1,943 | | |
| (5,145 | ) |
| Weighted average shares in issue (thousands) | |
| 19,192 | | |
| 16,964 | |
| IFRS EPS (cents) | |
| 10.56 | | |
| (30.33 | ) |
| | |
| | | |
| | |
| Add back (deduct) amounts in respect of foreign exchange movements | |
| | | |
| | |
| Realised net foreign exchange losses | |
| 3,565 | | |
| 216 | |
| - less tax | |
| (880 | ) | |
| (51 | ) |
| - less non-controlling interest | |
| (354 | ) | |
| (21 | ) |
| Unrealised net foreign exchange (gains)/losses | |
| 574 | | |
| (1,749 | ) |
| - less tax | |
| (187 | ) | |
| 309 | |
| - less non-controlling interest | |
| (68 | ) | |
| 106 | |
| Adjusted IFRS profit excl. foreign exchange | |
| 4,677 | | |
| (6,335 | ) |
| Weighted average shares in issue (thousands) | |
| 19,192 | | |
| 16,964 | |
| Adjusted IFRS EPS excl. foreign exchange (cents) | |
| 24.4 | | |
| (37.3 | ) |
| | |
| | | |
| | |
| Add back (deduct) amounts in respect of: | |
| | | |
| | |
| Reversal of BETS adjustment | |
| 104 | | |
| 115 | |
| Deferred tax | |
| 107 | | |
| 959 | |
| Non-controlling interest portion of deferred tax and impairment | |
| (21 | ) | |
| (107 | ) |
| Fair value losses on derivative financial instruments | |
| 302 | | |
| 434 | |
| Adjusted profit | |
| 5,169 | | |
| (4,934 | ) |
| Weighted average shares in issue (thousands) | |
| 19,192 | | |
| 16,964 | |
| Adjusted EPS (cents) | |
| 26.9 | | |
| (29.1 | ) |
| 11. | RELATED PARTY TRANSACTIONS |
Key management personnel are persons responsible for planning, directing
and controlling the activities of an entity, and include directors and executive officers of the Company. The amounts paid by the Company
for the services provided by key management personnel who are related parties have been determined by negotiation among the parties and
are reviewed and approved by the Company’s board. These transactions are in the normal course of operation.
The Company has extended the consultancy agreement with Mr. Curtis, a former
director of the Company and Chief Executive Officer, until December 31, 2025 with a monthly fee of US$12,500. During the Quarter, the
Company expensed US$37,500 (2023: US$ $37,500) in advisory service fees to Mr. Curtis.
$7,500 rent was paid to a company, of which Mr. Gapare is a director, which
supplied office accommodation to CHZ during the Quarter.
| 12. | CRITICAL ACCOUNTING ESTIMATES |
Caledonia’s accounting policies are set out in the Interim Financial
Statements which have been publicly filed on SEDAR. In preparing the Interim Financial Statements, management is required to make estimates
and assumptions that affect the amounts represented in the Interim Financial Statements and related disclosures. Use of available information
and the application of judgement are inherent in the formation of estimates. Estimates and underlying assumptions are reviewed on an on-going
basis. Revisions to accounting estimates are recognised in the period in which the estimates are revised and in any future periods affected.
Discussion of recently issued accounting pronouncements is set out in note 4 of the Interim Financial Statements. Information about critical
judgements in applying accounting policies that have the most significant effect on the amounts recognised in the Interim Financial Statements
is included in the following notes:
| i) | Indigenisation transaction |
The directors of Caledonia Holdings Zimbabwe (Private) Limited (“CHZ”),
a wholly owned subsidiary of the Company, performed an assessment, using the requirements of IFRS 10: Interim Financial Statements
(IFRS 10), and concluded that CHZ should continue to consolidate Blanket and accounted for the transaction as follows:
| · | Non-controlling interests (“NCI”) are recognised on the portion of shareholding upon which
dividends declared by Blanket accrue unconditionally to equity holders as follows: |
| (a) | 20% of the 16% shareholding of National Indigenisation and Economic Empowerment Fund (“NIEEF”);
and |
| (b) | 100% of the 10% shareholding of GCSOT. |
| · | This effectively means that NCI is recognised at Blanket at 13.2% of its net assets. |
| · | The remaining 80% of the shareholding of NIEEF is recognised as a non-controlling interest to the extent
that its attributable share of the net asset value of Blanket exceeds the balance on the facilitation loans including interest. |
The transaction with Blanket Employee Trust Services (Private) Limited
(“BETS”) is accounted for in accordance with IAS 19 Employee Benefits (profit sharing arrangement) as the ownership
of the shares does not ultimately pass to the employees. The employees are entitled to participate in 20% of the dividends accruing to
the 10% shareholding in Blanket if they are employed at the date of such distribution. To the extent that 80% of the attributable dividends
exceeds the balance on BETS’ facilitation loan they will accrue to the employees at the date of such declaration.
The Employee Trust, which owns BETS, and BETS, are structured entities
which are effectively controlled and consolidated by Blanket. Accordingly, the shares held by BETS are effectively treated as treasury
shares in Blanket and no NCI is recognised.
| ii) | Site restoration provisions |
The site restoration provision has been calculated for Blanket based on
an independent analysis of the rehabilitation costs as performed in 2023. For properties in the development phase the restoration costs
are recognised at the current estimated cost of restoration undiscounted. For properties in the production phase assumptions and estimates
are made when determining the inflationary effect on current restoration costs and the discount rate to be applied in arriving at the
present value of the provision where the time value of money effect is significant. Assumptions, based on the current economic environment,
have been made that management believes are a reasonable basis for estimating the future liability. These estimates take into account
any material changes to the assumptions that occur when reviewed by management. Estimates are reviewed annually and are based on current
regulatory requirements. Significant changes in estimates of contamination estimates, restoration standards, and techniques will result
in changes to the provision from period to period. Actual rehabilitation costs will ultimately depend on future market prices for the
rehabilitation. The final cost of the currently recognised site rehabilitation provision may be higher or lower than currently provided
for
| iii) | Exploration and evaluation (“E&E”) expenditure |
Exploration and evaluation assets are tested for impairment before the
assets are transferred to mine development, infrastructure and other assets or when an indicator of impairment is identified. Exploration
and evaluations assets are not depreciated.
The Group also makes assumptions and estimates regarding the technical
feasibility and commercial viability of the mineral project and the possible impairment of E&E assets by evaluating whether it is
likely that future economic benefits will flow to the Group, which may be based on assumptions about future events or circumstances e.g.,
such as the completion of a feasibility study indicating construction, funding and economic returns that are sufficient. Assumptions and
estimates made may change if new information becomes available. If information becomes available suggesting that the recovery of expenditures
is unlikely, the amount capitalised is written off in profit or loss in the period the new information becomes available. The recoverability
of the carrying amount of exploration and evaluation assets depends on the availability of sufficient funding to bring the properties
into commercial production, the price of the products to be recovered and the undertaking of profitable mining operations. As a result
of these uncertainties, the actual amount recovered may vary significantly from the carrying amount.
Significant estimates and assumptions are required in determining the provision
for income taxes. There are many transactions and calculations undertaken during the ordinary course of business for which the ultimate
tax determination is uncertain. Caledonia records its best estimate of the tax liability including any related interest and penalties
in the current tax provision. In addition, Caledonia applies judgement in recognising deferred tax assets relating to tax losses carried
forward to the extent that there are sufficient taxable temporary differences (deferred tax liabilities) relating to the same taxation
authority and the same taxable entity against which the unused tax losses can be utilised or sufficient estimated taxable income against
which the losses can be utilised.
| v) | Share-based payment transactions |
The fair value of the amount payable to employees in respect of share-based
awards, which are settled in cash, is recognised as an expense with a corresponding increase in liabilities, over the period over which
the employee becomes unconditionally entitled to payment. The liability is re-measured at each reporting date. Any changes in the fair
value of the liability are recognised as a personnel expense in profit or loss. Additional information about significant judgements and
estimates and the assumptions used to estimate fair value for cash settled share-based payment transactions are disclosed in note 10 to
the Interim Financial Statements.
At each reporting date, Caledonia determines if impairment indicators exist
and, if present, performs an impairment review of the non-financial assets held in Caledonia. The exercise is subject to various judgemental
decisions and estimates. Financial assets are also reviewed regularly for impairment.
Depreciation on mine development, infrastructure and other assets in the
production phase is computed on the units-of-production method over the life-of-mine based on the estimated quantities of reserves (proven
and probable) and resources (measured, indicated and inferred), which are planned to be extracted in the future from known mineral deposits.
Where items have a shorter useful life than the life-of-mine, the mine development, infrastructure and other assets are depreciated over
their useful life. Confidence in the existence, commercial viability and economical recovery of reserves and resources included in the
life-of-mine plan may be based on historical experience and available geological information. This is in addition to the drilling results
obtained by the Group and management’s knowledge of the geological setting of the surrounding areas, which would enable simulations
and extrapolations to be done with a sufficient degree of accuracy. In instances where management can demonstrate the economic recovery
of resources with a high level of confidence, such additional resources are included in the calculation of depreciation.
| viii) | Mineral reserves and resources |
Mineral reserves and resources are estimates of the amount of product that
can be economically and legally extracted. In order to calculate the reserves and resources, estimates and assumptions are required about
a range of geological, technical and economic factors, including but not limited to quantities, grades, production techniques, recovery
rates, production costs, transport costs, commodity prices and exchange rates. Estimating the quantity and grade of mineral reserves and
resources requires the size, shape and depth of orebodies to be determined by analysing geological data such as the logging and assaying
of drill samples. This process may require complex and difficult geological assumptions and calculations to interpret the data. Estimates
of mineral reserves and resources may change due to the change in economic assumptions used to estimate mineral reserves and resources
and due to additional geological data becoming available during operations.
The Group estimates its mineral reserves (proven and probable) and mineral
resources (measured, indicated and inferred) based on information compiled by a Qualified Person in terms of Canadian Securities Administrators’
National Instrument 43-101 – Standards of Disclosure for Mineral Projects (“NI 43-101”) and also the United
States Securities and Exchange Commission’s Subpart 1300 of Regulation S-K (“Subpart 1300”) relating to geological
and technical data of the size, depth, shape and grade of the ore body and suitable production techniques and recovery rates. Such an
analysis requires geological and engineering assumptions to interpret the data. These assumptions include:
| · | correlation between drill-hole intersections where multiple reefs are intersected. |
| · | continuity of mineralisation between drill-hole intersections within recognised reefs; and |
| · | appropriateness of the planned mining methods. |
The Group estimates and reports reserves and resources in accordance with
Subpart 1300 and NI 43-101 and the Canadian Institute of Mining, Metallurgy and Petroleum (the “CIM”) – CIM Definition
Standards for Mineral Resources and Mineral Reserves. Complying with the CIM code, NI 43-101 requires the use of reasonable assumptions
to calculate the recoverable resources. These assumptions include:
| · | the gold price based on current market price and the Group’s assessment of future prices; |
| · | estimated future on-mine costs, sustaining and non-sustaining capital expenditures; |
| · | dimensions and extent, determined both from drilling and mine development, of ore bodies;
and |
| · | planned future production from measured, indicated and inferred resources. |
Changes in reported mineral reserves and mineral resources may affect the
Group’s financial results and position in several ways, including the following:
| · | asset carrying values may be affected due to changes in the estimated cash flows; |
| · | depreciation and amortisation charges to profit or loss may change as these are calculated on the unit-of-production
method or where useful lives of an asset change; and |
| · | decommissioning, site restoration and environmental provisions may change in ore reserves and resources
which may affect expectations about the timing or cost of these activities. |
From December 2022 to the date of approval of the MD&A the Company
had the following put options to hedge gold price risk:
| Purchase date |
Ounces hedged |
Strike price |
Period of hedge |
| December 22, 2022 |
16,672 oz |
$1,750 |
December 2022 to May 2023 |
| May 22, 2023 |
28,000 oz |
$1,900 |
June to December 2023 |
| December 19, 2023 |
12,000 oz |
$1,950 |
January to March 2024 |
| March 7, 2024 |
12,000 oz |
$2,050 |
April to June 2024 |
| April 10, 2024 |
12,000 oz |
$2,100 |
July to September 2024 |
The put options were entered into to protect the Company against
gold prices lower than the strike price over the period hedged.
The carrying amount of financial assets as disclosed
in the statements of financial position and related notes represents the maximum credit exposure. The trade receivable predominantly relates
to gold bullion sold before the end of the Quarter and VAT receivables. The amount due in respect of bullion sales was settled at the
date of the MD&A. As discussed in section 4.10, in April 2023 the Company commenced the export and
sale of gold to an independent gold refiner outside Zimbabwe, which makes payment for the gold received directly into Caledonia’s
bank accounts in Zimbabwe. This mechanism means that the Company is no longer exposed to credit risk from FGR in respect of the US Dollar
component of its sales.
Certain of the VAT receivables were outside the agreed terms of such refunds
as at March 31, 2024; engagements are underway with the Zimbabwe Revenue Authority to recover such amounts by way of cash receipts or
offsets against other amounts of tax payable.
All trade payables and the bank overdrafts have
maturity dates that are repayable as set out in section 7.
A proportion of Caledonia’s assets, financial instruments and transactions
are denominated in currencies other than the US Dollar. The financial results and financial position of Caledonia are reported in US Dollars
in the Interim Financial Statements.
The fluctuation of the US Dollar in relation to other currencies will consequently
have an impact upon the profitability of Caledonia and may also affect the value of Caledonia’s assets and liabilities and the amount
of shareholders’ equity.
As discussed in section 4.10 of
this MD&A, the RTGS$ was subject to variations in the exchange rate against the US Dollar, and the same is now the case for the replacement
for the RTGS$ being the ZiG. This may result in Blanket’s assets, liabilities and transactions that are denominated in ZiG being
subject to further fluctuations in the exchange rate between RTGS$ and US Dollars. In addition, the Company may be subject to fluctuations
in the exchange rate between the South African Rand and the US Dollar in respect of cash that is held in Rands in South Africa.
Interest rate risk is the risk borne by an interest-bearing asset or liability
due to fluctuations in interest rates. Unless otherwise noted, it is the opinion of management that Caledonia is not exposed to significant
interest rate risk as it has limited debt financing. Caledonia’s cash and cash equivalents include highly liquid investments that
earn interest at market rates. Caledonia’s policy focuses on preservation of capital and limits the investing of excess funds to
liquid term deposits in high credit quality financial institutions.
| Declaration date |
cents per share |
|
| January 1, 2021 |
11.0 |
|
| April 2, 2021 |
12.0 |
|
| July 2, 2021 |
13.0 |
|
| October 1, 2021 |
14.0 |
|
| December 31, 2021 |
14.0 |
|
| April 1, 2022 |
14.0 |
|
| July 1, 2022 |
14.0 |
|
| September 30, 2022 |
14.0 |
|
| December 30, 2022 |
14.0 |
|
| April 3, 2023 |
14.0 |
|
| June 29, 2023 |
14.0 |
|
| September 28, 2023 |
14.0 |
|
| January 2, 2024 |
14.0 |
|
| March 27, 2024 |
14.0 |
|
The board will consider the continuation of the dividend as appropriate
in line with other investment opportunities and its prudent approach to risk management including Blanket maintaining a reasonable level
of production; receiving payment in full and on-time for all gold sales; being able to make the necessary local and international payments
and being able to replenish its supplies of consumables and other items.
Mr. Roets stepped down from his role as Chief Operating Officer with
effect from February 29, 2024. Mr. Roets remained a director of the Company and various subsidiaries until February
29, 2024. Mr Mufara has been appointed as Chief Operating Officer from May 1, 2024.
On March 18, 2024 Caledonia announced that Tariro Gadzikwa had joined the
board of directors as an independent non-executive director with effect from March 15, 2024. It also announced that Steve Curtis,
who retired as Chief Executive Officer of the Company in June 2022 and remained on the board as a director in a non-executive
capacity since then, had decided to step down from the board and as such would not be seeking re-appointment as a director at the next
annual general meeting. He therefore left the board with effect from May 7, 2024, being the next annual general meeting of the Company.
| 16. | SECURITIES OUTSTANDING |
At May 9, 2024, being the last day practicable prior to the publication
of this MD&A, Caledonia had 19,194,860 common shares issued and the following outstanding options to purchase common shares (“Options”)
granted in equal amounts to each of the employees of a PR consultancy to the Company 3PPB LLC being P Chidley and P Durham:
| Number of Options |
Exercise Price |
Expiry Date |
|
| |
|
|
|
| 10,000 |
CAD11.50 |
25-Aug-24 |
|
| 10,000 |
USD 9.49 |
30-Sep-29 |
|
| 20,000 |
|
|
|
The OEICP allows that the number of shares
reserved for issuance to participants under the OEICP, together with shares reserved for issue under any other share compensation
arrangements of the Company, shall not exceed the number which represents 10% of the issued and outstanding
shares from time to time.
The business of Caledonia contains significant risk due to the nature of
mining, exploration and development activities. Caledonia’s business contains significant additional risks due to the jurisdictions
in which it operates and the nature of mining, exploration and development. Included in the risk factors below are details of how management
seeks to mitigate the risks where this is possible.
| · | Availability of foreign currency: The Company needs access to foreign currency in Zimbabwe so that
it can pay for imported goods and equipment and remit funds to Group companies outside Zimbabwe. At prevailing gold prices and the current
rate of production the Company has access to sufficient foreign currency to continue normal mining operations and to fully implement its
investment plan as scheduled. No assurance can be given that sufficient foreign currency will continue to be available. |
| · | Liquidity risk: Caledonia currently has sufficient cash and operating resources, access to funding
and continues to generate sufficient cash to cover all its anticipated investment needs. |
| · | Exploration risk: The Company needs to identify new resources to replace ore which has been depleted
by mining activities and to commence new projects. No assurance can be given that exploration will be successful in identifying sufficient
mineral resources of an adequate grade and suitable metallurgical characteristics that are suitable for further development or production. |
| · | Development risk: The Company is engaged in projects. Construction and development of projects are
subject to numerous risks including: obtaining equipment, permits and services; changes in regulations; currency rate changes; labour
shortages; fluctuations in metal prices and the loss of community support. There can be no assurance that construction will commence or
continue in accordance with the current expectations or at all. |
| · | Production estimates: Estimates for future production are based on mining plans and are subject
to change. Production estimates are subject to risk and no assurance can be given that future production estimates will be achieved. Actual
production may vary from estimated production for a variety of reasons including un-anticipated variations in grades, mined tonnages and
geological conditions, accident and equipment breakdown, changes in metal prices and the cost and supply of inputs and changes to government
regulations. |
| · | Mineral rights: The Company’s existing mining lease, claims, licences, and permits are in
good standing. The Company must pay fees etc. to maintain its lease, claims and licences. |
| · | Metal prices: The Company’s operations and exploration and development projects are heavily
influenced by the price of gold, which is particularly subject to fluctuation. From time to time the Company enters into arrangements
to minimise this risk either by using cap-and-collar hedges or by purchasing out-of-the-money put options. These arrangements are detailed
in section 13 of this MD&A and note 14 of the Interim Financial Statements. Management regularly reviews future cash flow forecasts
in the context of the prevailing gold price and likely downside scenarios for future gold prices. |
| · | Increasing input costs: Mining companies generally have experienced higher costs of steel, reagents,
labour and electricity and from local and national government for levies, fees, royalties and other direct and indirect taxes. |
| · | Illegal mining: In previous years there were incidences of illegal mining activities on properties
controlled by Blanket which resulted in increased security costs and an increased risk of theft and damage to equipment. Blanket has received
adequate support and assistance from the Zimbabwean police in investigating such cases. Those properties most at risk from such activity
had been sold. With new mining areas having been acquired by the Group the incidence and possibility of illegal mining has increased,
and there have been minor instances of illegal mining at Bilboes and Motapa. The Group is receiving adequate support and assistance from
the Zimbabwean police. |
| · | Electricity supply: Zimbabwe produces and imports less electricity than it requires and has insufficient
funds to adequately maintain or upgrade its distribution infrastructure. This has resulted in frequent interruptions to the power supply
at Blanket. Blanket has addressed the issue of interrupted power supply by installing stand-by generators and constructing a solar plant
which provided approximately 20% of Blanket’s power requirements for this quarter. |
| · | Water supply: Blanket uses water in the metallurgical process. This is obtained by recirculation
of underground water sources in the mine and from the nearby dam. Blanket is situated in a semi-arid area and rainfall typically occurs
only in the period November to February. The most recent rainy season has been below average, but management believes current water recirculation
and the current water levels in the Blanket dam are sufficient to maintain normal operations. Management has implemented measures to reduce
water consumption and to establish alternative sources of supply that are yielding good results. |
| · | Succession planning: The limited availability of mining and other technical skills and experience
in Zimbabwe and the difficulty of attracting appropriately skilled employees to Zimbabwe creates a risk that appropriate skills may not
be available if, for whatever reason, the current skills base at Blanket is depleted. The Caledonia and Blanket management teams have
been augmented so that, if required, it could provide appropriate support to Blanket if this is required. |
| · | Zimbabwe country risk: The commercial environment in which the Company operates is unpredictable.
Potential risks may arise from: unforeseen changes in the legal and regulatory framework which means that laws may change, may not be
enforced, or judgements may not be upheld; restrictions on the movement of currency and the availability of foreign currency at a realistic
exchange rate to make payments from Zimbabwe which may result in continued foreign exchange losses being realised and/or local currency
being used to procure goods and services at elevated prices in USD terms; risks relating to possible corruption, bribery, civil disorder,
expropriation or nationalisation; risks relating to restrictions on access to assets and the risk that the Zimbabwe Government is unable
to pay its liabilities to Blanket, including amounts due in respect of VAT refunds. Management believes that it has minimised such risks
by complying fully with all relevant legislation, by obtaining all relevant regulatory permissions and approvals and by regular and proactive
engagement with the relevant authorities. |
| · | Gold marketing arrangements: In terms of regulations introduced by the Zimbabwean Ministry of Finance
in January 2014, all gold produced in Zimbabwe must be sold to FGR, a company which is owned by the RBZ. From April 2023, the Company
has implemented a mechanism, with the approval of the Zimbabwean authorities, whereby it sells 75% of its ounces, after deduction of royalty
and FGR costs, to a refiner outside of Zimbabwe. The first shipments of the sale of gold in terms of these mechanisms was successfully
completed in April 2023 and this system has worked well. |
| · | Other gold industry risks: On June 27, 2023 the U.S. Department of State together with other U.S.
government agencies issued an advisory in light of reports related to the role of illicit actors in the gold trade to (i) highlight the
opportunities and specific risks raised by the gold trade across sub-Saharan Africa and (ii) encourage industry participants to adopt
and apply strengthened due diligence practices to ensure that such malign actors are unable to exploit and benefit from the sector, which
remains essential to the livelihoods of millions of people across sub-Saharan Africa. Caledonia acknowledges and concurs with the U.S.
Department of States’ warning that without adequate due diligence and appropriate mitigating measures, an industry participant may
inadvertently contribute to one or more of these risks, including conflict and terror financing, money laundering activities, sanctions
evasion, human rights and labour rights abuses and environmental degradation. Caledonia has robust policies in place to counter
such risks including, amongst other things: a Code of Business Conduct, Ethics and Anti-Bribery Policy, a Human Rights Policy and Customer
AML/KYC Policy, and it encourages whistleblowing and grievance reporting in order to monitor compliance. Caledonia performs enhanced
due diligence on significant suppliers and other counterparties (including, but not limited to, sanctions and political exposure checks),
has established new and robust routes to market for its gold production (none of which, for the avoidance of doubt, is artisanal) and
has scrutinised the new refineries to which it now sells its gold. The Company reports its environmental, social and governance
(“ESG”) performance annually, disclosing key environmental data, supports artisanal miners in the form of tributing of gold
claims (as well as the local community generally) and has adopted best practice in the construction of its new TSF. For more information
in all of these areas, please refer to Caledonia’s ESG reports. |
| · | South Africa: the company has approximately 28 employees located in South Africa who provide technical
and procurement services to Blanket; the group accounting function is also based in Johannesburg and a significant proportion of the consumables,
capital equipment and specialist technical services that Blanket requires are procured in South Africa. South Africa will hold presidential,
national and local elections in May 2024 which may give rise to disruption to normal commercial activity. Management is exploring mechanisms
to reduce this exposure for example by developing alternative procurement and logistics routes. |
| 18. | FORWARD LOOKING STATEMENTS |
Information and statements contained in this MD&A that are not historical
facts are “forward-looking information” within the meaning of applicable securities legislation that involve risks and uncertainties
relating, but not limited to, Caledonia’s current expectations, intentions, plans, and beliefs. Forward-looking information can
often be identified by forward-looking words such as “anticipate”, “believe”, “expect”, “goal”,
“plan”, “target”, “intend”, “estimate”, “could”, “should”, “may”
and “will” or the negative of these terms or similar words suggesting future outcomes, or other expectations, beliefs, plans,
objectives, assumptions, intentions or statements about future events or performance. Examples of forward-looking information in this
MD&A include: implementation schedules for, and other uncertainties inherent in, the Central Shaft project; production guidance; estimates
of future/targeted production rates; planned mill capacity increases; estimates of future metallurgical recovery rates and the ability
to maintain high metallurgical recovery rates; timing of commencement of operations; plans and timing regarding further exploration, drilling
and development; the prospective nature of exploration and development targets; the ability to upgrade and convert mineral resources to
mineral reserves; capital and operating costs; our intentions with respect to financial position and third party financing; future dividend
payments; and the proposed sale of the solar plant. This forward-looking information is based, in part, on assumptions and factors that
may change or prove to be incorrect, thus causing actual results, performance or achievements to be materially different from those expressed
or implied by forward-looking information. Such factors and assumptions include, but are not limited to: failure to establish estimated
resources and reserves, the grade and recovery of ore which is mined varying from estimates, success of future exploration and drilling
programs, reliability of drilling, sampling and assay data, assumptions regarding the representativeness of mineralisation being inaccurate,
success of planned metallurgical test-work, capital and operating costs varying significantly from estimates, delays in obtaining or failures
to obtain required governmental, environmental or other project approvals, changes in government regulations, legislation and rates of
taxation, inflation, changes in exchange rates, fluctuations in commodity prices, delays in the development of projects and other factors.
Security holders, potential security holders and prospective investors
should be aware that these statements are subject to known and unknown risks, uncertainties and other factors that could cause actual
results to differ materially from those suggested by the forward-looking statements. Such factors include, but are not limited to: risks
relating to estimates of mineral reserves and mineral resources proving to be inaccurate, fluctuations in gold price and payment terms
for gold sold to FGR, risks and hazards associated with the business of mineral exploration, development and mining (including environmental
hazards, industrial accidents, unusual or unexpected geological or structural formations, pressures, power outages, fire, explosions,
landslides, cave-ins and flooding), risks relating to the credit worthiness or financial condition of suppliers, refiners and other parties
with whom the Company does business, inadequate insurance, or inability to obtain insurance, to cover these risks and hazards, employee
relations, relationships with and claims by local communities and indigenous populations, political risk, risks related to natural disasters,
terrorism, civil unrest, public health concerns (including health epidemics or outbreaks of communicable diseases such as the coronavirus
(COVID-19)), availability and increasing costs associated with mining inputs and labour, the speculative nature of mineral exploration
and development, including the risks of obtaining or maintaining necessary licenses and permits, diminishing quantities or grades of mineral
reserves as mining occurs, global financial condition, the actual results of current exploration activities, changes to conclusions of
economic evaluations, and changes in project parametres to deal with un-anticipated economic or other factors, risks of increased capital
and operating costs, environmental, safety or regulatory risks, expropriation, the Company’s title to properties including ownership
thereof, increased competition in the mining industry for properties, equipment, qualified personnel and their costs, risks relating to
the uncertainty of timing of events including targeted production rate increase and currency fluctuations. Security holders, potential
security holders and prospective investors are cautioned not to place undue reliance on forward-looking information. By its nature, forward-looking
information involves numerous assumptions, inherent risks and uncertainties, both general and specific, that contribute to the possibility
that the predictions, forecasts, projections and various future events will not occur. Caledonia reviews forward-looking information for
the purposes of preparing each MD&A; however, Caledonia undertakes no obligation to update publicly or otherwise revise any forward-looking
information whether as a result of new information, future events or other such factors which affect this information, except as required
by law.
Reserves and resources estimates contained in this MD&A may have been
prepared in accordance with NI 43-101 and the Canadian Institute of Mining, Metallurgy and Petroleum Classification System; or in accordance
with the requirements of 1300 S-K adopted by the SEC. These standards differ and therefore information contained in this MD&A may
not be comparable to similar information disclosed by U.S. companies or by Candian companies, respectively. The requirements of NI 43-101
for identification of reserves and resources are also not the same as those of 1300 S-K, and any reserves or resources reported in compliance
with NI 43-101 may not qualify as “reserves” or “resources” under 1300 S-K, and vice versa. Accordingly, the mineral
reserves and mineral resources information set forth herein may not be comparable to information made public by companies that report
in accordance with United States standards or by Candian companies, respectively.
The Company has established and maintains disclosure controls and procedures
(“DC&P”) designed to provide reasonable assurance that material information relating to the Company is made known to the
Chief Executive Officer and the Chief Financial Officer by others, particularly during the period in which annual filings are being prepared,
and that information required to be disclosed in the Company’s annual filings, interim filings or other reports filed or submitted
by it under securities legislation is recorded, processed, summarised and reported within the time periods specified by such securities
legislation.
The Company’s management, along with the participation of the Chief
Executive Officer and the Chief Financial Officer, have evaluated the effectiveness of the Company’s DC&P as of March 31, 2024.
Based on that evaluation, the Chief Executive Officer and the Chief Financial Officer have concluded that, at March 31, 2024, the Company’s
DC&P were effective.
The Company also maintains a system of internal controls over financial
reporting (“ICFR”) designed under the supervision of the Company’s Chief Executive Officer and Chief Financial Officer
to provide reasonable assurance regarding the reliability of financial reporting and the preparation of financial statements for external
purposes in accordance with IFRS; however, due to inherent limitations, ICFR may not prevent or detect all misstatements and fraud. The
board of directors approves the financial statements and ensures that management discharges its financial responsibilities. The Audit
Committee, which is composed of independent directors, meets periodically with management and auditors to review financial reporting and
control matters and reviews the financial statements and recommends them for approval to the board of directors.
The Company’s management, including the Chief Executive Officer and
the Chief Financial Officer, is responsible for establishing and maintaining adequate ICFR and evaluating the effectiveness of the Company’s
ICFR as at each fiscal year end. Management has used the 2013 Internal Control–Integrated Framework from the Committee of Sponsoring
Organizations of the Treadway Commission (the “COSO”) to evaluate the effectiveness of the Company’s ICFR at March 31,
2024. Based on this evaluation, the Chief Executive Officer and the Chief Financial Officer have concluded that at March 31, 2024, the
Company’s ICFR was effective.
There have been no changes in the Company’s ICFR during the period
ended March 31, 2024 that have materially affected, or are reasonably likely to materially affect, the Company’s ICFR.
Mr. Harvey (NHD Economic Geology, MGSSA, MAIG) is the Company’s qualified
person as defined by Subpart 1300 and NI 43-101. Mr. Harvey is responsible for the technical information provided in this MD&A except
where otherwise stated. Mr. Harvey has reviewed the scientific and technical information included in this document and has approved the
disclosure of this information for the purposes of this MD&A.
45
Exhibit 99.3
Form 52-109F2
Certification of Interim Filings
Full Certificate
I, John Mark Learmonth, Chief Executive Officer of Caledonia Mining Corporation Plc,
certify the following:
| 1. | Review: I have reviewed the interim financial report and interim MD&A (together, the “interim
filings”) of Caledonia Mining Corporation (the “issuer”) for the quarter ended March 31, 2024. |
| 2. | No misrepresentations: Based on my knowledge, having exercised reasonable diligence, the interim filings do not contain any
untrue statement of a material fact or omit to state a material fact required to be stated or that is necessary to make a statement not
misleading in light of the circumstances under which it was made, with respect to the period covered by the interim filings. |
| 3. | Fair presentation: Based on my knowledge, having exercised reasonable diligence, the interim financial report together with
the other financial information included in the interim filings fairly present in all material respects the financial condition, financial
performance and cash flows of the issuer, as of the date of and for the periods presented in the interim filings. |
| 4. | Responsibility: The issuer’s other certifying officer and I are responsible for establishing and maintaining disclosure
controls and procedures (DC&P) and internal control over financial reporting (ICFR), as those terms are defined in National Instrument
52-109 Certification of Disclosure in Issuers’ Annual and Interim Filings, for the issuer. |
| 5. | Design: Subject to the limitations, if any, described in paragraphs 5.2 and 5.3, the issuer’s other certifying officer
and I have, as at the end of the period covered by the interim filings |
| (a) | designed DC&P, or caused it to be designed under our supervision, to provide reasonable assurance that |
| (i) | material information relating to the issuer is made known to us by others, particularly during the period in which the interim filings
are being prepared; and |
| (ii) | information required to be disclosed by the issuer in its annual filings, interim filings or other reports filed or submitted by it
under securities legislation is recorded, processed, summarized and reported within the time periods specified in securities legislation;
and |
| (b) | designed ICFR, or caused it to be designed under our supervision, to provide reasonable assurance regarding the reliability of financial
reporting and the preparation of financial statements for external purposes in accordance with the issuer’s GAAP. |
| 5.1 | Control framework: The control framework the issuer’s other certifying officer and I used
to design the issuer’s ICFR is the Internal Control – Integrated Framework – published by the Committee of Sponsoring
Organizations of the Treadway Commission (COSO). |
| 6. | Reporting changes in ICFR: The issuer has disclosed in its interim MD&A any change in the
issuer’s ICFR that occurred during the period beginning on January 1, 2024 and ended on March 31, 2024 that has materially
affected, or is reasonably likely to materially affect, the issuer’s ICFR. |
Date: May 13, 2024
John Mark Learmonth
Chief Executive Officer
2
Exhibit 99.4
Form 52-109F2
Certification of Interim Filings
Full Certificate
I, Chester Goodburn, Chief Financial Officer of Caledonia Mining Corporation Plc, certify
the following:
| 1. | Review: I have reviewed the interim financial report and interim MD&A (together, the “interim
filings”) of Caledonia Mining Corporation (the “issuer”) for the quarter ended March 31, 2024. |
| 2. | No misrepresentations: Based on my knowledge, having exercised reasonable diligence, the interim filings do not contain any
untrue statement of a material fact or omit to state a material fact required to be stated or that is necessary to make a statement not
misleading in light of the circumstances under which it was made, with respect to the period covered by the interim filings. |
| 3. | Fair presentation: Based on my knowledge, having exercised reasonable diligence, the interim financial report together with
the other financial information included in the interim filings fairly present in all material respects the financial condition, financial
performance and cash flows of the issuer, as of the date of and for the periods presented in the interim filings. |
| 4. | Responsibility: The issuer’s other certifying officer and I are responsible for establishing and maintaining disclosure
controls and procedures (DC&P) and internal control over financial reporting (ICFR), as those terms are defined in National Instrument
52-109 Certification of Disclosure in Issuers’ Annual and Interim Filings, for the issuer. |
| 5. | Design: Subject to the limitations, if any, described in paragraphs 5.2 and 5.3, the issuer’s other certifying officer
and I have, as at the end of the period covered by the interim filings |
| (a) | designed DC&P, or caused it to be designed under our supervision, to provide reasonable assurance that |
| (i) | material information relating to the issuer is made known to us by others, particularly during the period in which the interim filings
are being prepared; and |
| (ii) | information required to be disclosed by the issuer in its annual filings, interim filings or other reports filed or submitted by it
under securities legislation is recorded, processed, summarized and reported within the time periods specified in securities legislation;
and |
| (b) | designed ICFR, or caused it to be designed under our supervision, to provide reasonable assurance regarding the reliability of financial
reporting and the preparation of financial statements for external purposes in accordance with the issuer’s GAAP. |
| 5.1 | Control framework: The control framework the issuer’s other certifying officer and I used
to design the issuer’s ICFR is the Internal Control – Integrated Framework – published by the Committee of Sponsoring
Organizations of the Treadway Commission (COSO). |
| 6. | Reporting changes in ICFR: The issuer has disclosed in its interim MD&A any change in the
issuer’s ICFR that occurred during the period beginning on January 1, 2024 and ended on March 31, 2024 that has materially
affected, or is reasonably likely to materially affect, the issuer’s ICFR. |
Date: May 13, 2024
Chester Goodburn
Chief Financial Officer
2
Caledonia Mining (AMEX:CMCL)
Historical Stock Chart
From Sep 2024 to Oct 2024

Caledonia Mining (AMEX:CMCL)
Historical Stock Chart
From Oct 2023 to Oct 2024
