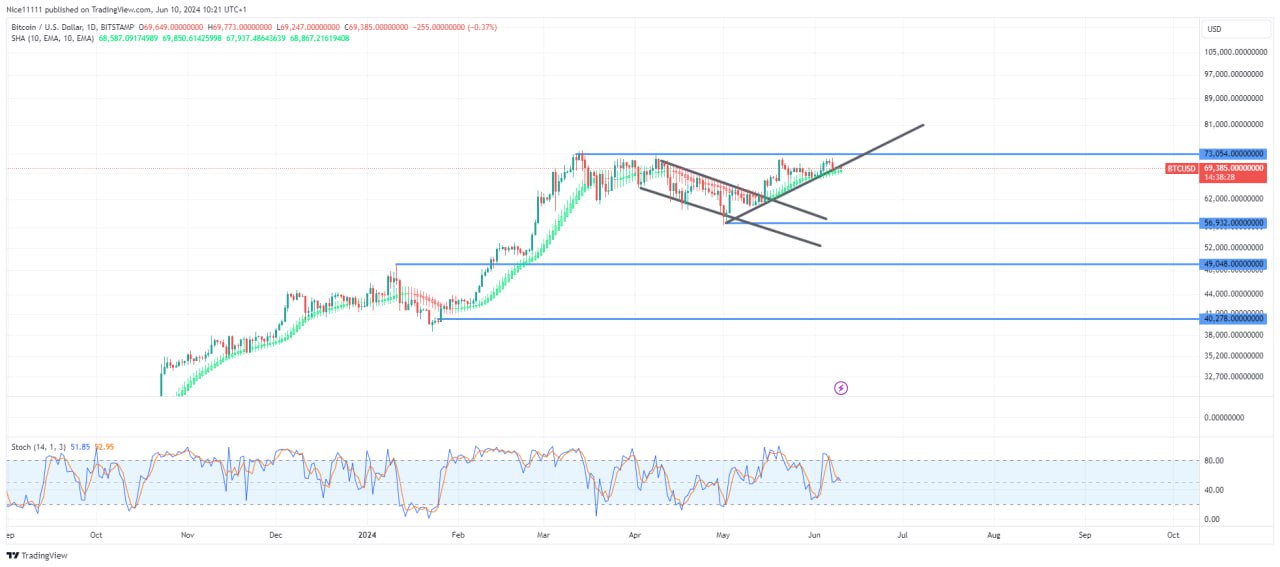
Shortly after Bitcoin reached its peak price of $73,054, the market formed a triple-top pattern, with each successive peak slightly lower than the previous one. This pattern indicated a clear sign of market weakness.
During March and April, Bitcoin experienced a correction phase characterized by a narrow bearish parallel channel. In May, the price broke out of this parallel channel, forming higher lows that established a supporting trendline, guiding future price pullbacks. Currently, the price is ascending toward its all-time high.
Key Levels:
- Demand Levels: $56,932.0, $49,048.0, $40,278.0
- Supply Levels: $73,054.0, $80,000.0, $100,000.0
 Technical Indicators:
The daily candles falling into the Smoothed Heikin Ashi Candles in March indicated a market correction. The last occurrence of a similar scenario was in January. February showcased a robust bullish trend, culminating in Bitcoin’s current all-time high price. Throughout the correction phase, the Smoothed Heikin Ashi Candles dominated the daily candles until May. Upon the breakout, the Heikin Ashi Candles shifted to a green hue.
Although a breakout has been established, it remains uncertain whether the correction phase has concluded, as there is no significant change in the volatility of the price action. The price remains below the all-time high, and an impulsive price expansion is anticipated to push Bitcoin to new heights, as recent price movements have shown signs of lethargy.
Learn from market wizards: Books to take your trading to the next level