Ethereum’s bullish phase began before February, with February and early March seeing a clear increase in market volatility. During this period, ETH’s upward trend became notably steeper. Following this surge, a correction phase, characterized by lower lows and highs, formed a falling wedge pattern. The market tested the demand level of $2,890.00, leading to a breakout from this wedge.
Since the breakout, the price has stabilized around $3,726.80, indicating a sideways movement that can be interpreted as a consolidation phase. This correction is a precursor to the next expansion, anticipated to break the previous swing high of $4,085.00.
Ethereum Key Levels
- Demand Levels: $2,890.00, $2,590.00, $2,292.30
- Supply Levels: $3,726.80, $4,085.00, $4,100.00
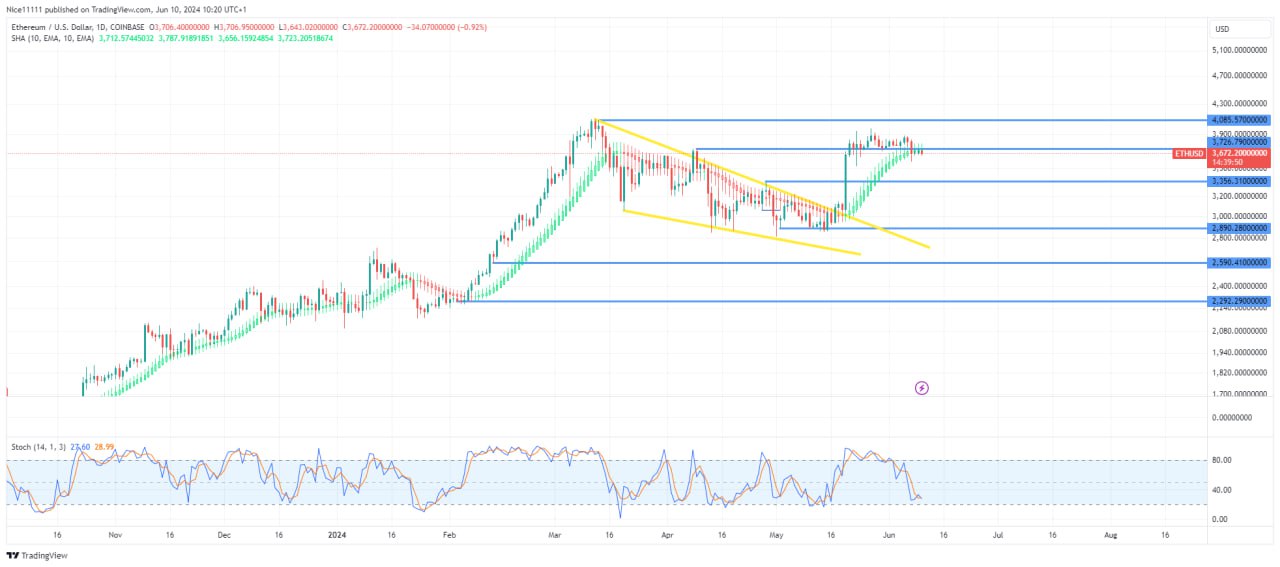
What Are the Indicators Saying?
The correction phase initiated in March was evident as daily candles dipped below the Smoothed Heikin Ashi Candles. Throughout the correction, these candles maintained a red hue, aligned with the resistance border of the falling wedge. An oversold signal from the Stochastic indicator preceded the bullish breakout from this wedge. Currently, the daily candles are testing the Smoothed Heikin Ashi Candles as the Stochastic nears the oversold region, suggesting that a bullish expansion is imminent. The price is projected to surpass $4,085.00 in the forthcoming bullish phase.
Learn from market wizards: Books to take your trading to the next level