TIDMPET
RNS Number : 2882A
Petrel Resources PLC
28 September 2015
28(th) September 2015
Petrel Resources plc
("Petrel" or "the Company")
Interim Statement for the period ended 30 June 2015
In a world where listed junior oil companies have seen their
share prices hammered Petrel is stable with cash and ongoing
activities. In two current projects, Offshore Ireland and in Iraq
we are fully carried by our partners so there is negligible cost to
Petrel. In our Ghanaian venture we await the outcome of a licence
application so costs are low. We have submitted a strong
application for licences in the recent Irish Offshore licencing
round and are hopeful of success. On current plans we are funded
through 2017.
Offshore Ireland
Offshore Ireland is our main focus of activity. We have a joint
venture with Woodside Energy of Australia who farmed into our two
offshore Irish blocks, Frontier Exploration Licences 3/14 and 4/14
in the Porcupine Basin, covering 1,050 sq km with plays in about
600-800 m of water. Petrel holds a 15% interest and is
substantially carried by Woodside through the initial exploration
programmes. Significant work has been done and Woodside is ready to
undertake a 3D seismic acquisition programme which will better
identify and outline potential hydrocarbon bearing structures. The
programme is expected to be undertaken in 2016. The targets are
large.
As announced, Petrel has, in recent days, applied for 3 packages
of acreage in the Irish Atlantic Margin Licensing Round which
closed in mid-September 2015. Our experienced geological team used
our own data bank plus currently available data to identify
priority areas. We anticipate early discussions with the
authorities on our proposals and are confident that our record to
date, both in developing new plays and attracting world-class
partners, will strengthen our applications. We are hopeful of an
award.
Ghana
In Ghana we hold a 30% interest in Pan Andean Resources Limited
(Clontarf 60%, local interest 10%). The current position is that
the Ghanaian National Petroleum Commission are actively considering
the current re-application by Pan Andean Resources Limited over
circa 1,500 sq km plus of the shallow-to-medium depth part of the
prospective Tano Basin. A year ago we withdrew a court case to
force the Ghanaian authorities to process our 2010 application.
There was a dispute over part of what we believed to be our
acreage. In discussions with the Ghanaian authorities, we
eventually agreed new co-ordinates and a speedy ratification
process. Little has happened so far. We threatened to recommence
court proceedings. Once more a compromise was agreed under which
the local company, Pan Andean, agreed, without prejudice, to
re-submit a fresh proposal over acreage defined by the revised
coordinates. This has been done and that re-application is now
being considered. We were reluctant to re-apply as it might weaken
our strong legal position. We took advice and lodged a new
application. We are told that this is under active
consideration.
Iraq
Our third theatre of activities is Iraq, where we have had a
presence for 18 years. The original Petrel interest was in Block 6
in the Western Desert between Baghdad and the Jordanian border.
That is, and is likely to remain, a no-go area.
Two years ago we established a close relationship with a
well-connected Iraqi family by acquiring a 20 per cent interest in
Amira Hydrocarbons Wasit. Amira has a joint venture with a Canadian
company, Oryx Petroleum, in the Wasit province. We bought, for cash
and shares, an effective 5% free carry through exploration on any
Oryx activities in Wasit. The acquisition refocused our efforts on
one of the world's premier hydrocarbon basins and provides our
shareholders with greater exposure to the world class hydrocarbon
potential in Iraq. The Wasit Governorate is a Shia controlled
province between Baghdad and the Iranian border, and is relatively
stable. Like most of Iraq, it is very prospective for oil yet only
lightly explored. Our belief was, and is, that a federal system
would evolve in Iraq. This belief was based on events in Kurdistan.
Should this happen, governors can sanction exploration in their own
provinces. To date this has not happened. The shares in Petrel,
given to Amira, will be extinguished if exploration does not happen
by 2018. Nothing is happening at present. Petrel incurs no
costs.
Future
The immediate future for Petrel is tied to Offshore Ireland. Our
current partner is likely to be active in the Atlantic over the
next two years. We are hopeful of obtaining additional acreage in
the recent Irish Atlantic licensing round.
There will be developments in Ghana in the coming months but,
based on experience, it is very difficult to predict.
Overriding all of the above is the price of oil. Should it stay
weak or even fall further then exploration will fade away, only to
return stronger when prices rise. Petrel has the resources to
operate through this cycle.
John Teeling
Chairman
25(th) September 2015
Enquiries:
Petrel Resources Plc
John Teeling, Chairman +353 (0) 1 833 2833
David Horgan, Director
Nominated Adviser and Broker
Northland Capital Partners Limited
Edward Hutton / Gerry Beaney +44 (0)20 7382 1100
John Howes/Mark Treharne (Broking)
Public Relations
Blytheweigh +44 (0)20 7138 3204
Tim Blythe +44 (0) 7816 924 626
Camilla Horsfall +44 (0) 7871 841 793
PSG Plus
Aoife Ross +353 (0) 1 661 4055
Alan Tyrrell +353 (0) 1 661 4055
www.petrelresources.com
                                                        Petrel Resources plc
                                                  Financial Information (Unaudited)

 CONDENSED CONSOLIDATED STATEMENT OF COMPREHENSIVE INCOME
                                                                                       Six Months Ended                   Year Ended
                                                                                     30 June 15         30 June 14         31 Dec 14
                                                                                      unaudited          unaudited           audited
                                                                                        EUR'000            EUR'000           EUR'000
 CONTINUING OPERATIONS
 Administrative
  expenses                                                                                (148)              (229)             (431)
 Impairment of evaluation and
  exploration assets                                                                          -                  -           (2,529)
                                                                           --------------------  -----------------  ----------------
 OPERATING
  LOSS                                                                                    (148)              (229)           (2,960)

 Investment
  revenue                                                                                     1                  1                 1
                                                                           --------------------  -----------------  ----------------
 LOSS BEFORE TAXATION                                                                     (147)              (228)           (2,959)

 Income tax
 expense                                                                                      -                  -                 -
                                                                           --------------------  -----------------  ----------------
 LOSS FOR THE PERIOD                                                                      (147)              (228)           (2,959)

 Items that are or may be reclassified subsequently to profit or loss
 Exchange
  differences                                                                               237                 40               501

 TOTAL COMPREHENSIVE PROFIT/(LOSS) FOR THE PERIOD                                            90              (188)           (2,458)
                                                                           ====================  =================  ================

 LOSS PER SHARE - basic and
  diluted                                                                               (0.15c)            (0.23c)           (2.97c)
                                                                           ====================  =================  ================


 CONDENSED CONSOLIDATED BALANCE SHEET                                                30 June 15         30 June 14         31 Dec 14
                                                                                      unaudited          unaudited           audited
 ASSETS:                                                                                EUR'000            EUR'000           EUR'000
 NON-CURRENT ASSETS
 Financial
  assets                                                                                  4,211              4,211             4,211
 Intangible
  assets                                                                                  1,767              3,546             1,539
(MORE TO FOLLOW) Dow Jones Newswires
September 28, 2015 02:00 ET (06:00 GMT)
-------------------- ----------------- ----------------
5,978 7,757 5,750
-------------------- ----------------- ----------------
CURRENT
ASSETS
Trade and other
receivables 46 13 45
Cash and cash
equivalents 1,166 1,671 1,331
-------------------- ----------------- ----------------
1,212 1,684 1,376
TOTAL ASSETS 7,190 9,441 7,126
-------------------- ----------------- ----------------
CURRENT
LIABILITIES
Trade and other
payables (281) (352) (307)
-------------------- ----------------- ----------------
(281) (352) (307)
-------------------- ----------------- ----------------
NET CURRENT ASSETS 931 1,332 1,069
NET ASSETS 6,909 9,089 6,819
==================== ================= ================
EQUITY
Share
capital 1,246 1,246 1,246
Share
premium 21,416 21,416 21,416
Reserves (15,753) (13,573) (15,843)
-------------------- ----------------- ----------------
TOTAL EQUITY 6,909 9,089 6,819
==================== ================= ================
CONDENSED CONSOLIDATED STATEMENT OF CHANGES IN EQUITY
Capital Share based
Share Share Conversion Payment Translation Retained Total
Capital Premium Reserves Reserves Reserves Losses Equity
EUR'000 EUR'000 EUR'000 EUR'000 EUR'000 EUR'000 EUR'000
As at 1
January
2014 1,246 21,416 8 26 (152) (13,267) 9,277
Total comprehensive
loss - 40 (228) (188)
---------- ----------- ------------------- -------------------- ----------------- ----------------
As at 30
June 2014 1,246 21,416 8 26 (112) (13,495) 9,089
Total comprehensive
loss - 461 (2,731) (2,270)
---------- ----------- ------------------- -------------------- ----------------- ----------------
At 31
December 14 1,246 21,416 8 26 349 (16,226) 6,819
Total comprehensive
income - 237 (147) 90
----------- ------------------- --------------------
As at 30
June 2015 1,246 21,416 8 26 586 (16,373) 6,909
======== ========== =========== =================== ==================== ================= ================
CONDENSED CONSOLIDATED CASH FLOW Six Months Ended Year Ended
30 June 15 30 June 14 31 Dec 14
unaudited unaudited audited
EUR'000 EUR'000 EUR'000
CASH FLOW FROM OPERATING ACTIVITIES
Loss for the
period (147) (228) (2,959)
Impairment
charge - - 2,529
Investment revenue recognised in loss (1) (1) (1)
-------------------- ----------------- ----------------
(148) (229) (431)
Movements in Working
Capital (49) (38) (227)
-------------------- ----------------- ----------------
CASH USED IN
OPERATIONS (197) (267) (658)
Investment
revenue 1 1 1
-------------------- ----------------- ----------------
NET CASH USED IN OPERATING ACTIVITIES (196) (266) (657)
-------------------- ----------------- ----------------
INVESTING
ACTIVITIES
Payments for exploration and
evaluation assets (74) (447) (575)
Receipts for exploration and
evaluation assets - 945 945
-------------------- ----------------- ----------------
NET CASH (USED)/GENERATED IN INVESTING ACTIVITIES (74) 498 370
-------------------- ----------------- ----------------
NET (DECREASE)/INCREASE IN CASH AND CASH EQUIVALENTS (270) 232 (287)
Cash and cash equivalents at beginning of the
period 1,331 1,425 1,425
Effect of exchange rate changes on
cash held 105 14 193
CASH AND CASH EQUIVALENT AT THE END OF THE PERIOD 1,166 1,671 1,331
==================== ================= ================
Notes:
1. INFORMATION
The financial information for the six months ended 30 June 2015
and the comparative amounts for the six months ended 30 June 2014
are unaudited.
The interim financial statements have been prepared in
accordance with IAS 34 Interim Financial Reporting as adopted by
the European Union. The interim financial statements have been
prepared applying the accounting policies and methods of
computation used in the preparation of the published consolidated
financial statements for the year ended 31 December 2014.
The interim financial statements do not include all of the
information required for full annual financial statements and
should be read in conjunction with the audited consolidated
financial statements of the Group for the year ended 31 December
2014, which are available on the Company's website
www.petrelresources.com
(MORE TO FOLLOW) Dow Jones Newswires
September 28, 2015 02:00 ET (06:00 GMT)
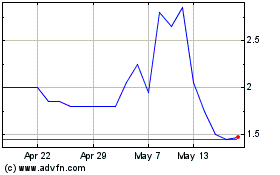
Petrel Resources (LSE:PET)
Historical Stock Chart
From Jun 2024 to Jul 2024

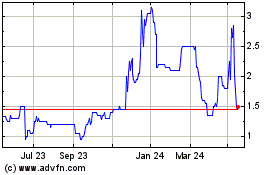
Petrel Resources (LSE:PET)
Historical Stock Chart
From Jul 2023 to Jul 2024
