BAB, Inc. Reports Profit for Year-ended 11/30/14
February 03 2015 - 9:56AM
Business Wire
BAB, Inc. (OTCBB: BABB) announced its financial results
for its fiscal year ended November 30, 2014, reporting net income
of $512,000, or $0.07 per share.
For the year-ended November 30, 2014, BAB, Inc. had revenues of
$2,535,000 and net income of $512,000, or $0.07 per share, versus
revenues of $2,450,000 and net income of $351,000, or $0.05 per
share, for the same period in 2013.
Total operating expenses for the year ended November 30, 2014,
were $1,997,000 versus $2,065,000 for the year ended November 30,
2013.
BAB, Inc. franchises and licenses Big Apple Bagels®, My Favorite
Muffin®, SweetDuet Frozen Yogurt & Gourmet Muffins® and
Brewster’s® Coffee. The Company’s stock is traded on the OTCBB
under the symbol BABB and its web site can be visited at
www.babcorp.com.
(TABLE FOLLOWS)
BAB, INC. CONDENSED CONSOLIDATED STATEMENT OF
OPERATIONS
Fiscal Year Ended 2014
2013 % Change REVENUES
Royalty fees from franchised stores 1,746,991 1,785,921 -2.2 %
Franchise and area development fee revenue 277,500 60,000 362.5 %
Licensing fees and other income 510,099
604,273 -15.6 %
Total Revenue
2,534,590 2,450,194 3.4 %
OPERATING COSTS AND EXPENSES Selling, general and
administrative 1,978,609 2,047,370 -3.4 % Depreciation and
amortization 17,983 17,493
2.8 %
Total Operating Expense 1,996,592
2,064,863 -3.3 %
Income before interest, other and taxes
537,998 385,331
39.6 % Interest expense (4,308 ) (5,699
) -24.4 % Interest and other income 673 968 -30.5 % Current
tax expense (22,417 ) (30,067 ) N/M
Net Income 511,946
350,533 46.0 %
Earnings per share - basic 0.07 0.05
N/M Average number of shares outstanding 7,263,508 7,263,508
N/M
Earnings per share - diluted 0.07
0.05 N/M Average number of shares outstanding
7,263,508 7,268,608 N/M
BAB, Inc.Michael K. Murtaugh, (847) 948-7520Fax: (847)
405-8140www.babcorp.com
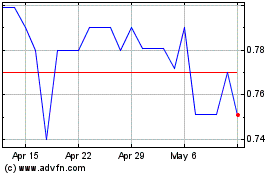
BAB (QB) (USOTC:BABB)
Historical Stock Chart
From Dec 2024 to Jan 2025

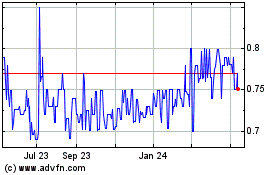
BAB (QB) (USOTC:BABB)
Historical Stock Chart
From Jan 2024 to Jan 2025
