 Paulness
6 days ago
Paulness
6 days ago
NEWS -- Oncolytics Biotech® to Host Conference Call to Discuss Fourth Quarter and Full Year Financial Results and Recent Operational Highlights
Conference call and webcast to take place on Friday, March 7, 2025, at 8:30 a.m. ET
SAN DIEGO and CALGARY, AB, Feb. 25, 2025 /PRNewswire/ -- Oncolytics Biotech® Inc. (NASDAQ: ONCY) (TSX: ONC), a leading clinical-stage company specializing in immunotherapy for oncology, today announced that it will host a conference call and webcast on Friday, March 7, 2025, at 8:30 a.m. ET to discuss a corporate update and financial results for the fourth quarter and full year 2024.
Conference Call & Webcast
Date: Friday, March 7, 2025
Time: 8:30 a.m. ET
Dial In – North American Toll-Free: (888) 510-2154
Dial In – International: (437) 900-0527
RapidConnect: to join the conference call without operator assistance, please click here
Conference ID (if needed): 48422
Webcast: please click here
A webcast of the call will also be available on the Investor Relations page of Oncolytics' website, available by clicking here, and will be archived for three months. A dial-in replay will be available for one week and can be accessed by dialing (888) 660-6345 (North America) or (289) 819-1450 (International) and using replay code: 48422#.
About Oncolytics Biotech Inc.
Oncolytics is a clinical-stage biotechnology company developing pelareorep, an intravenously delivered immunotherapeutic agent. Pelareorep has demonstrated promising results in two randomized Phase 2 studies in metastatic breast cancer and Phase 1 and 2 studies in pancreatic cancer. It acts by inducing anti-cancer immune responses and promotes an inflamed tumor phenotype -- turning "cold" tumors "hot" -- through innate and adaptive immune responses to treat a variety of cancers.
Pelareorep has demonstrated synergies with multiple approved oncology treatments. Oncolytics is currently conducting and planning combination clinical trials with pelareorep in solid and hematological malignancies as it advances towards registrational studies in metastatic breast cancer and pancreatic cancer, both of which have received Fast Track designation from the FDA. For further information, please visit: https://www.oncolyticsbiotech.com or follow the company on social media on LinkedIn and on X @oncolytics.
Company Contact
Jon Patton
Director of IR & Communication
mailto://jpatton@oncolytics.ca
Investor Relations for Oncolytics
Timothy McCarthy
LifeSci Advisors
+1-917-679-9282
mailto://tim@lifesciadvisors.com
Media Contact for Oncolytics
Michael Rubenstein
LifeSci Communications
mailto://mrubenstein@lifescicomms.com
View original content: https://www.prnewswire.com/news-releases/oncolytics-biotech-to-host-conference-call-to-discuss-fourth-quarter-and-full-year-financial-results-and-recent-operational-highlights-302384064.html
SOURCE Oncolytics Biotech® Inc.
Paulness
2 weeks ago
NEWS -- Oncolytics Biotech® Strengthens Its Pipeline in 2025 with Key Pancreatic and Anal Cancer Advances in Addition to Metastatic Breast Cancer
Recent clinical data presentations in these two hard-to-treat GI cancers, coupled with strong efficacy signals in breast cancer, demonstrate the potential of pelareorep across very different tumor types
SAN DIEGO, CA and CALGARY, AB, February 18, 2025 – Oncolytics Biotech® Inc. (NASDAQ: ONCY) (TSX: ONC), a leading clinical-stage company specializing in immunotherapy for oncology, continues to make good progress in 2025 with key regulatory and clinical advancements, reinforcing pelareorep’s potential in hard-to-treat cancers. Oncolytics is pleased to highlight two significant developments for its immunotherapy, pelareorep: the safety and regulatory clearance to advance enrollment in its pancreatic cancer study and the recent presentation of new efficacy and safety data at the 2025 American Society of Clinical Oncology (ASCO) Gastrointestinal Cancers Symposium in late January.
“We’re hitting critical milestones that validate our progress and set the stage for what we believe will be an exciting year,” said Wayne Pisano, Interim CEO and Chair of Oncolytics’ Board of Directors. “With positive feedback from regulators in place, we’re advancing our pancreatic cancer study toward full enrollment, and our ASCO GI presentations highlighted pelareorep’s strong safety and efficacy results in two hard-to-treat cancers. We remain focused on bringing new treatment options to patients while creating value for shareholders as we move forward in 2025.”
German Regulatory Agency Gives Green Light for Pancreatic Cancer Study to Continue as Planned
Approval to Fully Enroll the Cohort Secured: Germany’s Paul-Ehrlich-Institute (PEI) has given Oncolytics the go-ahead to continue enrolling patients in its pancreatic cancer trial (GOBLET Cohort 5) after a positive safety review.
What This Means: Pelareorep, in combination with modified FOLFIRINOX with and without atezolizumab, is now progressing toward full enrollment, with 30 patients set to participate in Stage 1 across the two treatment arms.
Next Steps: Oncolytics will continue to collect safety data, and an initial efficacy readout is expected later this year.ASCO GI 2025 Data Confirms Pelareorep’s Potential in Pancreatic and Anal Cancers
At ASCO GI 2025, Oncolytics presented new clinical results demonstrating pelareorep’s potential in two challenging cancer types:
Anal Cancer: Patients receiving pelareorep + atezolizumab continue to show stronger responses than expected based on published studies with checkpoint inhibitors alone.
Pancreatic Cancer: Pelareorep previously demonstrated a strong efficacy signal when administered with gemcitabine, nab-paclitaxel, and atezolizumab. The most recent data supports a favorable safety profile when combining pelareorep with a different chemotherapy regimen (modified FOLFIRINOX) with and without the checkpoint inhibitor atezolizumab, potentially expanding its treatment applications.
Why This Matters: These findings further de-risk pelareorep’s development and could pave the way for larger registration-enabling clinical trials in these indications.
Looking Ahead: More Catalysts in 2025
Oncolytics is entering a pivotal year with multiple upcoming milestones, including:
Additional data readouts from ongoing trials in gastrointestinal cancers, including translational results that further characterize pelareorep’s mechanism of action.
Interactions with Regulatory Agencies that could accelerate future trials and move pelareorep closer to potential registration-enabling studies in breast cancer and gastrointestinal cancers.“We’re seeing clinical validation across multiple studies,” added Pisano. “With encouraging regulatory interactions in hand and data readouts ahead, 2025 is shaping up to be an exciting year for Oncolytics and our investors. As we have shown in GOBLET, BRACELET-1, and numerous previous studies, pelareorep has a favorable safety profile and efficacy signals across multiple indications with a high unmet need. We are excited about the potential for moving to a registration-enabling study in breast cancer and advancing our clinical program in gastrointestinal cancers.”
About GOBLET
The GOBLET (Gastrointestinal tumOrs exploring the treatment comBinations with the oncolytic reovirus peLarEorep and anTi-PD-L1) study is a phase 1/2 multiple indication study in advanced or metastatic gastrointestinal tumors. The study is being conducted at 17 centers in Germany and is being managed by AIO-Studien-gGmbH. The co-primary endpoints of the study are objective response rate (ORR) and/or disease control rate and safety. Key secondary and exploratory endpoints include additional efficacy assessments and evaluation of potential biomarkers. Favorable safety and positive clinical efficacy signals have been seen in the pancreatic and anal cancer cohorts.
About GOBLET Cohort 5
The modified FOLFIRINOX (mFOLFIRINOX) cohort of the Phase 1/2 GOBLET study is designed to evaluate newly diagnosed metastatic pancreatic ductal adenocarcinoma patients treated with pelareorep + mFOLFIRINOX with or without atezolizumab. A three-patient safety run-in was incorporated to evaluate the safety and tolerability of each treatment arm: pelareorep + mFOLFIRINOX + atezolizumab and pelareorep + mFOLFIRINOX. A total of fifteen evaluable patients will be randomized to each arm in Stage 1 of this Simon two-stage study. The co-primary endpoints are objective response rate and safety. If Stage 1 success criteria are met, one or both treatment arms may be expanded to Stage 2, in which 17 additional evaluable patients per arm will be enrolled. Blood and tumor samples will also be collected for translational evaluations.
About AIO
AIO-Studien-gGmbH (AIO) emerged from the study center of the medical oncology working group within the German Cancer Society (DKG). AIO operates with a non-profit purpose of promoting science and research with a focus on medical oncology. Since its foundation, AIO has become a successful sponsor and study management company and has established itself both nationally and internationally.
About Oncolytics Biotech Inc.
Oncolytics is a clinical-stage biotechnology company developing pelareorep, an intravenously delivered immunotherapeutic agent. Pelareorep has demonstrated promising results in two randomized Phase 2 studies in metastatic breast cancer and Phase 1 and 2 studies in pancreatic cancer. It acts by inducing anti-cancer immune responses and promotes an inflamed tumor phenotype -- turning "cold" tumors "hot" -- through innate and adaptive immune responses to treat a variety of cancers.
Pelareorep has demonstrated synergies with multiple approved oncology treatments. Oncolytics is currently conducting and planning combination clinical trials with pelareorep in solid malignancies as it prepares for registrational studies in metastatic breast cancer and pancreatic cancer, both of which have received Fast Track designation from the FDA. For further information, please visit: https://www.oncolyticsbiotech.com or follow the company on social media on LinkedIn and on X @oncolytics.
This press release contains forward-looking statements, within the meaning of Section 21E of the Securities Exchange Act of 1934, as amended and forward-looking information under applicable Canadian securities laws (such forward-looking statements and forward-looking information are collectively referred to herein as “forward-looking statements”). Forward-looking statements contained in this press release include statements regarding Oncolytics’ belief as to the potential, mechanism of action and benefits of pelareorep as a cancer therapeutic; our plans to advance our pancreatic cancer study toward full enrollment; our focus on bringing new treatment options to patients while creating value for shareholders as we move forward in 2025; our plans to continue to collect safety data; the anticipated timing of an initial efficacy readout; our belief that our new clinical results in anal and pancreatic cancer further de-risk pelareorep’s development and could pave the way for larger registration-enabling clinical trials in these indications; our upcoming milestones, including additional data readouts and interactions with regulatory agencies; our belief that pelareorep is poised to advance to registration-enabling studies for the treatment of breast and pancreatic cancers; and other statements related to anticipated developments in Oncolytics’ business and technologies. In any forward-looking statement in which Oncolytics expresses an expectation or belief as to future results, such expectations or beliefs are expressed in good faith and are believed to have a reasonable basis, but there can be no assurance that the statement or expectation or belief will be achieved. Such forward-looking statements involve known and unknown risks and uncertainties, which could cause Oncolytics’ actual results to differ materially from those in the forward-looking statements. Such risks and uncertainties include, among others, the availability of funds and resources to pursue research and development projects, the efficacy of pelareorep as a cancer treatment, the success and timely completion of clinical studies and trials, Oncolytics’ ability to successfully commercialize pelareorep, uncertainties related to the research and development of pharmaceuticals, uncertainties related to the regulatory process and general changes to the economic environment. We may incur expenses or delays relating to events outside of our control, which could have a material adverse impact on our business, operating results and financial condition. Investors should consult Oncolytics’ quarterly and annual filings with the Canadian and U.S. securities commissions for additional information on risks and uncertainties relating to the forward-looking statements. Investors are cautioned against placing undue reliance on forward-looking statements. The Company does not undertake any obligation to update these forward-looking statements, except as required by applicable laws.
Company Contact
Jon Patton
Director of IR & Communication
mailto://jpatton@oncolytics.ca
Investor Relations for Oncolytics
Timothy McCarthy
LifeSci Advisors
+1-917-679-9282
mailto://tim@lifesciadvisors.com
Media Contact for Oncolytics
Michael Rubenstein
LifeSci Communications
mailto://mrubenstein@lifescicomms.com
Paulness
3 weeks ago
NEWS -- Oncolytics Biotech® Announces Matt Coffey, Ph.D. Will Not Return to CEO Role Following Medical Leave of Absence
Search for Chief Executive Officer to commence immediately
SAN DIEGO and CALGARY, AB, Feb. 7, 2025 /CNW/ -- Oncolytics Biotech® Inc. (NASDAQ: ONCY) (TSX: ONC), a leading clinical-stage company specializing in immunotherapy for oncology, today announced that Matt Coffey, Ph.D., President and Chief Executive Officer, will not return following a medical leave of absence and ongoing health concerns. After much thought and consideration, Dr. Coffey reached a decision that in the best interest of his family and Oncolytics Biotech Inc., he would officially step down as CEO and Director of the company.
"While we are saddened by his departure, we fully understand, respect, and support his decision. For the past 25 years, Matt has been invaluable to the organization and has led the development of pelareorep from pre-clinical through successful Phase 2 studies for metastatic breast cancer and pancreatic cancer. First as a co-founder and most recently as CEO, he has left an indelible fingerprint on the company and its employees. On behalf of the Board of Directors and all the dedicated employees of Oncolytics, we wish Matt good health and success, both now and in the future," said Wayne Pisano, Chair of Oncolytics' Board of Directors and Interim CEO. "We will now initiate a search for a Chief Executive Officer to lead the team as we work to bring Matt's vision of developing and making available a novel therapeutic agent (pelareorep) that addresses unmet needs in people undergoing cancer treatment." Wayne Pisano will remain Interim CEO until the new CEO is hired.
About Oncolytics Biotech Inc.
Oncolytics is a clinical-stage biotechnology company developing pelareorep, an intravenously delivered immunotherapeutic agent. Pelareorep has demonstrated promising results in two randomized Phase 2 studies in metastatic breast cancer and Phase 1 and 2 studies in pancreatic cancer. It acts by inducing anti-cancer immune responses and promotes an inflamed tumor phenotype -- turning "cold" tumors "hot" -- through innate and adaptive immune responses to treat a variety of cancers.
Pelareorep has demonstrated synergies with multiple approved oncology treatments. Oncolytics is currently conducting and planning combination clinical trials with pelareorep in solid malignancies as it advances towards registrational studies in metastatic breast cancer and pancreatic cancer, both of which have received Fast Track designation from the FDA. For further information, please visit: https://www.oncolyticsbiotech.com or follow the company on social media on LinkedIn and on X @oncolytics.
Company Contact
Jon Patton
Director of IR & Communication
mailto://jpatton@oncolytics.ca
Investor Relations for Oncolytics
Timothy McCarthy
LifeSci Advisors
+1-917-679-9282
mailto://tim@lifesciadvisors.com
Media Contact for Oncolytics
Michael Rubenstein
LifeSci Communications
mailto://mrubenstein@lifescicomms.com
View original content to download multimedia: https://www.prnewswire.com/news-releases/oncolytics-biotech-announces-matt-coffey-phd-will-not-return-to-ceo-role-following-medical-leave-of-absence-302371699.html
SOURCE Oncolytics Biotech® Inc.
View original content to download multimedia: http://www.newswire.ca/en/releases/archive/February2025/07/c2799.html
Paulness
1 month ago
NEWS -- Oncolytics Biotech® to Present Compelling New Efficacy and Safety Data in Anal and Pancreatic Cancers at 2025 ASCO GI Symposium
Pelareorep combination therapy shows continued meaningful improvement over checkpoint inhibitors alone in anal cancer patients
Pelareorep-based therapy demonstrates strong safety profile with new chemotherapy regimen in pancreatic cancer patients
SAN DIEGO and CALGARY, AB, Jan. 22, 2025 /PRNewswire/ -- Oncolytics Biotech® Inc. (NASDAQ: ONCY) (TSX: ONC), a leading clinical-stage company specializing in immunotherapy for oncology, today provided details from the abstracts featuring pelareorep that are being presented at the 2025 American Society of Clinical Oncology (ASCO) Gastrointestinal Cancers Symposium in San Francisco January 23-25, 2025.
Thomas Heineman, M.D., Ph.D., Chief Medical Officer for Oncolytics Biotech, commented, "The posters that will be presented at the symposium later this week continue to show pelareorep's compelling potential in gastrointestinal cancers. In relapsed anal cancer, the efficacy signal that was initially reported continues to outperform historical control trials with the inclusion of additional patients. Importantly, the complete response we observed previously continued beyond the 12 months initially reported. Together, these results point to a clinically meaningful synergy between pelareorep and checkpoint inhibitors like atezolizumab. In pancreatic cancer, pelareorep previously demonstrated a strong efficacy signal when administered with gemcitabine, nab-paclitaxel and atezolizumab. Our new safety data indicate its ability to also be combined with modified FOLFIRINOX, thus expanding its potential to benefit patients with metastatic pancreatic cancer. We will continue to provide updates on the safety and efficacy of pelareorep-based combination therapy from these cohorts as they become available."
"I am quite pleased by these recent updates from the GOBLET study as they continue to provide potential new treatment options for patients in need of alternatives while maintaining a manageable safety profile," said Dirk Arnold, M.D., Ph.D., Director of Asklepios Tumorzentrum Hamburg, and primary investigator of the GOBLET trial. "I've been especially impressed with the ability of pelareorep-based therapies to work across multiple challenging cancer indications and with multiple standards of care, including chemotherapy and checkpoint inhibitors, so I look forward to additional data readouts that can help improve the treatment paradigm."
Abstract Number: 6
Title: GOBLET platform study: Preliminary safety and tumor response results for the relapsed anal carcinoma cohort in patients treated with pelareorep and atezolizumab.
Presentation Type: Poster
Session Title: Poster Session C: Cancers of the Colon, Rectum, and Anus
Session Date and Time: January 25, 2025, 7:00 - 7:55 a.m. PT
The fourth cohort of the GOBLET study is evaluating pelareorep combined with the checkpoint inhibitor atezolizumab in patients with second-line or later unresectable squamous cell carcinoma of the anal canal (SCCA). The treatment combination met the pre-defined efficacy success criteria for Stage 1 of its Simon two-stage design, and Stage 2 enrollment of 18 additional evaluable patients has begun. Updated results from this cohort show that four of twelve evaluable patients achieved a partial response for an objective response rate of 33%. This includes one patient with a prolonged complete response that persisted for over 15 months. This is notable because historical response rates to checkpoint inhibitor monotherapy are low, generally 10-24%1-3. There continue to be no safety concerns with the treatment regimen. At treatment cycle four, tumor-infiltrating lymphocyte (TIL) clonal expansion has been observed in the three responding patients for which data is available. It is anticipated that the additional data from Stage 2 of this cohort will provide a sufficiently strong efficacy signal to move this treatment regimen into a registration-enabling study.
Abstract Number: 730
Title: GOBLET study: Results of the safety run-in for first-line metastatic pancreatic ductal adenocarcinoma (PDAC) patients treated with pelareorep + modified FOLFIRINOX +/- atezolizumab.
Presentation Type: Poster
Session Title: Poster Session B: Cancers of the Pancreas, Small Bowel, and Hepatobiliary Tract
Session Date and Time: January 24, 2025, 11:30 a.m. – 1:00 p.m. PT
A promising efficacy signal in metastatic pancreatic ductal adenocarcinoma (PDAC) was previously observed for the combination of pelareorep, gemcitabine, nab-paclitaxel, and atezolizumab. To expand the potential of pelareorep to benefit PDAC patients, and after discussion with key opinion leaders, a cohort was added to the GOBLET study to evaluate pelareorep combined with modified FOLFIRINOX (mFOLFIRINOX) both with and without atezolizumab. This cohort is being funded by a US$5 million grant from the Pancreatic Cancer Action Network (PanCAN). The three-patient safety run-in for each treatment arm has completed enrollment, and patients have completed the necessary evaluation period. The safety data have been reviewed by the Data Safety Monitoring Board (DSMB) and Paul Ehrlich Institute (PEI), Germany's medical regulatory body, and they have recommended patient enrollment continue without modification.
Abstracts from the ASCO Gastrointestinal Cancers Symposium are currently available on the event website, which can be accessed by clicking here.
References
Rao S, et al. Phase II study of retifanlimab in patients (pts) with squamous carcinoma of the anal canal (SCAC) who progressed following platinum-based chemotherapy. Annals of Oncology. 2020 September. doi: https://doi.org/10.1016/j.annonc.2020.08.2272.
Marabelle A, et al. Pembrolizumab for previously treated advanced anal squamous cell carcinoma: results from the non-randomised, multicohort, multicentre, phase 2 KEYNOTE-158 study. Lancet Gastroenterol Hepatol. 2022 May;7(5):446-454. doi: 10.1016/S2468-1253(21)00382-4.
Lonardi S, et al. Randomized phase II trial of avelumab alone or in combination with cetuximab for patients with previously treated, locally advanced, or metastatic squamous cell anal carcinoma: the CARACAS study. J Immunother Cancer. 2021 November;9(11):e002996. doi: 10.1136/jitc-2021-002996. PMID: 34815354; PMCID: PMC8611452.About GOBLET
The GOBLET (Gastrointestinal tumOrs exploring the treatment comBinations with the oncolytic reovirus peLarEorep and anTi-PD-L1) study is a phase 1/2 multiple indication study in advanced or metastatic gastrointestinal tumors. The study is being conducted at 17 centers in Germany and is being managed by AIO-Studien-gGmbH. The co-primary endpoints of the study are objective response rate (ORR) and/or disease control rate assessed at week 16 and safety. Key secondary and exploratory endpoints include additional efficacy assessments and evaluation of potential biomarkers. The study comprises five treatment groups:
Pelareorep in combination with atezolizumab, gemcitabine, and nab-paclitaxel in 1st line advanced/metastatic pancreatic cancer patients;
Pelareorep in combination with atezolizumab in 1st line MSI (microsatellite instability)-high metastatic colorectal cancer patients;
Pelareorep in combination with atezolizumab and TAS-102 in 3rd line metastatic colorectal cancer patients
Pelareorep in combination with atezolizumab in 2nd line advanced and unresectable anal cancer patients; and
Pelareorep in combination with mFOLFIRINOX with and without atezolizumab in newly diagnosed metastatic PDAC patients.Any cohort meeting pre-specified efficacy criteria in Stage 1 may be advanced to Stage 2 and enroll additional patients.
About AIO
AIO-Studien-gGmbH (AIO) emerged from the study center of the medical oncology working group within the German Cancer Society (DKG). AIO operates with a non-profit purpose of promoting science and research with a focus on medical oncology. Since its foundation, AIO has become a successful sponsor and study management company and has established itself both nationally and internationally.
About Oncolytics Biotech Inc.
Oncolytics is a clinical-stage biotechnology company developing pelareorep, an intravenously delivered immunotherapeutic agent. Pelareorep has demonstrated promising results in two randomized Phase 2 studies in metastatic breast cancer and Phase 1 and 2 studies in pancreatic cancer. It acts by inducing anti-cancer immune responses and promotes an inflamed tumor phenotype -- turning "cold" tumors "hot" -- through innate and adaptive immune responses to treat a variety of cancers.
Pelareorep has demonstrated synergies with multiple approved oncology treatments. Oncolytics is currently conducting and planning combination clinical trials with pelareorep in solid malignancies as it advances towards registrational studies in metastatic breast cancer and pancreatic cancer, both of which have received Fast Track designation from the FDA. For further information, please visit: https://www.oncolyticsbiotech.com or follow the company on social media on LinkedIn and on X @oncolytics.
Tecentriq® (atezolizumab) is a registered trademark of Genentech, a member of the Roche Group.
This press release contains forward-looking statements, within the meaning of Section 21E of the Securities Exchange Act of 1934, as amended and forward-looking information under applicable Canadian securities laws (such forward-looking statements and forward-looking information are collectively referred to herein as "forward-looking statements"). Forward-looking statements contained in this press release include statements regarding Oncolytics' belief as to the potential, mechanism of action and benefits of pelareorep as a cancer therapeutic; our plans to provide updates on the safety and efficacy of pelareorep-based combinations therapy; our expectation that additional data from the fourth cohort of our Stage 2 GOBLET study will provide a sufficiently strong efficacy signal to move the treatment regimen into a registration-enabling study; our plans to advance pelareorep to registration-enabling studies for the treatment of breast and pancreatic cancers; and other statements related to anticipated developments in Oncolytics' business and technologies. In any forward-looking statement in which Oncolytics expresses an expectation or belief as to future results, such expectations or beliefs are expressed in good faith and are believed to have a reasonable basis, but there can be no assurance that the statement or expectation or belief will be achieved. Such forward-looking statements involve known and unknown risks and uncertainties, which could cause Oncolytics' actual results to differ materially from those in the forward-looking statements. Such risks and uncertainties include, among others, the availability of funds and resources to pursue research and development projects, the efficacy of pelareorep as a cancer treatment, the success and timely completion of clinical studies and trials, Oncolytics' ability to successfully commercialize pelareorep, uncertainties related to the research and development of pharmaceuticals, uncertainties related to the regulatory process and general changes to the economic environment. We may incur expenses or delays relating to events outside of our control, which could have a material adverse impact on our business, operating results and financial condition. Investors should consult Oncolytics' quarterly and annual filings with the Canadian and U.S. securities commissions for additional information on risks and uncertainties relating to the forward-looking statements. Investors are cautioned against placing undue reliance on forward-looking statements. The Company does not undertake any obligation to update these forward-looking statements, except as required by applicable laws.
Company Contact
Jon Patton
Director of IR & Communication
mailto://jpatton@oncolytics.ca
Investor Relations for Oncolytics
Timothy McCarthy
LifeSci Advisors
+1-917-679-9282
mailto://tim@lifesciadvisors.com
Media Contact for Oncolytics
Michael Rubenstein
LifeSci Communications
mailto://mrubenstein@lifescicomms.com
Logo - https://mma.prnewswire.com/media/1762876/Oncolytics_Biotech_New_Logo.jpg
View original content: https://www.prnewswire.com/news-releases/oncolytics-biotech-to-present-compelling-new-efficacy-and-safety-data-in-anal-and-pancreatic-cancers-at-2025-asco-gi-symposium-302357254.html
SOURCE Oncolytics Biotech® Inc.
Paulness
2 months ago
NEWS -- Regulatory Approval Clears Path for Oncolytics Biotech® to Advance Promising Pancreatic Cancer Treatment, Following a Review of Safety Data
New pancreatic cancer cohort moves forward with full enrollment of 30 patients in Stage 1
SAN DIEGO and CALGARY, AB, Jan. 15, 2025 /PRNewswire/ -- Oncolytics Biotech® Inc. (NASDAQ: ONCY) (TSX: ONC), a leading clinical-stage company specializing in immunotherapy for oncology, today announced that Germany's medical regulatory body, the Paul-Ehrlich-Institute (PEI), has approved the continuation of patient enrollment into Cohort 5 of the GOBLET study. This cohort is evaluating pelareorep in combination with modified FOLFIRINOX (mFOLFIRINOX) with or without atezolizumab (Tecentriq®) in newly diagnosed pancreatic ductal adenocarcinoma (PDAC) patients.
Following a positive safety review by the independent Data Safety Monitoring Board (DSMB), which recommended continuation, the PEI's approval allows Cohort 5 to progress to full enrollment. Early safety data will be presented at the upcoming 2025 American Society of Clinical Oncology (ASCO) Gastrointestinal Cancers Symposium later this month, with initial efficacy results expected in the second half of the year.
"Pelareorep has the potential to meaningfully improve outcomes for patients with metastatic pancreatic cancer," said Thomas Heineman, M.D., Ph.D., Chief Medical Officer for Oncolytics Biotech. "Encouraging tumor response rates observed in an earlier cohort of the GOBLET study underscore pelareorep's promise in this disease. GOBLET Cohort 5 extends our evaluation by testing pelareorep with a different chemotherapy regimen, mFOLFIRINOX, which broadens the range of pancreatic cancer patients who may benefit from this innovative therapy. Positive results from this cohort may ultimately enable pelareorep to benefit the large majority of metastatic pancreatic patients for whom improved treatment options are badly needed."
About GOBLET Cohort 5
The mFOLFIRINOX cohort of the Phase 1/2 GOBLET study is designed to evaluate newly diagnosed metastatic PDAC patients treated with pelareorep + mFOLFIRINOX with or without atezolizumab. A three-patient safety run-in was incorporated to evaluate the safety and tolerability of each treatment arm: pelareorep + mFOLFIRINOX + atezolizumab and pelareorep + mFOLFIRINOX. A total of fifteen evaluable patients will be randomized to each arm in Stage 1 of this Simon two-stage study. The co-primary endpoints are objective response rate and safety. If Stage 1 success criteria are met, one or both treatment arms may be expanded to Stage 2, in which 17 additional evaluable patients per arm will be enrolled. Blood and tumor samples will also be collected for translational evaluations.
About GOBLET
The GOBLET (Gastrointestinal tumOrs exploring the treatment comBinations with the oncolytic reovirus peLarEorep and anTi-PD-L1) study is a phase 1/2 multiple indication study in advanced or metastatic gastrointestinal tumors. The study is being conducted at 17 centers in Germany and is being managed by AIO-Studien-gGmbH. The co-primary endpoints of the study are objective response rate (ORR) and/or disease control rate and safety. Key secondary and exploratory endpoints include additional efficacy assessments and evaluation of potential biomarkers. The study comprises five treatment groups:
Pelareorep in combination with atezolizumab, gemcitabine, and nab-paclitaxel in 1st line advanced/metastatic PDAC patients;
Pelareorep in combination with atezolizumab in 1st line MSI (microsatellite instability)-high metastatic colorectal cancer patients;
Pelareorep in combination with atezolizumab and TAS-102 in 3rd line metastatic colorectal cancer patients;
Pelareorep in combination with atezolizumab in 2nd line or later advanced and unresectable anal cancer patients; and
Pelareorep in combination with mFOLFIRINOX with and without atezolizumab in newly diagnosed metastatic PDAC patients.Any cohort meeting pre-specified efficacy criteria in Stage 1 may be advanced to Stage 2 and enroll additional patients.
About AIO
AIO-Studien-gGmbH (AIO) emerged from the study center of the medical oncology working group within the German Cancer Society (DKG). AIO operates with a non-profit purpose of promoting science and research with a focus on medical oncology. Since its foundation, AIO has become a successful sponsor and study management company and has established itself both nationally and internationally.
About Oncolytics Biotech Inc.
Oncolytics is a clinical-stage biotechnology company developing pelareorep, an intravenously delivered immunotherapeutic agent. Pelareorep has demonstrated promising results in two randomized Phase 2 studies in metastatic breast cancer and Phase 1 and 2 studies in pancreatic cancer. It acts by inducing anti-cancer immune responses and promotes an inflamed tumor phenotype -- turning "cold" tumors "hot" -- through innate and adaptive immune responses to treat a variety of cancers.
Pelareorep has demonstrated synergies with multiple approved oncology treatments. Oncolytics is currently conducting and planning combination clinical trials with pelareorep in solid malignancies as it advances towards registrational studies in metastatic breast cancer and pancreatic cancer, both of which have received Fast Track designation from the FDA. For further information, please visit: https://www.oncolyticsbiotech.com or follow the company on social media on LinkedIn and on X @oncolytics.
Tecentriq® (atezolizumab) is a registered trademark of Genentech, a member of the Roche Group.
This press release contains forward-looking statements, within the meaning of Section 21E of the Securities Exchange Act of 1934, as amended and forward-looking information under applicable Canadian securities laws (such forward-looking statements and forward-looking information are collectively referred to herein as "forward-looking statements"). Forward-looking statements contained in this press release include statements regarding Oncolytics' belief as to the potential, mechanism of action and benefits of pelareorep as a cancer therapeutic; continued enrollment in the GOBLET study and the expansion thereof to additional participants; our belief that pelareorep is poised to advance to registration-enabling studies for the treatment of breast and pancreatic cancers; and other statements related to anticipated developments in Oncolytics' business and technologies. In any forward-looking statement in which Oncolytics expresses an expectation or belief as to future results, such expectations or beliefs are expressed in good faith and are believed to have a reasonable basis, but there can be no assurance that the statement or expectation or belief will be achieved. Such forward-looking statements involve known and unknown risks and uncertainties, which could cause Oncolytics' actual results to differ materially from those in the forward-looking statements. Such risks and uncertainties include, among others, the availability of funds and resources to pursue research and development projects, the efficacy of pelareorep as a cancer treatment, the success and timely completion of clinical studies and trials, Oncolytics' ability to successfully commercialize pelareorep, uncertainties related to the research and development of pharmaceuticals, uncertainties related to the regulatory process and general changes to the economic environment. We may incur expenses or delays relating to events outside of our control, which could have a material adverse impact on our business, operating results and financial condition. Investors should consult Oncolytics' quarterly and annual filings with the Canadian and U.S. securities commissions for additional information on risks and uncertainties relating to the forward-looking statements. Investors are cautioned against placing undue reliance on forward-looking statements. The Company does not undertake any obligation to update these forward-looking statements, except as required by applicable laws.
Company Contact
Jon Patton
Director of IR & Communication
mailto://jpatton@oncolytics.ca
Investor Relations for Oncolytics
Timothy McCarthy
LifeSci Advisors
+1-917-679-9282
mailto://tim@lifesciadvisors.com
View original content: https://www.prnewswire.com/news-releases/regulatory-approval-clears-path-for-oncolytics-biotech-to-advance-promising-pancreatic-cancer-treatment-following-a-review-of-safety-data-302351718.html
SOURCE Oncolytics Biotech® Inc.
Paulness
2 months ago
NEWS -- Oncolytics Biotech® Highlights 2024 Achievements and Prepares for an Influential 2025 with Promising Breast and GI Cancer Data
Promising BRACELET-1 results in HR+/HER2- metastatic breast cancer lay the foundation for potential registration-enabling study and accelerated approval
Advancing gastrointestinal cancer pipeline underscores potential for additional registration-enabling studies
SAN DIEGO and CALGARY, AB, Dec. 23, 2024 /PRNewswire/ -- Oncolytics Biotech® Inc. (NASDAQ: ONCY) (TSX: ONC), a leading clinical-stage company specializing in immunotherapy for oncology, is providing a recap of the major accomplishments from 2024 and a preview of the milestones that are expected over the next 12 months. Following the promising BRACELET-1 readout, Oncolytics expects additional data readouts across our clinical development program in 2025, forming what it believes is a clear pathway to future commercialization opportunities.
"This past year produced highly encouraging clinical developments that we believe set the stage for significant progress, headlined by the robust efficacy results from the BRACELET-1 breast cancer study," said Wayne Pisano, Interim CEO and Chair of Oncolytics' Board of Directors. "In addition, our gastrointestinal cancer program continues to impress, resulting in meaningful collaborations with well-respected experts in the field. Key opinion leaders in both breast and GI cancers continue to be excited by pelareorep's potential as we move into 2025. Based on these insights from leading oncologists, we believe pelareorep has the potential to become a transformational immunotherapy - and that pelareorep-based combination therapies could accelerate our path toward regulatory approval. We are very optimistic about our plans for the next year, and we look forward to showcasing our latest clinical progress early in the new year at the ASCO GI Symposium - an event that could provide key catalysts for our ongoing gastrointestinal cancer programs. Unlike many immunotherapies that struggle to convert 'cold' tumors to 'hot,' pelareorep's unique mechanism of action following intravenous delivery has shown the potential to significantly boost patients' immune responses - making previously unresponsive tumors more susceptible to treatment. I would like to say thank you to our shareholders, clinical collaborators, study sites and their staff, the patients who participate in our trials, and the employees of Oncolytics who have stepped up in a significant way in the temporary absence of our CEO, Matt Coffey."
BRACELET-1's highly promising results lay a foundation for what we anticipate could be a pivotal, registration-enabling study, further aligning with our long-term goal of improving patient treatment options in metastatic breast cancer
In September, we reported final efficacy results from BRACELET-1, a randomized controlled study that showed marked clinical benefit in patients who received pelareorep-based combination therapy, reinforcing our confidence in pelareorep's ability to improve patient outcomes. These results included an estimated median overall survival benefit that exceeded one year and a two-year overall survival rate that was nearly double paclitaxel monotherapy (link to press release). Of note, the cohorts were well-balanced across key characteristics, including age, stage of disease, and prior lines of therapy, and pelareorep + paclitaxel demonstrated a favorable overall safety profile. BRACELET-1 also substantiates the results of our earlier IND-213 study, in which median overall survival in HR+/HER2- metastatic breast cancer patients was nearly doubled in patients treated with pelareorep + paclitaxel. Importantly, we also had a productive meeting with the FDA to present our breast cancer data and to align on key elements of our breast cancer program (link to the press release). This includes the use of progression-free survival as the primary endpoint in the planned registration-enabling study, which we believe will allow us to reach the final analysis within two years of the start of enrollment. If results from this registration-enabling study are similar to those observed in BRACELET-1, we believe they will provide a compelling basis for an accelerated approval application that could ultimately lead to making pelareorep available to approximately 55,000 patients in the US1-4 in need of better treatment options. We look forward to beginning enrollment into this study as soon as possible and providing more details as they become available.
Collaboration with GCAR on pancreatic cancer study
Our compelling data set in first-line metastatic pancreatic ductal adenocarcinoma (PDAC) has provided us with opportunities to potentially help thousands of patients in this difficult-to-treat disease. We are excited to be working with the Global Coalition for Adaptive Research (GCAR) on a registration-enabling study for pelareorep in metastatic PDAC (link to press release). After more than doubling the objective response rate compared to historical control trials in cohort 1 of the GOBLET study, multiple key opinion leaders suggested we move the combination of pelareorep, nab-paclitaxel, gemcitabine, and atezolizumab directly into a study that could support regulatory approval. GCAR has a proven history of designing studies that could accelerate the registrational study timeline and provide substantial cost savings compared to traditional phase 3 trials. We continue to work together to finalize the master protocol and expect to engage with the FDA on our plans in the first half of 2025. Having already collaborated with Roche on GOBLET, we are excited Roche will participate in this registration-enabling study as well.
Progress on the PanCAN-supported pancreatic cancer cohort of GOBLET
Another exciting collaboration stemming from our pancreatic cancer data is with The Pancreatic Cancer Action Network (PanCAN). PanCAN provided the funding for a new GOBLET study cohort evaluating pelareorep + modified FOLFIRINOX (mFOLFIRINOX), with and without atezolizumab, in metastatic pancreatic cancer patients. We dosed the first patient in this cohort in June, completed safety run-in enrollment in Q4 of this year, and received favorable safety feedback from the Data Safety Monitoring Board (DSMB) earlier this month. This cohort represents an important opportunity to evaluate novel treatment options for this very difficult-to-manage disease and may form the basis for an additional pelareorep registrational path. As previously announced, we will be presenting data from this cohort at the ASCO GI Symposium in January 2025 (link to the press release).
Enrollment expansion in anal cancer provides another possible registrational study opportunity
Earlier this year, we expanded enrollment into cohort 4 of the GOBLET study, which is evaluating pelareorep and atezolizumab in second-line or later unresectable squamous cell carcinoma of the anal canal (SCCA) (link to press release). We previously reported objective response rate data that roughly tripled historical control data and believe 18 patients of additional data could be sufficient to move to a registration-enabling study. While this is an uncommon cancer, the opportunity to improve treatment options would be profoundly impactful for patients and would serve as validation of pelareorep's potential, including its ability to synergize checkpoint inhibitors like atezolizumab. Additional efficacy data from this cohort will be reported at ASCO GI in January 2025.
Presentation at Biotech Showcase and hosting investor meetings during the 2025 J.P. Morgan Healthcare Conference
Finally, Oncolytics Biotech will be presenting at the Biotech Showcase at the Hilton San Francisco Union Square on January 13, 2025, at 2:30 p.m. PST, and the Executive Team will be meeting investors in addition to current and potential partners during the week of the J.P. Morgan Healthcare Conference (January 13-15, 2025).
Anticipated upcoming milestones
H1 2025: Finalize master protocol for the adaptive registration-enabling trial for pelareorep, gemcitabine, nab-paclitaxel, and atezolizumab in first-line PDAC with the GCAR and submit it to the FDA
H1 2025: Safety run-in data from cohort 5 of the GOBLET study, investigating pelareorep and mFOLFIRINOX with or without atezolizumab in newly diagnosed pancreatic cancer
H1 2025: updated efficacy data from cohort 4 of the GOBLET study, investigating pelareorep and atezolizumab in second-line or later anal cancer
H2 2025: Initial efficacy results from cohort 5 of the GOBLET study, investigating pelareorep and mFOLFIRINOX with or without atezolizumab in newly diagnosed PDAC
H2 2025: First patient enrolled in registration-enabling study evaluating pelareorep and paclitaxel in metastatic HR+/HER2- breast cancerReferences:
Gampenrieder, Simon Peter et al. "Landscape of HER2-low metastatic breast cancer (MBC): results from the Austrian AGMT_MBC-Registry." Breast cancer research : BCR vol. 23,1 112. 14 Dec. 2021, doi:10.1186/s13058-021-01492-x;
Schettini, Francesco et al. "Clinical, pathological, and PAM50 gene expression features of HER2-low breast cancer." NPJ breast cancer vol. 7,1 1. 4 Jan. 2021, doi:10.1038/s41523-020-00208-2
Mehta, Sandhya et al. "Prevalent of 'HER2 ultra-low' among patients with advanced breast cancer with historical IHC0 status." Journal of Clinical Oncology vol. 42, 16. 29 May 2024, doi.org/10.1200/JCO.2024.42.16_suppl.e1315;
Tarantino, Paolo et al. "HER2-Low Breast Cancer: Pathological and Clinical Landscape." Journal of clinical oncology : official journal of the American Society of Clinical Oncology vol. 38,17 (2020): 1951-1962. doi:10.1200/JCO.19.02488About Oncolytics Biotech Inc.
Oncolytics is a clinical-stage biotechnology company developing pelareorep, an intravenously delivered immunotherapeutic agent. Pelareorep has demonstrated promising results in two randomized Phase 2 studies in metastatic breast cancer and Phase 1 and 2 studies in pancreatic cancer. It acts by inducing anti-cancer immune responses and promotes an inflamed tumor phenotype -- turning "cold" tumors "hot" -- through innate and adaptive immune responses to treat a variety of cancers.
Pelareorep has demonstrated synergies with multiple approved oncology treatments. Oncolytics is currently conducting and planning combination clinical trials with pelareorep in solid malignancies as it advances towards registrational studies in metastatic breast cancer and pancreatic cancer, both of which have received Fast Track designation from the FDA. For further information, please visit: https://www.oncolyticsbiotech.com or follow the company on social media on LinkedIn and on X @oncolytics.
This press release contains forward-looking statements, within the meaning of Section 21E of the Securities Exchange Act of 1934, as amended and forward-looking information under applicable Canadian securities laws (such forward-looking statements and forward-looking information are collectively referred to herein as "forward-looking statements"). Forward-looking statements contained in this press release include statements regarding Oncolytics' belief as to the potential, mechanism of action and benefits of pelareorep as a cancer therapeutic;our expectation that additional data readouts across our clinical development program in 2025 will help form what we believe is a clear pathway to future commercialization opportunities; our belief that pelareorep has the potential to become a transformational immunotherapy and that pelareorep-based combination therapies could accelerate our path toward regulatory approval; our plans to present our latest clinical progress early in the new year at the ASCO GI Symposium which we believe could provide key catalysts for our ongoing gastrointestinal cancer programs; our belief that the use of progression-free survival as the primary endpoint in the planned registration-enabling study will allow us to reach the final analysis within two years of the start of enrollment; our belief that if the results from our registration-enabling study in metastatic breast cancer are similar to those observed in BRACELET-1 they will provide a compelling basis for an accelerated approval application that could ultimately lead to making pelareorep available to approximately 55,000 patients in the U.S.; our expectation that we will engage with the FDA on our plans for our proposed study with GCAR in metastatic PDAC in the first half of 2025; our belief that our new GOBLET-study cohort represents an important opportunity to evaluate novel treatment options for this very difficult-to-manage disease and may form the basis for an additional pelareorep registrational path and our belief that 18 patients of additional data could be sufficient to move to a registration-enabling study; our anticipated upcoming milestones; and other statements related to anticipated developments in Oncolytics' business and technologies. In any forward-looking statement in which Oncolytics expresses an expectation or belief as to future results, such expectations or beliefs are expressed in good faith and are believed to have a reasonable basis, but there can be no assurance that the statement or expectation or belief will be achieved. Such forward-looking statements involve known and unknown risks and uncertainties, which could cause Oncolytics' actual results to differ materially from those in the forward-looking statements. Such risks and uncertainties include, among others, the availability of funds and resources to pursue research and development projects, the efficacy of pelareorep as a cancer treatment, the success and timely completion of clinical studies and trials, Oncolytics' ability to successfully commercialize pelareorep, uncertainties related to the research and development of pharmaceuticals, uncertainties related to the regulatory process and general changes to the economic environment. In particular, we may be impacted by business interruptions resulting from COVID-19 coronavirus, including operating, manufacturing supply chain, clinical trial and project development delays and disruptions, labour shortages, travel and shipping disruption, and shutdowns (including as a result of government regulation and prevention measures). It is unknown whether and how Oncolytics may be affected if the COVID-19 pandemic persists for an extended period of time. We may incur expenses or delays relating to such events outside of our control, which could have a material adverse impact on our business, operating results and financial condition. Investors should consult Oncolytics' quarterly and annual filings with the Canadian and U.S. securities commissions for additional information on risks and uncertainties relating to the forward-looking statements. Investors are cautioned against placing undue reliance on forward-looking statements. The Company does not undertake any obligation to update these forward-looking statements, except as required by applicable laws.
Company Contact
Jon Patton
Director of IR & Communication
mailto://jpatton@oncolytics.ca
Investor Relations for Oncolytics
Timothy McCarthy
LifeSci Advisors
+1-917-679-9282
mailto://tim@lifesciadvisors.com
Logo - https://mma.prnewswire.com/media/2408622/Oncolytics_Biotech_Inc_Logo.jpg
View original content: https://www.prnewswire.com/news-releases/oncolytics-biotech-highlights-2024-achievements-and-prepares-for-an-influential-2025-with-promising-breast-and-gi-cancer-data-302338226.html
SOURCE Oncolytics Biotech® Inc.
Paulness
2 months ago
NEWS -- Oncolytics Biotech® to Present Promising Pelareorep Data in Pancreatic and Anal Cancers at ASCO GI Symposium
SAN DIEGO and CALGARY, AB, Dec. 18, 2024 /PRNewswire/ -- Oncolytics Biotech® Inc. (NASDAQ: ONCY) (TSX: ONC), a leading clinical-stage company specializing in immunotherapy for oncology, today announced the presentation of two data sets through two abstracts showcasing pelareorep's potential in difficult-to-treat gastrointestinal cancers were accepted and will be presented at the 2025 American Society of Clinical Oncology (ASCO) Gastrointestinal Cancers Symposium in San Francisco January 23-25, 2025.
Tom Heineman, M.D., Ph.D., Oncolytics' Chief Medical Officer, said, "We are enthusiastic about pelareorep's applicability across multiple gastrointestinal cancer indications, including pancreatic and anal cancer. Pelareorep engages patients' immune systems to help make commonly used chemotherapies and checkpoint inhibitors, such as atezolizumab, more effective in fighting cancer. This offers the promise of delaying disease progression and improving survival in patients with these devastating diseases. Given the versatility of pelareorep, we see multiple clinical and regulatory options for bringing this promising medicine to patients."
Abstract Number: 6
Title: GOBLET platform study: Preliminary safety and tumor response results for the relapsed anal carcinoma cohort in patients treated with pelareorep and atezolizumab.
Presentation Type: Poster
Session Title: Poster Session C: Cancers of the Colon, Rectum, and Anus
Session Date and Time: January 25, 2025, 7:00 - 7:55 a.m. PT
Abstract Number: 730
Title: GOBLET study: Results of the safety run-in for first-line metastatic pancreatic ductal adenocarcinoma (PDAC) patients treated with pelareorep + modified FOLFIRINOX +/- atezolizumab.
Presentation Type: Poster
Session Title: Poster Session B: Cancers of the Pancreas, Small Bowel, and Hepatobiliary Tract
Session Date and Time: January 24, 2025, 11:30 a.m. – 1:00 p.m. PT
Abstracts will be published on the ASCO Gastrointestinal Cancers Symposium website at 5:00 p.m. ET on January 21, 2025.
About Oncolytics Biotech Inc.
Oncolytics is a clinical-stage biotechnology company developing pelareorep, an intravenously delivered immunotherapeutic agent. Pelareorep has demonstrated promising results in two randomized Phase 2 studies in metastatic breast cancer and Phase 1 and 2 studies in pancreatic cancer. It acts by inducing anti-cancer immune responses and promotes an inflamed tumor phenotype -- turning "cold" tumors "hot" -- through innate and adaptive immune responses to treat a variety of cancers.
Pelareorep has demonstrated synergies with multiple approved oncology treatments. Oncolytics is currently conducting and planning combination clinical trials with pelareorep in solid malignancies as it advances towards registrational studies in metastatic breast cancer and pancreatic cancer, both of which have received Fast Track designation from the FDA. For further information, please visit: https://www.oncolyticsbiotech.com or follow the company on social media on LinkedIn and on X @oncolytics.
Tecentriq® (atezolizumab) is a registered trademark of Genentech, a member of the Roche Group.
This press release contains forward-looking statements, within the meaning of Section 21E of the Securities Exchange Act of 1934, as amended and forward-looking information under applicable Canadian securities laws (such forward-looking statements and forward-looking information are collectively referred to herein as "forward-looking statements"). Forward-looking statements contained in this press release include statements regarding Oncolytics' belief as to the potential, mechanism of action and benefits of pelareorep as a cancer therapeutic; our belief that there are multiple clinical and regulatory options for bringing pelareorep to patients; and other statements related to anticipated developments in Oncolytics' business and technologies. In any forward-looking statement in which Oncolytics expresses an expectation or belief as to future results, such expectations or beliefs are expressed in good faith and are believed to have a reasonable basis, but there can be no assurance that the statement or expectation or belief will be achieved. Such forward-looking statements involve known and unknown risks and uncertainties, which could cause Oncolytics' actual results to differ materially from those in the forward-looking statements. Such risks and uncertainties include, among others, the availability of funds and resources to pursue research and development projects, the efficacy of pelareorep as a cancer treatment, the success and timely completion of clinical studies and trials, Oncolytics' ability to successfully commercialize pelareorep, uncertainties related to the research and development of pharmaceuticals, uncertainties related to the regulatory process and general changes to the economic environment. We may incur expenses or delays relating to events outside of our control, which could have a material adverse impact on our business, operating results and financial condition. Investors should consult Oncolytics' quarterly and annual filings with the Canadian and U.S. securities commissions for additional information on risks and uncertainties relating to the forward-looking statements. Investors are cautioned against placing undue reliance on forward-looking statements. The Company does not undertake any obligation to update these forward-looking statements, except as required by applicable laws.
Company Contact
Jon Patton
Director of IR & Communication
mailto://jpatton@oncolytics.ca
Investor Relations for Oncolytics
Timothy McCarthy
LifeSci Advisors
+1-917-679-9282
mailto://tim@lifesciadvisors.com
View original content: https://www.prnewswire.com/news-releases/oncolytics-biotech-to-present-promising-pelareorep-data-in-pancreatic-and-anal-cancers-at-asco-gi-symposium-302334441.html
SOURCE Oncolytics Biotech® Inc.
Paulness
3 months ago
NEWS -- Oncolytics Biotech® Reports Completion of Initial Safety Phase Enrollment for GOBLET Trial's New Pancreatic Cancer Cohort
Early safety and tolerability results from six randomized patients support continued enrollment of pelareorep combined with modified FOLFIRINOX, with or without atezolizumab
The study will begin with 30 patients, with an option to expand to an additional 34 participants
SAN DIEGO and CALGARY, AB, Dec. 3, 2024 /CNW/ -- Oncolytics Biotech® Inc. (NASDAQ: ONCY) (TSX: ONC), a leading clinical-stage company specializing in immunotherapy for oncology, today announced that the Data Safety Monitoring Board (DSMB) has recommended continued enrollment in Cohort 5 of the GOBLET study following their review of initial safety data. Enrollment in this cohort will resume pending final approval from the Paul Ehrlich Institute (PEI), Germany's medical regulatory body. Additional updates are expected in 2025, with safety data anticipated in the first half and initial efficacy results in the second half.
The GOBLET study is a Phase 1/2 randomized, open-label, multicenter trial using a Simon two-stage design to evaluate treatments across multiple gastrointestinal cancers. In cohort 5, the study is assessing pelareorep combined with modified FOLFIRINOX (mFOLFIRINOX), with or without atezolizumab (Tecentriq®), in patients with newly diagnosed pancreatic ductal adenocarcinoma (PDAC). This cohort is funded by a US$5 million Therapeutic Accelerator Award from the Pancreatic Cancer Action Network (PanCAN), an innovative program designed to speed up the development of new pancreatic cancer treatments.
"We see a promising opportunity for pelareorep to improve treatment options for PDAC patients," said Thomas Heineman, M.D., Ph.D., Chief Medical Officer at Oncolytics. "The current standard of care is primarily chemotherapy, such as gemcitabine + nab-paclitaxel or mFOLFIRINOX. Pelareorep has already shown synergy with gemcitabine, nab-paclitaxel, and atezolizumab in GOBLET Cohort 1, and demonstrating efficacy with mFOLFIRINOX would further establish its potential to benefit PDAC patients. This study also builds on Cohort 1 by evaluating pelareorep's ability to work with checkpoint inhibitors, which would be a major advance, especially as immune therapies provide little benefit in most patients with this 'cold' tumor."
About GOBLET Cohort 5
The mFOLFIRINOX cohort of the Phase 1/2 GOBLET study is designed to evaluate newly diagnosed PDAC patients treated with pelareorep + mFOLFIRINOX with or without atezolizumab. A three-patient safety run-in was incorporated to evaluate the safety and tolerability of each treatment arm: pelareorep + mFOLFIRINOX + atezolizumab and pelareorep + mFOLFIRINOX. A total of fifteen evaluable patients will be randomized to each arm in Stage 1 of this Simon two-stage study. The co-primary endpoints are objective response rate and safety. If Stage 1 success criteria are met, one or both treatment arms may be expanded to Stage 2, in which 17 additional evaluable patients per arm will be enrolled. Blood and tumor samples will also be collected for translational evaluations.
About GOBLET
The GOBLET (Gastrointestinal tumOrs exploring the treatment comBinations with the oncolytic reovirus peLarEorep and anTi-PD-L1) study is a phase 1/2 multiple indication study in advanced or metastatic gastrointestinal tumors. The study is being conducted at 17 centers in Germany and is being managed by AIO-Studien-gGmbH. The co-primary endpoints of the study are objective response rate (ORR) and/or disease control rate assessed at week 16 and safety. Key secondary and exploratory endpoints include additional efficacy assessments and evaluation of potential biomarkers. The study comprises five treatment groups:
Pelareorep in combination with atezolizumab, gemcitabine, and nab-paclitaxel in 1st line advanced/metastatic pancreatic cancer patients;
Pelareorep in combination with atezolizumab in 1st line MSI (microsatellite instability)-high metastatic colorectal cancer patients;
Pelareorep in combination with atezolizumab and TAS-102 in 3rd line metastatic colorectal cancer patients
Pelareorep in combination with atezolizumab in 2nd line advanced and unresectable anal cancer patients
Pelareorep in combination with mFOLFIRINOX with and without atezolizumab in newly diagnosed metastatic PDAC patients.Any cohort meeting pre-specified efficacy criteria in Stage 1 may be advanced to Stage 2 and enroll additional patients.
About AIO
AIO-Studien-gGmbH (AIO) emerged from the study center of the medical oncology working group within the German Cancer Society (DKG). AIO operates with a non-profit purpose of promoting science and research with a focus on medical oncology. Since its foundation, AIO has become a successful sponsor and study management company and has established itself both nationally and internationally.
About Oncolytics Biotech Inc.
Oncolytics is a clinical-stage biotechnology company developing pelareorep, an intravenously delivered immunotherapeutic agent. Pelareorep has demonstrated promising results in two randomized Phase 2 studies in metastatic breast cancer and Phase 1 and 2 studies in pancreatic cancer. It acts by inducing anti-cancer immune responses and promotes an inflamed tumor phenotype -- turning "cold" tumors "hot" -- through innate and adaptive immune responses to treat a variety of cancers.
Pelareorep has demonstrated synergies with multiple approved oncology treatments. Oncolytics is currently conducting and planning combination clinical trials with pelareorep in solid malignancies as it advances towards registrational studies in metastatic breast cancer and pancreatic cancer, both of which have received Fast Track designation from the FDA. For further information, please visit: https://www.oncolyticsbiotech.com or follow the company on social media on LinkedIn and on X @oncolytics.
Tecentriq® (atezolizumab) is a registered trademark of Genentech, a member of the Roche Group.
This press release contains forward-looking statements, within the meaning of Section 21E of the Securities Exchange Act of 1934, as amended and forward-looking information under applicable Canadian securities laws (such forward-looking statements and forward-looking information are collectively referred to herein as "forward-looking statements"). Forward-looking statements contained in this press release include statements regarding Oncolytics' belief as to the potential, mechanism of action and benefits of pelareorep as a cancer therapeutic; continued enrollment in the GOBLET study and the expansion thereof to additional participants; approval from the Paul Ehrlich Institute; additional updates being provided in 2025, including safety data and initial efficacy results; our belief that pelareorep is poised to advance to registration-enabling studies for the treatment of breast and pancreatic cancers; and other statements related to anticipated developments in Oncolytics' business and technologies. In any forward-looking statement in which Oncolytics expresses an expectation or belief as to future results, such expectations or beliefs are expressed in good faith and are believed to have a reasonable basis, but there can be no assurance that the statement or expectation or belief will be achieved. Such forward-looking statements involve known and unknown risks and uncertainties, which could cause Oncolytics' actual results to differ materially from those in the forward-looking statements. Such risks and uncertainties include, among others, the availability of funds and resources to pursue research and development projects, the efficacy of pelareorep as a cancer treatment, the success and timely completion of clinical studies and trials, Oncolytics' ability to successfully commercialize pelareorep, uncertainties related to the research and development of pharmaceuticals, uncertainties related to the regulatory process and general changes to the economic environment. We may incur expenses or delays relating to events outside of our control, which could have a material adverse impact on our business, operating results and financial condition. Investors should consult Oncolytics' quarterly and annual filings with the Canadian and U.S. securities commissions for additional information on risks and uncertainties relating to the forward-looking statements. Investors are cautioned against placing undue reliance on forward-looking statements. The Company does not undertake any obligation to update these forward-looking statements, except as required by applicable laws.
Company Contact
Jon Patton
Director of IR & Communication
mailto://jpatton@oncolytics.ca
Investor Relations for Oncolytics
Timothy McCarthy
LifeSci Advisors
+1-917-679-9282
mailto://tim@lifesciadvisors.com
View original content to download multimedia: https://www.prnewswire.com/news-releases/oncolytics-biotech-reports-completion-of-initial-safety-phase-enrollment-for-goblet-trials-new-pancreatic-cancer-cohort-302320744.html
SOURCE Oncolytics Biotech® Inc.
View original content to download multimedia: http://www.newswire.ca/en/releases/archive/December2024/03/c8763.html
Paulness
4 months ago
NEWS -- Oncolytics Biotech® to Host Conference Call to Discuss Third Quarter Financial Results and Recent Operational Highlights
Conference call and webcast to take place on Tuesday, November 12, 2024, at 8:30 a.m. ET
SAN DIEGO and CALGARY, AB, Nov. 11, 2024 /CNW/ -- Oncolytics Biotech® Inc. (NASDAQ: ONCY) (TSX: ONC), a leading clinical-stage company specializing in immunotherapy for oncology, today announced that it will host a conference call and webcast on Tuesday, November 12, 2024, at 8:30 a.m. ET to discuss a corporate update and financial results for the third quarter 2024.
Conference Call & Webcast
Date: Tuesday, November 12, 2024
Time: 8:30 a.m. ET
Dial In – North American Toll-Free: (888) 510-2154
Dial In – International: (437) 900-0527
RapidConnect: to join the conference call without operator assistance, please click here
Conference ID (if needed): 68336
Webcast: please click here
A webcast of the call will also be available on the Investor Relations page of Oncolytics' website, available by clicking here, and will be archived for three months. A dial-in replay will be available for one week and can be accessed by dialing (888) 660-6345 (North America) or (289) 819-1450 (International) and using replay code: 68336#.
About Oncolytics Biotech Inc.
Oncolytics is a clinical-stage biotechnology company developing pelareorep, an intravenously delivered immunotherapeutic agent. Pelareorep has demonstrated promising results in two randomized Phase 2 studies in metastatic breast cancer and Phase 1 and 2 studies in pancreatic cancer. It acts by inducing anti-cancer immune responses and promotes an inflamed tumor phenotype -- turning "cold" tumors "hot" -- through innate and adaptive immune responses to treat a variety of cancers.
Pelareorep has demonstrated synergies with multiple approved oncology treatments. Oncolytics is currently conducting and planning combination clinical trials with pelareorep in solid and hematological malignancies as it advances towards registrational studies in metastatic breast cancer and pancreatic cancer, both of which have received Fast Track designation from the FDA. For further information, please visit: https://www.oncolyticsbiotech.com or follow the company on social media on LinkedIn and on X @oncolytics.
Company Contact
Jon Patton
Director of IR & Communication
mailto://jpatton@oncolytics.ca
Investor Relations for Oncolytics
Timothy McCarthy
LifeSci Advisors
+1-917-679-9282
mailto://tim@lifesciadvisors.com
View original content to download multimedia:https://www.prnewswire.com/news-releases/oncolytics-biotech-to-host-conference-call-to-discuss-third-quarter-financial-results-and-recent-operational-highlights-302301016.html
SOURCE Oncolytics Biotech® Inc.
View original content to download multimedia: http://www.newswire.ca/en/releases/archive/November2024/11/c3901.html
Paulness
5 months ago
NEWS -- Oncolytics Biotech® Announces Key Progress and Upcoming Studies for Breast and Pancreatic Cancer Treatments, Prepares for FDA Accelerated Approval Path
Recent clinical efficacy results from the BRACELET-1 trial in HR+/HER2- breast cancer pave the way for a clinical study designed to support an accelerated approval
Key milestones in gastrointestinal cancer clinical trials expected in 2025, with potential for new registration-enabling studies
SAN DIEGO and CALGARY, AB, Oct. 4, 2024 /CNW/ -- Oncolytics Biotech® Inc. (NASDAQ: ONCY) (TSX: ONC), a leading clinical-stage company specializing in immunotherapy for oncology, is issuing a corporate update to provide investors with a deeper understanding of recent data and what is expected for 2025.
"We're excited by the recent BRACELET-1 results, which exceeded our expectations and substantiate the strong efficacy signal previously observed in breast cancer patients treated with pelareorep," said Wayne Pisano, Interim CEO and Chair of Oncolytics' Board of Directors. "Having treated well over 100 HR+/HER2- metastatic breast cancer patients in multiple clinical studies, these results provide the basis for a development path leading to an accelerated approval. The BRACELET-1 results, combined with recent feedback from the FDA, give us confidence in our development approach, and we look forward to initiating a clinical trial designed to support the approval of pelareorep as a novel breast cancer therapeutic."
Mr. Pisano continued, "The gastrointestinal cancer data also supports making pancreatic cancer a major priority for the company. To advance this development, we've established a collaboration with the Global Coalition for Adaptive Research (GCAR), and The Pancreatic Cancer Action Network (PanCAN) has provided us with the funding to further investigate pelareorep in pancreatic cancer through our GOBLET study. Having demonstrated pelareorep's efficacy across multiple cancer indications and with important data readouts and future studies on the horizon, I'm looking forward to these next few years of Oncolytics' growth and development."
Planned HR+/HER2- metastatic breast cancer study could open the door to an accelerated approval
The strong efficacy results from BRACELET-1 provide the foundation for a large Phase 2 study designed to support an accelerated approval. Early in 2025, we plan to submit to the FDA a pelareorep + paclitaxel combination therapy breast cancer trial. The study will enroll approximately 180 patients with HR+/HER2- advanced/metastatic breast cancer who have progressed on antibody-drug conjugates (ADCs) like Enhertu, who are not eligible for ADCs, or who cannot tolerate ADCs, which represents a patient population of approximately 55,000 patients in the US.1-4 The study design has sufficient statistical power to deliver a p-value of < 0.05 with a progression-free survival (PFS) benefit of =4.3 months. Notably, the BRACELET-1 study demonstrated a 5.7-month PFS benefit for the pelareorep + paclitaxel arm compared to chemotherapy alone, as detailed below. Enrollment in the registration-enabling study is expected to commence in the first half of 2025.
Thomas Heineman, M.D., Ph.D., Chief Medical Officer at Oncolytics, commented, "With the continuing evolution of breast cancer treatment, we have designed our breast cancer program with the guidance of leading experts in the field. Our first randomized study in breast cancer, IND-213, demonstrated the ability of pelareorep combination therapy to improve survival in heavily pre-treated patients with advanced or metastatic HR+/HER2- disease. The subsequent randomized BRACELET-1 study showed that pelareorep combination therapy could improve outcomes in HR+/HER2- breast cancer patients who had received prior CDK4/6 inhibitors. Based on the success of these studies, we are now ready to pursue a large phase 2 study powered to support an accelerated approval in the setting of ADC therapies such as Enhertu. Our plan is designed to obtain a regulatory approval with fewer patients, in a shorter time, and requiring less funding than traditional regulatory pathways. Our thorough understanding of pelareorep's mechanism of action makes us confident that pelareorep-based combination therapy will continue to deliver strong clinical benefits to HR+/HER2- breast cancer patients within the current treatment approach."
BRACELET-1 efficacy data in HR+/HER2- metastatic breast cancer
The recently reported final BRACELET-1 study results provide clear evidence of pelareorep's ability to improve outcomes in patients with advanced breast cancer (link to press release). Patients in the paclitaxel control arm had a median overall survival of 18.2 months. However, more than half of the patients in the pelareorep combination therapy arm were still alive at the time of the final survival analysis, resulting in a median overall survival of "Not Reached." A conservative estimate of median overall survival for the pelareorep arm is 32.1 months, demonstrating that pelareorep + paclitaxel delivered a greater than 12-month survival advantage compared to paclitaxel alone. This survival benefit is further illustrated by the 24-month overall survival rate, which showed that 64% of patients treated with pelareorep combination therapy survived at least 2 years compared to only 33% of patients treated with paclitaxel alone. In addition, final progression-free survival was 12.1 months for pelareorep + paclitaxel compared to 6.4 months for paclitaxel alone, yielding a benefit of 5.7 months.
Gastrointestinal cancer opportunities
We also anticipate continuing our development of pelareorep in gastrointestinal cancers. Once the master protocol has been finalized with GCAR for the pelareorep combination therapy, we intend to approach the FDA before the end of the year. This study is designed to produce registrational data. Additionally, we continue to evaluate pelareorep combination therapy in patients with anal cancer, building on the promising initial efficacy data in this patient population. If the expanded results continue to show a favorable efficacy signal, we anticipate moving directly to a registration-enabling study. Finally, we expect to provide updates on cohort 5 of the GOBLET study, which is investigating pelareorep in pancreatic cancer in combination with the chemotherapy modified FOLFIRINOX (mFOLFIRINOX) with or without atezolizumab. Positive results from this combination will bolster our opportunity in pancreatic cancer and potentially provide an additional registrational opportunity. The initial efficacy results from this cohort are expected in the second half of 2025.
Anticipated upcoming milestones
H1 2025: Initiate registrational study of pelareorep + paclitaxel in HR+/HER2- metastatic breast cancerH1 2025: Safety run-in data from cohort 5 of the GOBLET study, investigating pelareorep and mFOLFIRINOX with or without atezolizumab in newly diagnosed pancreatic cancerH1 2025: updated efficacy data from cohort 4 of the GOBLET study, investigating pelareorep and atezolizumab in second-line or later anal cancerH2 2025: Initial efficacy results from cohort 5 of the GOBLET study, investigating pelareorep and mFOLFIRINOX with or without atezolizumab in newly diagnosed pancreatic cancerReferences:
Gampenrieder, Simon Peter et al. "Landscape of HER2-low metastatic breast cancer (MBC): results from the Austrian AGMT_MBC-Registry." Breast cancer research : BCR vol. 23,1 112. 14 Dec. 2021, doi:10.1186/s13058-021-01492-x;Schettini, Francesco et al. "Clinical, pathological, and PAM50 gene expression features of HER2-low breast cancer." NPJ breast cancer vol. 7,1 1. 4 Jan. 2021, doi:10.1038/s41523-020-00208-2Mehta, Sandhya et al. "Prevalent of 'HER2 ultra-low' among patients with advanced breast cancer with historical IHC0 status." Journal of Clinical Oncology vol. 42, 16. 29 May 2024, doi.org/10.1200/JCO.2024.42.16_suppl.e1315;Tarantino, Paolo et al. "HER2-Low Breast Cancer: Pathological and Clinical Landscape." Journal of clinical oncology : official journal of the American Society of Clinical Oncology vol. 38,17 (2020): 1951-1962. doi:10.1200/JCO.19.02488; DESTINY-BREAST04; DESTINY-BREAST06About Oncolytics Biotech Inc.
Oncolytics is a clinical-stage biotechnology company developing pelareorep, an intravenously delivered immunotherapeutic agent. Pelareorep has demonstrated promising results in two randomized Phase 2 studies in metastatic breast cancer and Phase 1 and 2 studies in pancreatic cancer. It acts by inducing anti-cancer immune responses and promotes an inflamed tumor phenotype -- turning "cold" tumors "hot" -- through innate and adaptive immune responses to treat a variety of cancers.
Pelareorep has demonstrated synergies with multiple approved oncology treatments. Oncolytics is currently conducting and planning combination clinical trials with pelareorep in solid malignancies as it advances towards registrational studies in metastatic breast cancer and pancreatic cancer, both of which have received Fast Track designation from the FDA. For further information, please visit: https://www.oncolyticsbiotech.com or follow the company on social media on LinkedIn and on X @oncolytics.
This press release contains forward-looking statements, within the meaning of Section 21E of the Securities Exchange Act of 1934, as amended and forward-looking information under applicable Canadian securities laws (such forward-looking statements and forward-looking information are collectively referred to herein as "forward-looking statements"). Forward-looking statements contained in this press release include statements regarding Oncolytics' belief as to the potential, mechanism of action and benefits of pelareorep as a cancer therapeutic; our belief that our recent BRACELET-1 results provide the basis for a development path leading to an accelerated approval; our planned development approach for pelareorep; our belief that our gastrointestinal data supports making pancreatic cancer a major priority for Oncolytics; the design and objectives of our planned Phase 2 HR+/HER2- metastatic breast cancer study and the next steps related thereto and timing thereof; the design and objectives of our planned gastrointestinal study with GCAR and the next steps related thereto and timing thereof; our upcoming milestones and the anticipated timing thereof; our belief that pelareorep is poised to advance to registration-enabling studies for the treatment of breast and pancreatic cancers; and other statements related to anticipated developments in Oncolytics' business and technologies. In any forward-looking statement in which Oncolytics expresses an expectation or belief as to future results, such expectations or beliefs are expressed in good faith and are believed to have a reasonable basis, but there can be no assurance that the statement or expectation or belief will be achieved. Such forward-looking statements involve known and unknown risks and uncertainties, which could cause Oncolytics' actual results to differ materially from those in the forward-looking statements. Such risks and uncertainties include, among others, the availability of funds and resources to pursue research and development projects, the efficacy of pelareorep as a cancer treatment, the success and timely completion of clinical studies and trials, Oncolytics' ability to successfully commercialize pelareorep, uncertainties related to the research and development of pharmaceuticals, uncertainties related to the regulatory process and general changes to the economic environment. In particular, we may be impacted by business interruptions resulting from COVID-19 coronavirus, including operating, manufacturing supply chain, clinical trial and project development delays and disruptions, labour shortages, travel and shipping disruption, and shutdowns (including as a result of government regulation and prevention measures). It is unknown whether and how Oncolytics may be affected if the COVID-19 pandemic persists for an extended period of time. We may incur expenses or delays relating to such events outside of our control, which could have a material adverse impact on our business, operating results and financial condition. Investors should consult Oncolytics' quarterly and annual filings with the Canadian and U.S. securities commissions for additional information on risks and uncertainties relating to the forward-looking statements. Investors are cautioned against placing undue reliance on forward-looking statements. The Company does not undertake any obligation to update these forward-looking statements, except as required by applicable laws.
Company Contact
Jon Patton
Director of IR & Communication
mailto://jpatton@oncolytics.ca
Investor Relations for Oncolytics
Timothy McCarthy
LifeSci Advisors
+1-917-679-9282
mailto://tim@lifesciadvisors.com
Logo - https://mma.prnewswire.com/media/2408622/Oncolytics_Biotech_Inc_Logo.jpg
View original content to download multimedia: https://www.prnewswire.com/news-releases/oncolytics-biotech-announces-key-progress-and-upcoming-studies-for-breast-and-pancreatic-cancer-treatments-prepares-for-fda-accelerated-approval-path-302267617.html
SOURCE Oncolytics Biotech® Inc.
View original content to download multimedia: http://www.newswire.ca/en/releases/archive/October2024/04/c7780.html
Paulness
6 months ago
NEWS -- Oncolytics Biotech® to Participate in Fireside Chats at Two Investment Conferences in September
SAN DIEGO and CALGARY, AB, Sept. 6, 2024 /PRNewswire/ -- Oncolytics Biotech® Inc. (NASDAQ: ONCY) (TSX: ONC), a leading clinical-stage company specializing in immunotherapy for oncology, today announced that Chief Financial Officer Kirk Look will participate in a fireside chat at the H.C. Wainwright 26th Annual Global Investment Conference, which is taking place September 9-11, 2024 at the Lotte New York Palace Hotel in New York, NY. Chief Medical Officer Tom Heineman, M.D., Ph.D., will participate in a fireside chat at the 2024 Cantor Global Healthcare Conference, which is taking place September 17-19, 2024 at the InterContinental New York Barclay Hotel in New York, NY. Additional details on the fireside chats can be found below.
Event: H.C. Wainwright 26th Annual Global Investment Conference
Date: Wednesday, September 11, 2024
Time: 9:00 a.m. ET
Location: Lotte New York Palace Hotel, Holmes I Room - 4th Floor
Webcast Link: Available by clicking here
Event: Cantor 2024 Global Healthcare Conference
Date: Thursday, September 19, 2024
Time: 10:55 a.m. ET
Location: InterContinental New York Barclay Hotel, Track 6 Morgan Suite
Webcast Link: Available by clicking here
Company management will also be participating in one-on-one investor meetings at the conferences. To schedule a meeting, please submit a request on the conference website, contact your H.C. Wainwright or Cantor Fitzgerald representative, or email jpatton@oncolytics.ca.
Webcasts of the Company's presentations will also be available on the Investor Relations page of Oncolytics' website (LINK) and will be archived for three months.
About Oncolytics Biotech Inc.
Oncolytics is a clinical-stage biotechnology company developing pelareorep, an intravenously delivered immunotherapeutic agent. Pelareorep has demonstrated promising results in two randomized Phase 2 studies in metastatic breast cancer and Phase 1 and 2 studies in pancreatic cancer. It acts by inducing anti-cancer immune responses and promotes an inflamed tumor phenotype -- turning "cold" tumors "hot" -- through innate and adaptive immune responses to treat a variety of cancers.
Pelareorep has demonstrated synergies with multiple approved oncology treatments. Oncolytics is currently conducting and planning combination clinical trials with pelareorep in solid malignancies as it advances towards registrational studies in metastatic breast cancer and pancreatic cancer, both of which have received Fast Track designation from the FDA. For further information, please visit: https://www.oncolyticsbiotech.com or follow the company on social media on LinkedIn and on X @oncolytics.
Company Contact
Jon Patton
Director of IR & Communication
mailto://jpatton@oncolytics.ca
Investor Relations for Oncolytics
Timothy McCarthy
LifeSci Advisors
+1-917-679-9282
mailto://tim@lifesciadvisors.com
View original content: https://www.prnewswire.com/news-releases/oncolytics-biotech-to-participate-in-fireside-chats-at-two-investment-conferences-in-september-302240554.html
SOURCE Oncolytics Biotech® Inc.
Paulness
7 months ago
NEWS -- Oncolytics Biotech® to Participate in a Fireside Chat at Canaccord Genuity's 44th Annual Growth Conference
SAN DIEGO and CALGARY, AB, Aug. 2, 2024 /PRNewswire/ -- Oncolytics Biotech® Inc. (NASDAQ: ONCY) (TSX: ONC), a leading clinical-stage company specializing in immunotherapy for oncology, today announced that Chief Medical Officer Dr. Thomas Heineman will participate in a fireside chat at Canaccord Genuity's 44th Annual Growth Conference, which is taking place August 13-15, 2024 at the InterContinental Boston Hotel in Boston, MA. Additional details on the fireside chat can be found below.
Date: Tuesday, August 13, 2024
Time: 8:30 a.m. ET
Location: InterContinental Boston, Hutchinson Room
Webcast Link: Available by clicking here
Company management will also be participating in one-on-one investor meetings at the conference. To schedule a meeting, please submit a request on the conference website, contact your Canaccord representative, or email mailto://jpatton@oncolytics.ca.
A live webcast of the Company's presentation will also be available on the Investor Relations page of Oncolytics' website (LINK) and will be archived for three months.
About Oncolytics Biotech Inc.
Oncolytics is a clinical-stage biotechnology company developing pelareorep, an intravenously delivered immunotherapeutic agent. Pelareorep has demonstrated promising results in two randomized Phase 2 studies in metastatic breast cancer and Phase 1 and 2 studies in pancreatic cancer. It acts by inducing anti-cancer immune responses and promotes an inflamed tumor phenotype -- turning "cold" tumors "hot" -- through innate and adaptive immune responses to treat a variety of cancers.
Pelareorep has demonstrated synergies with multiple approved oncology treatments. Oncolytics is currently conducting and planning combination clinical trials with pelareorep in solid malignancies as it advances towards registrational studies in metastatic breast cancer and pancreatic cancer, both of which have received Fast Track designation from the FDA. For further information, please visit: https://www.oncolyticsbiotech.com or follow the company on social media on LinkedIn and on X @oncolytics.
Company Contact
Jon Patton
Director of IR & Communication
mailto://jpatton@oncolytics.ca
Investor Relations for Oncolytics
Timothy McCarthy
LifeSci Advisors
+1-917-679-9282
mailto://tim@lifesciadvisors.com
View original content: https://www.prnewswire.com/news-releases/oncolytics-biotech-to-participate-in-a-fireside-chat-at-canaccord-genuitys-44th-annual-growth-conference-302213197.html
SOURCE Oncolytics Biotech® Inc.
Paulness
7 months ago
NEWS -- Oncolytics Biotech® to Host Conference Call to Discuss Second Quarter Financial Results and Recent Operational Highlights
Conference call and webcast to take place on Thursday, August 1, 2024, at 4:30 p.m. ET
SAN DIEGO, Calif. and CALGARY, Alberta, July 24, 2024 /CNW/ -- Oncolytics Biotech® Inc. (NASDAQ: ONCY) (TSX: ONC), a leading clinical-stage company specializing in immunotherapy for oncology, today announced that it will host a conference call and webcast on Thursday, August 1, 2024, at 4:30 p.m. ET to discuss a corporate update and financial results for the second quarter 2024.
Conference Call & Webcast
Date: Thursday, August 1, 2024
Time: 4:30 p.m. ET
Dial In – North American Toll-Free: (800) 836-8184
Dial In – International: (646) 357-8785
RapidConnect: to join the conference call without operator assistance, please click here
Conference ID (if needed): 34386
Webcast: please click here
A webcast of the call will also be available on the Investor Relations page of Oncolytics' website, available by clicking here, and will be archived for three months. A dial-in replay will be available for one week and can be accessed by dialing (888) 660-6345 (North America) or (289) 819-1450 (International) and using replay code: 34386#.
About Oncolytics Biotech Inc.
Oncolytics is a clinical-stage biotechnology company developing pelareorep, an intravenously delivered immunotherapeutic agent. Pelareorep has demonstrated promising results in two randomized Phase 2 studies in metastatic breast cancer and Phase 1 and 2 studies in pancreatic cancer. It acts by inducing anti-cancer immune responses and promotes an inflamed tumor phenotype -- turning "cold" tumors "hot" -- through innate and adaptive immune responses to treat a variety of cancers.
Pelareorep has demonstrated synergies with multiple approved oncology treatments. Oncolytics is currently conducting and planning combination clinical trials with pelareorep in solid and hematological malignancies as it advances towards registrational studies in metastatic breast cancer and pancreatic cancer, both of which have received Fast Track designation from the FDA. For further information, please visit: https://www.oncolyticsbiotech.com or follow the company on social media on LinkedIn and on X @oncolytics.
Company Contact
Jon Patton
Director of IR & Communication
mailto://jpatton@oncolytics.ca
Investor Relations for Oncolytics
Timothy McCarthy
LifeSci Advisors
+1-917-679-9282
mailto://tim@lifesciadvisors.com
View original content: https://www.prnewswire.com/news-releases/oncolytics-biotech-to-host-conference-call-to-discuss-second-quarter-financial-results-and-recent-operational-highlights-302204603.html
SOURCE Oncolytics Biotech® Inc.
View original content: http://www.newswire.ca/en/releases/archive/July2024/24/c1327.html
Paulness
8 months ago
NEWS -- Oncolytics Biotech® Announces Productive FDA Type C Meeting on its Metastatic Breast Cancer Program
Clear path forward on key elements of the planned potential registration-enabling trial in HR+/HER2- metastatic breast cancer
On track to report overall survival results from the randomized HR+/HER2- metastatic breast cancer BRACELET-1 trial in H2 2024
SAN DIEGO and CALGARY, AB, June 27, 2024 /CNW/ -- Oncolytics Biotech® Inc. (NASDAQ: ONCY) (TSX: ONC), a leading clinical-stage company specializing in immunotherapeutics for oncology, today announced that the Company received productive feedback from its Type C meeting with the U.S. Food and Drug Administration (FDA), supporting the planned potential registration-enabling trial for pelareorep in HR+/HER2- metastatic breast cancer (mBC). The FDA supports progression-free survival as the primary endpoint of the study, with overall survival as a key secondary endpoint. The Company's proposed study will enroll patients who have failed hormonal therapy and have received no more than one line of antibody-drug conjugate (ADC) therapy.
"Aligning with the FDA on key design elements and objectives of our planned registrational trial for pelareorep marks a critical step towards bringing this innovative treatment to patients," said Thomas Heineman, M.D., Ph.D., Chief Medical Officer at Oncolytics. "Our de-risked program builds on compelling data and key learnings from two randomized studies, BRACELET-1 and IND-213, which demonstrated clinically meaningful benefit in patients receiving pelareorep and paclitaxel compared to paclitaxel alone. Additionally, translational data from the AWARE-1 study highlights pelareorep's immune-mediated mechanism of action in breast cancer patients. We are now well-positioned to deliver on our mission of making pelareorep available to breast cancer patients in need of better treatment options."
Wayne Pisano, Interim CEO and Chair of the Board of Oncolytics, commented, "We are appreciative of the thoughtful dialog with the FDA and are pleased to have reached an important regulatory milestone that provides a clear path forward for pelareorep's advancement towards registration in HR+/HER2- mBC. Looking ahead, initiating a registration-enabling trial has become a major corporate objective, and in parallel, we remain on track to report survival data from the BRACELET-1 study in HR+/HER2- mBC in the second half of the year. We believe these data will further bolster our compelling data package and underscores the therapeutic potential of pelareorep. We remain committed to improving the standard of care and addressing the high unmet medical needs of these patients."
About Oncolytics Biotech Inc.
Oncolytics is a clinical-stage biotechnology company developing pelareorep, an intravenously delivered immunotherapeutic agent. Pelareorep has demonstrated promising results in two randomized Phase 2 studies in metastatic breast cancer and Phase 1 and 2 studies in pancreatic cancer. It acts by inducing anti-cancer immune responses and promotes an inflamed tumor phenotype -- turning "cold" tumors "hot." This allows the anti-tumor immune cells, induced by pelareorep, to attack the cancer.
Pelareorep has demonstrated synergies with multiple approved oncology treatments. Oncolytics is currently conducting and planning combination clinical trials with pelareorep in solid and hematological malignancies as it advances towards registrational studies in metastatic breast cancer and pancreatic cancer, both of which have received Fast Track designation from the FDA. For further information, please visit: https://www.oncolyticsbiotech.com or follow the company on social media on LinkedIn and on X @oncolytics.
This press release contains forward-looking statements, within the meaning of Section 21E of the Securities Exchange Act of 1934, as amended and forward-looking information under applicable Canadian securities laws (such forward-looking statements and forward-looking information are collectively referred to herein as "forward-looking statements"). Forward-looking statements contained in this press release include Oncolytics' belief as to the potential, mechanism of action and benefits of pelareorep as a cancer therapeutic; our belief that we are now well-positioned to deliver on our mission of making pelareorep available to breast cancer patients in need of better treatment options; our belief that the outcome of the meeting with the FDA is an important regulatory milestone that provides a clear path forward for pelareorep's advancement towards registration in HR+/HER2- mBC; our corporate objective of initiating a registration-enabling trial; our belief that we remain on track to report survival data from the BRACELET-1 study in HR+/HER2- mBC in the second half of the year; our belief in the therapeutic potential of pelareorep; our commitment to improving the standard of care and addressing the high unmet medical needs of these patients; our plans to advance towards registrational studies in metastatic breast cancer and pancreatic cancer; and other statements related to anticipated developments in Oncolytics' business and technologies. In any forward-looking statement in which Oncolytics expresses an expectation or belief as to future results, such expectations or beliefs are expressed in good faith and are believed to have a reasonable basis, but there can be no assurance that the statement or expectation or belief will be achieved. Such forward-looking statements involve known and unknown risks and uncertainties, which could cause Oncolytics' actual results to differ materially from those in the forward-looking statements. Such risks and uncertainties include, among others, the availability of funds and resources to pursue research and development projects, the efficacy of pelareorep as a cancer treatment, the success and timely completion of clinical studies and trials, Oncolytics' ability to successfully commercialize pelareorep, uncertainties related to the research and development of pharmaceuticals, uncertainties related to the regulatory process and general changes to the economic environment. In particular, we may be impacted by business interruptions resulting from COVID-19 coronavirus, including operating, manufacturing supply chain, clinical trial and project development delays and disruptions, labour shortages, travel and shipping disruption, and shutdowns (including as a result of government regulation and prevention measures). We may incur expenses or delays relating to such events outside of our control, which could have a material adverse impact on our business, operating results and financial condition. Investors should consult Oncolytics' quarterly and annual filings with the Canadian and U.S. securities commissions for additional information on risks and uncertainties relating to the forward-looking statements. Investors are cautioned against placing undue reliance on forward-looking statements. The Company does not undertake any obligation to update these forward-looking statements, except as required by applicable laws.
Logo: https://mma.prnewswire.com/media/1762876/Oncolytics_Biotech_New_Logo.jpg
Company Contact
Jon Patton
Director of IR & Communication
mailto://jpatton@oncolytics.ca
Investor Relations for Oncolytics
Timothy McCarthy
LifeSci Advisors
+1-917-679-9282
mailto://tim@lifesciadvisors.com
View original content: https://www.prnewswire.com/news-releases/oncolytics-biotech-announces-productive-fda-type-c-meeting-on-its-metastatic-breast-cancer-program-302184357.html
SOURCE Oncolytics Biotech® Inc.
View original content: http://www.newswire.ca/en/releases/archive/June2024/27/c9211.html
Paulness
8 months ago
NEWS -- Oncolytics Biotech® Announces President and Chief Executive Officer Dr. Matt Coffey to Take Medical Leave of Absence
Wayne Pisano, Chair of Oncolytics' Board of Directors, to serve as interim CEO
Overall Survival data from BRACELET-1 breast cancer study continues to be expected in H2 2024
Pelareorep combination therapy advancing towards registration-enabling study in pancreatic cancer
SAN DIEGO and CALGARY, AB, June 24, 2024 /PRNewswire/ -- Oncolytics Biotech® Inc. (NASDAQ: ONCY) (TSX: ONC), a leading clinical-stage company specializing in immunotherapeutics for oncology, today announced that Matt Coffey, PhD, President and Chief Executive Officer of Oncolytics will take a medical leave of absence, effective immediately. Wayne Pisano, Chair of Oncolytics' Board of Directors, will serve as the interim CEO during Dr. Coffey's absence.
"On behalf of the Board, I would like to wish Matt a swift recovery. In the interim, the Board and I are highly confident in our tenured executive team's ability to continue executing our mission, achieve our strategic priorities, and drive forward our registration-enabling clinical plans for pelareorep, a differentiated and potentially leading immunotherapeutic agent in breast and pancreatic cancers," said Wayne Pisano, Chair of Oncolytics' Board of Directors. "Together, we will continue to deliver on our long-term goals to ultimately bring pelareorep to patients with cancer."
Wayne Pisano, Chair of the Board since 2013, has more than 30 years of experience as a pharmaceutical industry executive and over 12 years of experience in the biotech industry. Mr. Pisano served as the president of VaxInnate, a privately held biotech company, and has served as a Board Director of several biotech companies, including Provention Bio and Altimmune Inc. He served as Chairman of Provention Bio for four years, overseeing the company's acquisition by Sanofi in April 2023.
Mr. Pisano is the former President and CEO of Sanofi Pasteur, one of the largest vaccine companies in the world. He is credited with driving Sanofi Pasteur's leadership within the worldwide influenza market, capturing 50% of global sales. He also laid the foundation for the company's global pediatric vaccines strategy and bolstered the Sanofi Pasteur pipeline with the acquisition of Acambis PLC, a biotech based in Boston, in 2008 and Shantha Biotechnics, a highly regarded Indian vaccine company in 2010. Prior to joining Sanofi Pasteur, he spent 11 years with Novartis (formerly Sandoz). He has a bachelor's degree in biology from St. John Fisher University in New York and an MBA from the University of Dayton in Ohio.
About Oncolytics Biotech Inc.
Oncolytics is a clinical-stage biotechnology company developing pelareorep, an intravenously delivered immunotherapeutic agent. Pelareorep has demonstrated promising results in two randomized Phase 2 studies in metastatic breast cancer and Phase 1 and 2 studies in pancreatic cancer. It acts by inducing anti-cancer immune responses and promotes an inflamed tumor phenotype -- turning "cold" tumors "hot." This allows the anti-tumor immune cells, induced by pelareorep, to attack the cancer.
Pelareorep has demonstrated synergies with multiple approved oncology treatments. Oncolytics is currently conducting and planning combination clinical trials with pelareorep in solid and hematological malignancies as it advances towards registrational studies in metastatic breast cancer and pancreatic cancer, both of which have received Fast Track designation from the FDA. For further information, please visit: https://www.oncolyticsbiotech.com or follow the company on social media on LinkedIn and on X @oncolytics.
This press release contains forward-looking statements, within the meaning of Section 21E of the Securities Exchange Act of 1934, as amended and forward-looking information under applicable Canadian securities laws (such forward-looking statements and forward-looking information are collectively referred to herein as "forward-looking statements"). Forward-looking statements contained in this press release include Oncolytics' belief as to the potential, mechanism of action and benefits of pelareorep as a cancer therapeutic; our belief in our executive team's ability to continue executing our mission, achieve our strategic priorities and drive forward our registration-enabling clinical plans for pelareorep; our expectation that we will continue to deliver on our long-term goals to ultimately bring pelareorep to patients with cancer; our plans to advance towards registrational studies in metastatic breast cancer and pancreatic cancer; and other statements related to anticipated developments in Oncolytics' business and technologies. In any forward-looking statement in which Oncolytics expresses an expectation or belief as to future results, such expectations or beliefs are expressed in good faith and are believed to have a reasonable basis, but there can be no assurance that the statement or expectation or belief will be achieved. Such forward-looking statements involve known and unknown risks and uncertainties, which could cause Oncolytics' actual results to differ materially from those in the forward-looking statements. Such risks and uncertainties include, among others, the availability of funds and resources to pursue research and development projects, the efficacy of pelareorep as a cancer treatment, the success and timely completion of clinical studies and trials, Oncolytics' ability to successfully commercialize pelareorep, uncertainties related to the research and development of pharmaceuticals, uncertainties related to the regulatory process and general changes to the economic environment. We may incur expenses or delays relating to such events outside of our control, including public health crises such as pandemics and epidemics, which could have a material adverse impact on our business, operating results and financial condition. Investors should consult Oncolytics' quarterly and annual filings with the Canadian and U.S. securities commissions for additional information on risks and uncertainties relating to the forward-looking statements. Investors are cautioned against placing undue reliance on forward-looking statements. The Company does not undertake any obligation to update these forward-looking statements, except as required by applicable laws.
Company Contact
Jon Patton
Director of IR & Communication
mailto://jpatton@oncolytics.ca
Investor Relations for Oncolytics
Timothy McCarthy
LifeSci Advisors
+1-917-679-9282
mailto://tim@lifesciadvisors.com
Logo: https://mma.prnewswire.com/media/1762876/Oncolytics_Biotech_New_Logo.jpg
View original content: https://www.prnewswire.com/news-releases/oncolytics-biotech-announces-president-and-chief-executive-officer-dr-matt-coffey-to-take-medical-leave-of-absence-302180044.html
SOURCE Oncolytics Biotech® Inc.
Paulness
8 months ago
NEWS -- Oncolytics Biotech® Doses First Patient in Study of Pelareorep/FOLFIRINOX Combination Therapy in Pancreatic Cancer
Demonstrating pelareorep's synergy with modified FOLFIRINOX +/- atezolizumab in pancreatic cancer could expand the number of patients it may benefit
Funding for the study comes from the US$5 million Therapeutic Accelerator Award from PanCAN
SAN DIEGO, and CALGARY, AB, June 20, 2024 /PRNewswire/ -- Oncolytics Biotech® Inc. (NASDAQ: ONCY) (TSX: ONC), a leading clinical-stage company specializing in immunotherapeutics for oncology, announced the dosing of the first patient in the new GOBLET study cohort evaluating pelareorep and modified FOLFIRINOX (mFOLFIRINOX) with or without atezolizumab (Tecentriq®) in newly diagnosed metastatic pancreatic ductal adenocarcinoma (PDAC) patients. The co-primary endpoints of the cohort are objective response rate (ORR) and safety. It is supported by the US$5M Pancreatic Cancer Action Network (PanCAN) Therapeutic Accelerator Award, an innovative program established to accelerate the development of new treatments for pancreatic cancer patients. It will be conducted in collaboration with AIO-Studien-gGmbH (AIO), a clinical trial group within the German Cancer Society, as part of GOBLET, a Phase 1/2 multiple indication study evaluating pelareorep-based combinations in gastrointestinal cancers.
"Initiation of dosing in the mFOLFIRINOX cohort of the GOBLET study is an important milestone for Oncolytics, and we're excited to begin evaluating another pelareorep combination therapy that could result in a second pancreatic cancer registration program for the company," said Thomas Heineman, M.D., Ph.D., Chief Medical Officer at Oncolytics. "The combination of pelareorep, atezolizumab, gemcitabine, and nab-paclitaxel in pancreatic cancer patients more than doubled tumor response rates compared to earlier trials of chemotherapy alone. That combination received Fast Track Designation from the FDA and is expected to be evaluated in an adaptive registration-enabling trial through the Global Coalition for Adaptive Research (GCAR). If the combination of pelareorep and mFOLFIRINOX also demonstrates a promising efficacy signal, we could have two pancreatic cancer treatment regimens on the path to registration. I want to highlight PanCAN's important support for this program with gratitude. The US$5M Therapeutic Accelerator Award has made it possible for us to broaden our evaluation of potential therapies that have the potential to improve outcomes for pancreatic cancer patients."
Anna Berkenblit, MD, MMSc, Chief Scientific and Medical Officer at PanCAN said, "Working toward our vision to create a world in which all patients with pancreatic cancer will thrive, PanCAN launched the Therapeutic Accelerator Award to speed the drug development process and bring new options to patients faster. Dosing the first patient in this new cohort of the GOBLET study is an important step toward further evaluation of this investigational immunotherapeutic approach."
Dirk Arnold, M.D., Ph.D., Director of Asklepios Tumorzentrum Hamburg and primary investigator of the GOBLET trial commented, "I have been pleased to observe the strength of the clinical response data for pelareorep in multiple cohorts of the GOBLET gastrointestinal study, especially in pancreatic and anal cancer. mFOLFIRINOX is currently considered the best treatment option for many pancreatic cancer patients. Therefore, the evaluation of pelareorep and mFOLFIRINOX, with or without atezolizumab, presents an important opportunity to identify a novel therapeutic approach that may broaden the population of metastatic pancreatic cancer patients who could benefit from pelareorep-based therapies."
"Oncolytics is in a favorable position as we prepare to advance multiple pelareorep programs toward registration track studies and continue to expand pelareorep's potential as a backbone immunotherapy that can impact various tumor types. The collaboration with GCAR on a registration-enabling study for the combination of pelareorep, atezolizumab, gemcitabine, and nab-paclitaxel in pancreatic cancer, meeting with the FDA to align on next steps for our breast cancer program, expanded enrollment in the GOBLET anal cancer cohort, and now the initiation of dosing in the mFOLFIRINOX cohort of GOBLET, announced today, are all important elements of our corporate plan," said Dr. Matt Coffey, President and Chief Executive Officer of Oncolytics. "The ability to improve the lives of cancer patients is something that motivates everyone at Oncolytics, and beginning to treat pancreatic cancer patients in the mFOLFIRINOX cohort of GOBLET is hopefully yet another step towards that goal."
About GOBLET cohort 5
The mFOLFIRINOX cohort of the Phase 1/2 GOBLET study is designed to evaluate newly diagnosed PDAC patients treated with pelareorep + mFOLFIRINOX with or without atezolizumab. There will be a three-patient safety run-in to evaluate the tolerability of each treatment arm: pelareorep + mFOLFIRINOX + atezolizumab and pelareorep + mFOLFIRINOX. A total of fifteen evaluable patients will be randomized to each arm in Stage 1 of this Simon two-stage study. The co-primary endpoints are objective response rate and safety. If Stage 1 success criteria are met, one or both treatment arms may be expanded to Stage 2 in which 17 additional evaluable patients per arm will be enrolled. Blood and tumor samples will also be collected for translational evaluations.
About GOBLET
The GOBLET (Gastrointestinal tumOrs exploring the treatment comBinations with the oncolytic reovirus peLarEorep and anTi-PD-L1) study is a phase 1/2 multiple indication study in advanced or metastatic gastrointestinal tumors. The study is being conducted at 17 centers in Germany and is being managed by AIO-Studien-gGmbH. The co-primary endpoints of the study are objective response rate (ORR) and/or disease control rate assessed at week 16 and safety. Key secondary and exploratory endpoints include additional efficacy assessments and evaluation of potential biomarkers. The study comprises five treatment groups:
Pelareorep in combination with atezolizumab, gemcitabine, and nab-paclitaxel in 1st line advanced/metastatic pancreatic cancer patients;
Pelareorep in combination with atezolizumab in 1st line MSI (microsatellite instability)-high metastatic colorectal cancer patients;
Pelareorep in combination with atezolizumab and TAS-102 in 3rd line metastatic colorectal cancer patients
Pelareorep in combination with atezolizumab in 2nd line advanced and unresectable anal cancer patients; and
Pelareorep in combination with mFOLFIRINOX with and without atezolizumab in newly diagnosed metastatic PDAC patients.Any cohort meeting pre-specified efficacy criteria in Stage 1 may be advanced to Stage 2 and enroll additional patients.
About AIO
AIO-Studien-gGmbH (AIO) emerged from the study center of the medical oncology working group within the German Cancer Society (DKG). AIO operates with a non-profit purpose of promoting science and research with a focus on medical oncology. Since its foundation, AIO has become a successful sponsor and study management company and has established itself both nationally and internationally.
About Oncolytics Biotech Inc.
Oncolytics is a clinical-stage biotechnology company developing pelareorep, an intravenously delivered immunotherapeutic agent. Pelareorep has demonstrated promising results in two randomized Phase 2 studies in metastatic breast cancer and Phase 1 and 2 studies in pancreatic cancer. It acts by inducing anti-cancer immune responses and promotes an inflamed tumor phenotype -- turning "cold" tumors "hot" -- through innate and adaptive immune responses to treat a variety of cancers.
Pelareorep has demonstrated synergies with multiple approved oncology treatments. Oncolytics is currently conducting and planning combination clinical trials with pelareorep in solid and hematological malignancies as it advances towards registrational studies in metastatic breast cancer and pancreatic cancer, both of which have received Fast Track designation from the FDA. For further information, please visit: https://www.oncolyticsbiotech.com or follow the company on social media on LinkedIn and on X @oncolytics.
This press release contains forward-looking statements, within the meaning of Section 21E of the Securities Exchange Act of 1934, as amended and forward-looking information under applicable Canadian securities laws (such forward-looking statements and forward-looking information are collectively referred to herein as "forward-looking statements"). Forward-looking statements contained in this press release include Oncolytics' belief as to the potential, mechanism of action and benefits of pelareorep as a cancer therapeutic; the design, intent and potential benefits of the mFOLFIRINOX cohort of the GOBLET study; our belief that if the combination of pelareorep and mFOLFIRINOX also demonstrates a promising efficacy signal, the Company could have two pancreatic cancer treatment regimens on the path to registration; our corporate plan; the potential for expansion to Stage 2 if Stage 1 success criteria are met; our plans to advance towards registrational studies in metastatic breast cancer and pancreatic cancer; and other statements related to anticipated developments in Oncolytics' business and technologies. In any forward-looking statement in which Oncolytics expresses an expectation or belief as to future results, such expectations or beliefs are expressed in good faith and are believed to have a reasonable basis, but there can be no assurance that the statement or expectation or belief will be achieved. Such forward-looking statements involve known and unknown risks and uncertainties, which could cause Oncolytics' actual results to differ materially from those in the forward-looking statements. Such risks and uncertainties include, among others, the availability of funds and resources to pursue research and development projects, the efficacy of pelareorep as a cancer treatment, the success and timely completion of clinical studies and trials, Oncolytics' ability to successfully commercialize pelareorep, uncertainties related to the research and development of pharmaceuticals, uncertainties related to the regulatory process and general changes to the economic environment. In particular, we may be impacted by business interruptions resulting from COVID-19 coronavirus, including operating, manufacturing supply chain, clinical trial and project development delays and disruptions, labour shortages, travel and shipping disruption, and shutdowns (including as a result of government regulation and prevention measures). We may incur expenses or delays relating to such events outside of our control, which could have a material adverse impact on our business, operating results and financial condition. Investors should consult Oncolytics' quarterly and annual filings with the Canadian and U.S. securities commissions for additional information on risks and uncertainties relating to the forward-looking statements. Investors are cautioned against placing undue reliance on forward-looking statements. The Company does not undertake any obligation to update these forward-looking statements, except as required by applicable laws.
Company Contact
Jon Patton
Director of IR & Communication
mailto://jpatton@oncolytics.ca
Investor Relations for Oncolytics
Timothy McCarthy
LifeSci Advisors
+1-917-679-9282
mailto://tim@lifesciadvisors.com
View original content: https://www.prnewswire.com/news-releases/oncolytics-biotech-doses-first-patient-in-study-of-pelareorepfolfirinox-combination-therapy-in-pancreatic-cancer-302177901.html
SOURCE Oncolytics Biotech® Inc.
Paulness
9 months ago
NEWS -- Oncolytics Biotech® ASCO Abstracts Highlight Pelareorep's Potential in Pancreatic Cancer and Immunotherapeutic Mechanism of Action
Trial-in-progress abstract highlights new cohort that could expand the company's pancreatic cancer program
Pelareorep's ability to expand TILs highlights its immunotherapeutic mechanism of action and potential as a backbone immunotherapy for multiple indications
SAN DIEGO and CALGARY, AB, May 24, 2024 /CNW/ -- Oncolytics Biotech® Inc. (NASDAQ: ONCY) (TSX: ONC), a leading clinical-stage company specializing in immunotherapy for oncology, presented two abstracts at the 2024 American Society of Clinical Oncology (ASCO) Annual Meeting. One is a trial-in-progress abstract discussing cohort 5 of the GOBLET study, which will evaluate the combination of pelareorep and modified FOLFIRINOX (mFOLFIRINOX) with and without atezolizumab in newly diagnosed metastatic pancreatic ductal adenocarcinoma (PDAC) patients. The second describes pelareorep's ability to induce the expansion of tumor-infiltrating lymphocytes (TILs) across multiple cancers and the correlation between TIL expansion and tumor response. The ASCO annual meeting will take place from May 31 – June 4, 2024, in Chicago, Illinois.
"The two abstracts that we are sharing at ASCO this year are in synch with our mission of advancing pelareorep towards registrational trials. The first abstract outlines the design of a new GOBLET PDAC cohort that could significantly expand the potential of the company's pancreatic cancer program," said Dr. Matt Coffey, President and Chief Executive Officer of Oncolytics. "The chemotherapy regimens of mFOLFIRINOX and gemcitabine/nab-paclitaxel are the two most common standards of care in metastatic pancreatic cancer. We previously reported that the combination of pelareorep, gemcitabine, nab-paclitaxel, and atezolizumab yielded tumor response rates nearly triple historical results. Should the combination of pelareorep and mFOLFIRINOX produce a similarly positive outcome, an even broader range of metastatic PDAC patients may benefit from pelareorep-based therapy. This cohort is being funded by a US$5 million grant in the form of the Therapeutic Accelerator Award from the Pancreatic Cancer Action Network (PanCAN). We anticipate enrollment in this cohort will begin this quarter."
Thomas Heineman, MD, PhD, Chief Medical Officer of Oncolytics stated, "Pelareorep stimulates a proinflammatory response that primes tumors for immunologic killing and also activates both innate and adaptive immune responses. Our second ASCO abstract provides additional support for pelareorep's immunotherapeutic mechanism of action by describing its ability to stimulate the expansion of pre-existing and new TIL clones in the blood, which correlate with treatment response. These results build upon previously reported data from the AWARE-1 study in breast cancer to expand our understanding of pelareorep's immune-based mechanism of action, and it supports further investigation of TIL expansion as a potential biomarker of clinical activity in patients treated with pelareorep."
Details on the abstracts and poster presentation are shown below.
Title: Phase 1/2 randomized, open-label, multicenter, Simon two-stage study of pelareorep combined with modified FOLFIRINOX +/- atezolizumab in patients with metastatic pancreatic ductal adenocarcinoma.
Presentation Type: Poster
Abstract Number: TPS4203
Session Title: Gastrointestinal Cancer – Gastroesophageal, Pancreatic, and Hepatobiliary
Session Date and Time: June 1, 2024, 1:30 – 4:30 p.m. CT
A copy of the ASCO presentation will be available on the Media page of Oncolytics' website (LINK) following the conclusion of the meeting.
Highlights from the GOBLET cohort 5 abstract and poster include:
The study utilizes a Simon two-stage design to evaluate patients with newly diagnosed metastatic PDAC.
In Stage 1, 15 evaluable patients per arm will be randomized to receive either: 1) pelareorep + mFOLFIRINOX, or 2) pelareorep + mFOLFIRINOX + atezolizumab.
The co-primary endpoints are objective response rate and safety. Secondary and exploratory endpoints include additional efficacy assessments (e.g., progression-free and overall survival), and biomarker evaluations.
If Stage 1 success criteria are met, one or both treatment arms may be expanded to Stage 2, in which 17 additional evaluable patients per arm will be enrolled.
Blood and tumor samples are being collected for translational evaluations.Title: Pelareorep driven blood TIL expansion in patients with pancreatic, breast and colon cancer.
Presentation Type: Online abstract
Abstract Number: e14625
Highlights from the abstract include:
The presence and expansion of TILs are associated with a better prognosis and response to treatment in cancer patients.
Pelareorep treatment increased TIL expansion in the blood in all pancreatic, breast, and colorectal cancer patients evaluated after one cycle of treatment.
Pre-existing TIL clonal expansion in the blood appears to correlate with tumor responses in pancreatic cancer patients.
The addition of the PD-L1 inhibitor avelumab, unlike atezolizumab, eliminated pre-existing TIL expansion in the blood and reduced pelareorep's clinical activity.
These data suggest that pelareorep offers a simple, reliable way to expand TILs to provide clinical benefit.About GOBLET Cohort 5
The mFOLFIRINOX cohort of the Phase 1/2 GOBLET study is designed to evaluate newly diagnosed PDAC patients treated with pelareorep + mFOLFIRINOX with or without atezolizumab. There will be a three-patient safety run-in to evaluate the tolerability of each treatment arm: pelareorep + mFOLFIRINOX + atezolizumab and pelareorep + mFOLFIRINOX. A total of fifteen evaluable patients will be randomized to each arm in Stage 1 of this Simon two-stage study. The co-primary endpoints are objective response rate and safety. If Stage 1 success criteria are met, one or both treatment arms may be expanded to Stage 2, in which 17 additional evaluable patients per arm will be enrolled. Blood and tumor samples will also be collected for translational evaluations.
About GOBLET
The GOBLET (Gastrointestinal tumOrs exploring the treatment comBinations with the oncolytic reovirus peLarEorep and anTi-PD-L1) study is a phase 1/2 multiple indication study in advanced or metastatic gastrointestinal tumors. The study is being conducted at 12 centers in Germany and is being managed by AIO-Studien-gGmbH. The co-primary endpoints of the study are objective response rate (ORR) and/or disease control rate assessed at week 16 and safety. Key secondary and exploratory endpoints include additional efficacy assessments and evaluation of potential biomarkers (T cell clonality and CEACAM6). The study employs a Simon two-stage design with Stage 1 comprising five treatment groups:
Pelareorep in combination with atezolizumab, gemcitabine, and nab-paclitaxel in 1st line advanced/metastatic pancreatic cancer patients;
Pelareorep in combination with atezolizumab in 1st line MSI (microsatellite instability)-high metastatic colorectal cancer patients;
Pelareorep in combination with atezolizumab and TAS-102 in 3rd line metastatic colorectal cancer patients;
Pelareorep in combination with atezolizumab in 2nd line advanced and unresectable anal cancer patients; and
Pelareorep in combination with mFOLFIRINOX with and without atezolizumab in newly diagnosed metastatic PDAC patients.Any cohort meeting pre-specified efficacy criteria in Stage 1 may be advanced to Stage 2 and enroll additional patients.
About AIO
AIO-Studien-gGmbH (AIO) emerged from the study center of the medical oncology working group within the German Cancer Society (DKG). AIO operates with a non-profit purpose of promoting science and research with a focus on medical oncology. Since its foundation, AIO has become a successful sponsor and study management company and has established itself both nationally and internationally.
About Oncolytics Biotech Inc.
Oncolytics is a clinical-stage biotechnology company developing pelareorep, an intravenously delivered immunotherapeutic agent. Pelareorep has demonstrated promising results in two randomized Phase 2 studies in metastatic breast cancer and Phase 1 and 2 studies in pancreatic cancer. It acts by inducing anti-cancer immune responses and promotes an inflamed tumor phenotype -- turning "cold" tumors "hot" -- through innate and adaptive immune responses to treat a variety of cancers.
Pelareorep has demonstrated synergies with multiple approved oncology treatments. Oncolytics is currently conducting and planning combination clinical trials with pelareorep in solid and hematological malignancies as it advances towards registrational studies in metastatic breast cancer and pancreatic cancer, both of which have received Fast Track designation from the FDA. For further information, please visit: https://www.oncolyticsbiotech.com or follow the company on social media on LinkedIn and on X @oncolytics.
This press release contains forward-looking statements, within the meaning of Section 21E of the Securities Exchange Act of 1934, as amended and forward-looking information under applicable Canadian securities laws (such forward-looking statements and forward-looking information are collectively referred to herein as "forward-looking statements"). Forward-looking statements contained in this press release include statements regarding Oncolytics' belief as to the potential, mechanism of action and benefits of pelareorep as a cancer therapeutic; our stated mission of advancing pelareorep towards registrational trials; our belief that should the combination of pelareorep and mFOLFIRINOX produce a similarly positive outcome, an even broader range of metastatic PDAC patients may benefit from pelareorep-based therapy; our plans to advance towards registrational studies in metastatic breast cancer and pancreatic cancer; and other statements related to anticipated developments in Oncolytics' business and technologies. In any forward-looking statement in which Oncolytics expresses an expectation or belief as to future results, such expectations or beliefs are expressed in good faith and are believed to have a reasonable basis, but there can be no assurance that the statement or expectation or belief will be achieved. Such forward-looking statements involve known and unknown risks and uncertainties, which could cause Oncolytics' actual results to differ materially from those in the forward-looking statements. Such risks and uncertainties include, among others, the availability of funds and resources to pursue research and development projects, the efficacy of pelareorep as a cancer treatment, the success and timely completion of clinical studies and trials, Oncolytics' ability to successfully commercialize pelareorep, uncertainties related to the research and development of pharmaceuticals, uncertainties related to the regulatory process and general changes to the economic environment. We may incur expenses or delays relating to such events outside of our control, including public health crises such as pandemics and epidemics, which could have a material adverse impact on our business, operating results and financial condition. Investors should consult Oncolytics' quarterly and annual filings with the Canadian and U.S. securities commissions for additional information on risks and uncertainties relating to the forward-looking statements. Investors are cautioned against placing undue reliance on forward-looking statements. The Company does not undertake any obligation to update these forward-looking statements, except as required by applicable laws.
Company Contact
Jon Patton
Director of IR & Communication
mailto://jpatton@oncolytics.ca
Timothy McCarthy
LifeSci Advisors
+1-917-679-9282
mailto://tim@lifesciadvisors.com
Logo: https://mma.prnewswire.com/media/1762876/Oncolytics_Biotech_New_Logo.jpg
View original content: https://www.prnewswire.com/news-releases/oncolytics-biotech-asco-abstracts-highlight-pelareoreps-potential-in-pancreatic-cancer-and-immunotherapeutic-mechanism-of-action-302154957.html
SOURCE Oncolytics Biotech® Inc.
View original content: http://www.newswire.ca/en/releases/archive/May2024/24/c7469.html
Paulness
10 months ago
NEWS -- Oncolytics Biotech® Announces Voting Results from the Annual General Meeting of Shareholders
SAN DIEGO and CALGARY, AB, May 16, 2024 /PRNewswire/ -- Oncolytics Biotech® Inc. (NASDAQ: ONCY) (TSX: ONC), a leading clinical-stage company specializing in immunotherapy for oncology, today announced the voting results from its Annual General Meeting (AGM) of Shareholders held on Wednesday, May 15, 2024. A total of 41.34% of the issued and outstanding common shares of the Corporation were represented either in person or by proxy at the meeting.
On a vote by ballot, the eight nominees proposed by the Corporation were elected as Directors of Oncolytics to serve until the Corporation's next Annual Meeting of Shareholders or until their successors are elected or appointed, with shares represented at the meeting voting in favor of individual nominees as follows:
In addition to the election of all nominees listed as directors in the management information circular, dated March 24, 2024, Oncolytics shareholders approved all other resolutions placed before the meeting. These included fixing the number of directors of the Corporation for the ensuing year at eight and appointing the auditors for the Corporation for the ensuing year.
For more details on the matters covered at the annual meeting, please refer to the Corporation's management information circular available on SEDAR at https://www.sedar.com. Final voting results on all matters voted on at the annual meeting will also be filed on SEDAR.
About Oncolytics Biotech Inc.
Oncolytics is a clinical-stage biotechnology company developing pelareorep, an intravenously delivered immunotherapeutic agent. Pelareorep has demonstrated promising results in two randomized Phase 2 studies in metastatic breast cancer and Phase 1 and 2 studies in pancreatic cancer. It acts by inducing anti-cancer immune responses and promotes an inflamed tumor phenotype -- turning "cold" tumors "hot" -- through innate and adaptive immune responses to treat a variety of cancers.
Pelareorep has demonstrated synergies with multiple approved oncology treatments. Oncolytics is currently conducting and planning combination clinical trials with pelareorep in solid and hematological malignancies as it advances towards registrational studies in metastatic breast cancer and pancreatic cancer, both of which have received Fast Track designation from the FDA. For further information, please visit: https://www.oncolyticsbiotech.com or follow the company on social media on LinkedIn and on X @oncolytics.
Company Contact
Jon Patton
Director of IR & Communication
mailto://jpatton@oncolytics.ca
Investor Relations for Oncolytics
Timothy McCarthy
LifeSci Advisors
+1-917-679-9282
mailto://tim@lifesciadvisors.com
Logo: https://mma.prnewswire.com/media/1762876/Oncolytics_Biotech_New_Logo.jpg
SOURCE Oncolytics Biotech® Inc.
Paulness
10 months ago
NEWS -- Oncolytics Biotech® Announces Preliminary Collaboration with GCAR for Inclusion of Pelareorep in Anticipated Pancreatic Cancer Trial
Anticipated evaluation to include combination therapy featuring treatment regimen of checkpoint inhibition and chemotherapy utilized in cohort 1 of the GOBLET study
GCAR is launching a new master protocol for pancreatic cancer with the intent to create a registration-enabling pathway for investigational therapies
Innovative adaptive design could accelerate registrational study timeline and provide substantial cost savings compared to traditional trial designs
SAN DIEGO and CALGARY, AB, May 15, 2024 /CNW/ -- Oncolytics Biotech® Inc. (NASDAQ: ONCY) (TSX: ONC), a leading clinical-stage company specializing in immunotherapy for oncology, today announced that it has entered into a preliminary collaboration with the Global Coalition for Adaptive Research (GCAR). The purpose of the preliminary collaboration is to commence planning activities for the evaluation of pelareorep in the treatment of first-line metastatic pancreatic ductal adenocarcinoma (PDAC) as part of GCAR's anticipated master protocol for metastatic pancreatic cancer. Activities are currently underway to finalize the seamless Phase 2/3 master protocol design that will evaluate multiple investigational therapies for the treatment of pancreatic cancer. An intent of the study is to produce registration-enabling data.
"We are thrilled to collaborate with GCAR and are honored that pelareorep has been selected as the first therapeutic for evaluation in GCAR's planned adaptive trial in pancreatic cancer patients. We believe this opportunity presents a strategic and efficient pathway forward for the development of pelareorep to address an urgent need for pancreatic cancer patients," said Dr. Matt Coffey, President and Chief Executive Officer of Oncolytics. "GCAR's anticipated trial design seeks to cut registrational study time and reduce trial costs, speeding up the journey to potentially deliver effective cancer treatment sooner. Through our interactions with GCAR, we have seen the strength of their capabilities and strong engagement with disease experts in pancreatic cancer. These attributes give us great enthusiasm to begin working together right away."
Meredith Buxton, PhD, MPH, Chief Executive Officer and President of GCAR, commented, "Our unwavering mission at GCAR is to accelerate the development of treatments for patients with deadly diseases such as pancreatic cancer. We believe that adaptive platform trials have the potential to achieve that mission and to be game-changing for patients. We are enthusiastic about collaborating with Oncolytics on our planned pancreatic cancer initiative, which was announced earlier this year, and we look forward to working with Oncolytics to advance our program."
Thomas Heineman, MD, PhD, Chief Medical Officer of Oncolytics shared, "The combination of pelareorep's impressive results to date and GCAR's innovative trial design creates a powerful path forward. This strategy, which includes leveraging GCAR's extensive investigator network, enhances our ability to quickly and effectively advance the development of this pelareorep-based combination therapy for PDAC. Updated data from cohort 1 of the GOBLET study, presented at the European Society for Medical Oncology (ESMO) Congress 2023, showed that patients treated with pelareorep combined with a checkpoint inhibitor, gemcitabine, and nab-paclitaxel experienced a 62% objective response rate, nearly triple what has been seen in historical control trials.1-4 We hope to build on these results in GCAR's forthcoming study that will employ GCAR's broad and established network of clinical leaders in pancreatic cancer. I am very optimistic about our program and our collaboration with GCAR and look forward to advancing the evaluation of pelareorep as soon as possible."
About Global Coalition for Adaptive Research
The Global Coalition for Adaptive Research (GCAR) is a 501(c)(3) non-profit corporation uniting physicians, clinical researchers, advocacy and philanthropic organizations, biotech/pharma companies, health authorities, and other key stakeholders in healthcare to expedite the discovery and development of treatments for patients with rare and deadly diseases. As a sponsor of innovative trials, including master protocols and adaptive platform trials, GCAR is dedicated to the advancement of science by modernizing clinical trials that support more efficient, less costly drug development. Adaptive platform trials deliver an unmatched accelerated time from discovery in the lab to implementation in the clinic resulting in better treatments and lives saved. GCAR announced in January 2024 plans to build a platform trial, utilizing a master protocol, for first- and second-line pancreatic cancer in the coming year. To learn more about GCAR and its initiatives, visit https://www.gcaresearch.org/.
References
Von Hoff D et al. N Engl J Med 2013; 369:1691-1703 DOI: 10.1056/NEJMoa1304369O'Reilly et al. Eur J Cancer. 2020 June; 132: 112–121. DOI:10.1016/j.ejca.2020.03.005Karasic et al. JAMA Oncol. 2019 Jul 1; 5(7):993-998. DOI: 10.1001/jamaoncol.2019.0684Tempero et al. Ann Oncol. 2021 May; 32(5):600-608. DOI: 10.1016/j.annonc.2021.01.070About Oncolytics Biotech Inc.
Oncolytics is a clinical-stage biotechnology company developing pelareorep, an intravenously delivered immunotherapeutic agent. Pelareorep has demonstrated promising results in two randomized Phase 2 studies in metastatic breast cancer and Phase 1 and 2 studies in pancreatic cancer. It acts by inducing anti-cancer immune responses and promotes an inflamed tumor phenotype -- turning "cold" tumors "hot" -- through innate and adaptive immune responses to treat a variety of cancers.
Pelareorep has demonstrated synergies with multiple approved oncology treatments. Oncolytics is currently conducting and planning combination clinical trials with pelareorep in solid and hematological malignancies as it advances towards registrational studies in metastatic breast cancer and pancreatic cancer, both of which have received Fast Track designation from the FDA. For further information, please visit: https://www.oncolyticsbiotech.com or follow the company on social media on LinkedIn and on X @oncolytics.
This press release contains forward-looking statements, within the meaning of Section 21E of the Securities Exchange Act of 1934, as amended and forward-looking information under applicable Canadian securities laws (such forward-looking statements and forward-looking information are collectively referred to herein as "forward-looking statements"). Forward-looking statements contained in this press release include statements regarding Oncolytics' belief as to the potential and benefits of pelareorep as a cancer therapeutic; the design intent and anticipated benefits of the GCAR study; our belief that the GCAR opportunity presents a strategic and efficient pathway forward for the development of pelareorep to address an urgent need for pancreatic cancer patients; our plans to advance towards a registrational study in metastatic pancreatic cancer; and other statements related to anticipated developments in Oncolytics' business and technologies. In any forward-looking statement in which Oncolytics expresses an expectation or belief as to future results, such expectations or beliefs are expressed in good faith and are believed to have a reasonable basis, but there can be no assurance that the statement or expectation or belief will be achieved. Such forward-looking statements involve known and unknown risks and uncertainties, which could cause Oncolytics' actual results to differ materially from those in the forward-looking statements. Such risks and uncertainties include, among others, the availability of funds and resources to pursue research and development projects, the efficacy of pelareorep as a cancer treatment, the success and timely completion of clinical studies and trials, Oncolytics' ability to successfully commercialize pelareorep, uncertainties related to the research and development of pharmaceuticals, uncertainties related to the regulatory process and general changes to the economic environment. In particular, we may be impacted by business interruptions resulting from COVID-19 coronavirus, including operating, manufacturing supply chain, clinical trial and project development delays and disruptions, labour shortages, travel and shipping disruption, and shutdowns (including as a result of government regulation and prevention measures). It is unknown whether and how Oncolytics may be affected if the COVID-19 pandemic persists for an extended period of time. We may incur expenses or delays relating to such events outside of our control, which could have a material adverse impact on our business, operating results and financial condition. Investors should consult Oncolytics' quarterly and annual filings with the Canadian and U.S. securities commissions for additional information on risks and uncertainties relating to the forward-looking statements. Investors are cautioned against placing undue reliance on forward-looking statements. The Company does not undertake any obligation to update these forward-looking statements, except as required by applicable laws.
Company Contact
Jon Patton
Director of IR & Communication
mailto://jpatton@oncolytics.ca
Investor Relations for Oncolytics
Timothy McCarthy
LifeSci Advisors
+1-917-679-9282
mailto://tim@lifesciadvisors.com
Logo - https://mma.prnewswire.com/media/2408622/4706385/Oncolytics_Biotech_Inc_Logo.jpg
View original content to download multimedia: https://www.prnewswire.com/news-releases/oncolytics-biotech-announces-preliminary-collaboration-with-gcar-for-inclusion-of-pelareorep-in-anticipated-pancreatic-cancer-trial-302145440.html
SOURCE Oncolytics Biotech® Inc.
Paulness
10 months ago
NEWS -- Oncolytics Biotech® Receives Regulatory Clearance to Evaluate Pelareorep in Combination with Modified FOLFIRINOX +/- an anti-PD-L1 Inhibitor in Pancreatic Cancer
US$5 million PanCAN grant provides important support for the fifth cohort of the GOBLET study
Study of modified FOLFIRINOX/pelareorep/atezolizumab (Tecentriq®) combination expands existing pancreatic cancer program
First patient expected to be enrolled in Q2 2024
SAN DIEGO and CALGARY, AB, May 9, 2024 /CNW/ -- Oncolytics Biotech® Inc. (NASDAQ: ONCY) (TSX: ONC), a leading clinical-stage company specializing in immunotherapy for oncology, will commence enrollment into a new GOBLET study pancreatic cancer cohort following both German regulatory and ethics approvals. This cohort will evaluate pelareorep in combination with modified FOLFIRINOX (mFOLFIRINOX) with or without the PD-L1 immune checkpoint inhibitor atezolizumab (Tecentriq®) in newly diagnosed patients with pancreatic ductal adenocarcinoma (PDAC). It is supported by a US$5M Therapeutic Accelerator Award from the Pancreatic Cancer Action Network (PanCAN), an innovative program established to accelerate the development of new treatments for pancreatic cancer. The chemotherapy regimens of mFOLFIRINOX or gemcitabine + nab-paclitaxel are the two most common standards of care for pancreatic cancer.1 Oncolytics has already reported data with the combination of gemcitabine and nab-paclitaxel (link to the PR, link to the poster) that surpassed historical outcomes.2-5 Positive results from a combination with mFOLFIRINOX could greatly enhance pelareorep's potential in addressing pancreatic cancer.
"Oncolytics is pleased to announce receipt of regulatory clearance to initiate the mFOLFIRINOX cohort in patients with newly diagnosed metastatic PDAC. We appreciate the opportunity to collaborate with PanCAN, Roche, and AIO on this cohort, which is expected to initiate enrollment in the second quarter," said Dr. Matt Coffey, President and Chief Executive Officer of Oncolytics. "We believe that working with PanCAN will help to further enrich Oncolytics' clinical relationships with the pancreatic cancer community. We are also grateful for PanCAN's Therapeutic Accelerator Award, which is enabling the evaluation of this combination therapy."
"The Therapeutic Accelerator Award program has been an important part of PanCAN's approach to advancing innovative treatments for pancreatic cancer. We incorporated input from leading scientists and clinicians in the field of pancreatic cancer to select Oncolytics as a recipient of this award," said Anna Berkenblit, MD, MMSc, Chief Scientific and Medical Officer at PanCAN. "Increasing patient access to clinical trials is vital to developing improved treatment options, so we are pleased that Oncolytics has received regulatory clearance for the pelareorep/mFOLFIRINOX combination and is poised to enroll the first patient in this cohort. We hope that the results from this study lead to improved outcomes for patients with pancreatic cancer."
Dirk Arnold, M.D., Ph.D., Director of Asklepios Tumorzentrum Hamburg and primary investigator of the GOBLET trial, commented, "Oncolytics has taken a very strategic approach to the development of pelareorep in pancreatic cancer by focusing its clinical studies on combinations with the most widely used treatment regimens. My experience to date with the GOBLET study, including the positive metastatic PDAC and encouraging anal cancer data reported last year, makes me enthusiastic to initiate enrollment in the mFOLFIRINOX cohort."
"We previously reported very encouraging results in pancreatic cancer patients for the combination of pelareorep, gemcitabine/nab-paclitaxel, and atezolizumab, and we plan to begin a registration-enabling study of this regimen later this year. The new pelareorep/mFOLFIRINOX cohort offers the opportunity to expand pelareorep's role in pancreatic cancer. If the mFOLFIRINOX combination shows a compelling efficacy signal, this therapeutic approach could also be advanced to a registration-enabling study, providing two opportunities for pelareorep-based treatment to benefit pancreatic cancer patients," said Thomas Heineman, M.D., Ph.D., Chief Medical Officer at Oncolytics. "In addition, translational research studies planned for this cohort will help to further elucidate pelareorep's mechanism of action, including its ability to shape the tumor microenvironment (TME). Notably, we will evaluate the correlation between tumor responses and the expansion of tumor-infiltrating lymphocytes (TILs) in the blood, an effect that was observed in earlier pancreatic cancer studies. We look forward to initiating enrollment into the mFOLFIRINOX/pelareorep study cohort in the second quarter of this year."
References
Botta G, et al. SWI/SNF complex alterations as a biomarker of immunotherapy efficacy in pancreatic cancer. JCI Insight. 2021;6(18):e150453. https://doi.org/10.1172/jci.insight.150453
Von Hoff D et al. N Engl J Med 2013; 369:1691-1703 DOI: 10.1056/NEJMoa1304369
O'Reilly et al. Eur J Cancer. 2020 June; 132: 112–121. DOI:10.1016/j.ejca.2020.03.005
Karasic et al. JAMA Oncol. 2019 Jul 1; 5(7):993-998. DOI: 10.1001/jamaoncol.2019.0684
Tempero et al. Ann Oncol. 2021 May; 32(5):600-608. DOI: 10.1016/j.annonc.2021.01.070About GOBLET Cohort 5
The mFOLFIRINOX cohort of the Phase 1/2 GOBLET study is designed to evaluate newly diagnosed PDAC patients treated with pelareorep + mFOLFIRINOX with or without atezolizumab. There will be a three-patient safety run-in to evaluate the tolerability of each treatment arm: pelareorep + mFOLFIRINOX + atezolizumab and pelareorep + mFOLFIRINOX. A total of fifteen evaluable patients will be randomized to each arm in Stage 1 of this Simon-two stage study. The co-primary endpoints are objective response rate and safety. If Stage 1 success criteria are met, one or both treatment arms may be expanded to Stage 2 in which 17 additional evaluable patients per arm will be enrolled. Blood and tumor samples will also be collected for translational evaluations.
About GOBLET
The GOBLET (Gastrointestinal tumOrs exploring the treatment comBinations with the oncolytic reovirus peLarEorep and anTi-PD-L1) study is a phase 1/2 multiple indication study in advanced or metastatic gastrointestinal tumors. The study is being conducted at 12 centers in Germany and is being managed by AIO-Studien-gGmbH. The co-primary endpoints of the study are objective response rate (ORR) and/or disease control rate assessed at week 16 and safety. Key secondary and exploratory endpoints include additional efficacy assessments and evaluation of potential biomarkers (T cell clonality and CEACAM6). The study employs a Simon two-stage design with Stage 1 comprising five treatment groups:
Pelareorep in combination with atezolizumab, gemcitabine, and nab-paclitaxel in 1st line advanced/metastatic pancreatic cancer patients;
Pelareorep in combination with atezolizumab in 1st line MSI (microsatellite instability)-high metastatic colorectal cancer patients;
Pelareorep in combination with atezolizumab and TAS-102 in 3rd line metastatic colorectal cancer patients;
Pelareorep in combination with atezolizumab in 2nd line advanced and unresectable anal cancer patients; and
Pelareorep in combination with mFOLFIRINOX with and without atezolizumab in newly diagnosed metastatic PDAC patients.Any cohort meeting pre-specified efficacy criteria in Stage 1 may be advanced to Stage 2 and enroll additional patients.
About AIO
AIO-Studien-gGmbH (AIO) emerged from the study center of the medical oncology working group within the German Cancer Society (DKG). AIO operates with a non-profit purpose of promoting science and research with a focus on medical oncology. Since its foundation, AIO has become a successful sponsor and study management company and has established itself both nationally and internationally.
About Oncolytics Biotech Inc.
Oncolytics is a clinical-stage biotechnology company developing pelareorep, an intravenously delivered immunotherapeutic agent. Pelareorep has demonstrated promising results in two randomized Phase 2 studies in metastatic breast cancer and Phase 1 and 2 studies in pancreatic cancer. It acts by inducing anti-cancer immune responses and promotes an inflamed tumor phenotype -- turning "cold" tumors "hot" -- through innate and adaptive immune responses to treat a variety of cancers.
Pelareorep has demonstrated synergies with multiple approved oncology treatments. Oncolytics is currently conducting and planning combination clinical trials with pelareorep in solid and hematological malignancies as it advances towards registrational studies in metastatic breast cancer and pancreatic cancer, both of which have received Fast Track designation from the FDA. For further information, please visit: https://www.oncolyticsbiotech.com or follow the company on social media on LinkedIn and on X @oncolytics.
This press release contains forward-looking statements, within the meaning of Section 21E of the Securities Exchange Act of 1934, as amended and forward-looking information under applicable Canadian securities laws (such forward-looking statements and forward-looking information are collectively referred to herein as "forward-looking statements"). Forward-looking statements contained in this press release include Oncolytics' belief as to the potential, mechanism of action and benefits of pelareorep as a cancer therapeutic; our stated goals, objectives and mission; the commencement of enrollment into our new GOBLET study pancreatic cancer cohort and the timing thereof; our belief that positive results from a combination of pelareorep and mFOLFIRINOX could greatly enhance pelareorep's potential in addressing pancreatic cancer, including potentially advancing the approach to a registration-enabling study; our plans to advance towards registrational studies in metastatic breast cancer and pancreatic cancer; and other statements related to anticipated developments in Oncolytics' business and technologies. In any forward-looking statement in which Oncolytics expresses an expectation or belief as to future results, such expectations or beliefs are expressed in good faith and are believed to have a reasonable basis, but there can be no assurance that the statement or expectation or belief will be achieved. Such forward-looking statements involve known and unknown risks and uncertainties, which could cause Oncolytics' actual results to differ materially from those in the forward-looking statements. Such risks and uncertainties include, among others, the availability of funds and resources to pursue research and development projects, the efficacy of pelareorep as a cancer treatment, the success and timely completion of clinical studies and trials, Oncolytics' ability to successfully commercialize pelareorep, uncertainties related to the research and development of pharmaceuticals, uncertainties related to the regulatory process and general changes to the economic environment. In particular, we may be impacted by business interruptions resulting from COVID-19 coronavirus, including operating, manufacturing supply chain, clinical trial and project development delays and disruptions, labour shortages, travel and shipping disruption, and shutdowns (including as a result of government regulation and prevention measures). We may incur expenses or delays relating to such events outside of our control, which could have a material adverse impact on our business, operating results and financial condition. Investors should consult Oncolytics' quarterly and annual filings with the Canadian and U.S. securities commissions for additional information on risks and uncertainties relating to the forward-looking statements. Investors are cautioned against placing undue reliance on forward-looking statements. The Company does not undertake any obligation to update these forward-looking statements, except as required by applicable laws.
Company Contact
Jon Patton
Director of IR & Communication
mailto://jpatton@oncolytics.ca
Investor Relations for Oncolytics
Timothy McCarthy
LifeSci Advisors
+1-917-679-9282
mailto://tim@lifesciadvisors.com
Logo: https://mma.prnewswire.com/media/2408622/Oncolytics_Biotech_Inc_Logo.jpg
View original content to download multimedia: https://www.prnewswire.com/news-releases/oncolytics-biotech-receives-regulatory-clearance-to-evaluate-pelareorep-in-combination-with-modified-folfirinox---an-anti-pd-l1-inhibitor-in-pancreatic-cancer-302140992.html
SOURCE Oncolytics Biotech® Inc.
View original content to download multimedia: http://www.newswire.ca/en/releases/archive/May2024/09/c9118.html
Paulness
10 months ago
NEWS -- Oncolytics Biotech® to Participate in a Fireside Chat at the 2024 RBC Capital Markets Global Healthcare Conference
SAN DIEGO and CALGARY, AB, May 8, 2024 /PRNewswire/ -- Oncolytics Biotech® Inc. (NASDAQ: ONCY) (TSX: ONC), a leading clinical-stage company specializing in immunotherapy for oncology, today announced that Dr. Matt Coffey, President and Chief Executive Officer, will participate in a fireside chat at the 2024 RBC Capital Markets Global Healthcare Conference, which is taking place May 14-15, 2024 at the InterContinental New York Barclay in New York, NY. Additional details on the fireside chat can be found below.
Date: Wednesday, May 15, 2024
Time: 10:30 a.m. ET
Location: InterContinental New York Barclay Grand Ballroom I, 2nd Floor
Webcast Link: Available by clicking here
Company management will also be participating in one-on-one investor meetings at the conference. To schedule a meeting, contact your RBC representative or email mailto://jpatton@oncolytics.ca.
A live webcast of the Company's presentation will also be available on the Investor Relations page of Oncolytics' website (LINK) and will be archived until August 13, 2024.
About Oncolytics Biotech Inc.
Oncolytics is a clinical-stage biotechnology company developing pelareorep, an intravenously delivered immunotherapeutic agent. Pelareorep has demonstrated promising results in two randomized Phase 2 studies in metastatic breast cancer and Phase 1 and 2 studies in pancreatic cancer. It acts by inducing anti-cancer immune responses and promotes an inflamed tumor phenotype -- turning "cold" tumors "hot" -- through innate and adaptive immune responses to treat a variety of cancers.
Pelareorep has demonstrated synergies with multiple approved oncology treatments. Oncolytics is currently conducting and planning combination clinical trials with pelareorep in solid and hematological malignancies as it advances towards registrational studies in metastatic breast cancer and pancreatic cancer, both of which have received Fast Track designation from the FDA. For further information, please visit: https://www.oncolyticsbiotech.com or follow the company on social media on LinkedIn and on X @oncolytics.
Contacts:
Company Contact
Jon Patton
Director of IR & Communication
mailto://jpatton@oncolytics.ca
Investor Relations for Oncolytics
Timothy McCarthy
LifeSci Advisors
+1-917-679-9282
mailto://tim@lifesciadvisors.com
Logo: https://mma.prnewswire.com/media/1762876/Oncolytics_Biotech_New_Logo.jpg
View original content: https://www.prnewswire.com/news-releases/oncolytics-biotech-to-participate-in-a-fireside-chat-at-the-2024-rbc-capital-markets-global-healthcare-conference-302139526.html
SOURCE Oncolytics Biotech® Inc.
Paulness
10 months ago
NEWS -- Oncolytics Biotech® to Host Conference Call to Discuss First Quarter Financial Results and Recent Operational Highlights
CNW Group
Conference call and webcast to take place on Thursday, May 9, 2024, at 4:30 p.m. ET
SAN DIEGO and CALGARY, AB, April 30, 2024 /CNW/ -- Oncolytics Biotech® Inc. (NASDAQ: ONCY) (TSX: ONC), a leading clinical-stage company specializing in immunotherapy for oncology, today announced that it will host a conference call and webcast on Thursday, May 9, 2024, at 4:30 p.m. ET to discuss a corporate update and financial results for the first quarter 2024.
Conference Call & Webcast
Date: Thursday, May 9, 2024
Time: 4:30 p.m. ET
Dial In – North American Toll-Free: (800) 836-8184
Dial In – International: (289) 819-1350
RapidConnect: to join the conference call without operator assistance, please click here
Conference ID (if needed): 77797
Webcast: please click here
A webcast of the call will also be available on the Investor Relations page of Oncolytics' website, available by clicking here, and will be archived for three months. A dial-in replay will be available for one week and can be accessed by dialing (888) 660-6345 (North America) or (289) 819-1450 (International) and using replay code: 77797#.
About Oncolytics Biotech Inc.
Oncolytics is a clinical-stage biotechnology company developing pelareorep, an intravenously delivered immunotherapeutic agent. Pelareorep has demonstrated promising results in two randomized Phase 2 studies in metastatic breast cancer and Phase 1 and 2 studies in pancreatic cancer. It acts by inducing anti-cancer immune responses and promotes an inflamed tumor phenotype -- turning "cold" tumors "hot" -- through innate and adaptive immune responses to treat a variety of cancers.
Pelareorep has demonstrated synergies with multiple approved oncology treatments. Oncolytics is currently conducting and planning combination clinical trials with pelareorep in solid and hematological malignancies as it advances towards registrational studies in metastatic breast cancer and pancreatic cancer, both of which have received Fast Track designation from the FDA. For further information, please visit: https://www.oncolyticsbiotech.com or follow the company on social media on LinkedIn and on X @oncolytics.
Company Contact
Jon Patton
Director of IR & Communication
mailto://jpatton@oncolytics.ca
Investor Relations for Oncolytics
Timothy McCarthy
LifeSci Advisors
+1-917-679-9282
mailto://tim@lifesciadvisors.com
Logo - https://mma.prnewswire.com/media/1762876/Oncolytics_Biotech_New_Logo.jpg
View original content to download multimedia: https://www.prnewswire.com/news-releases/oncolytics-biotech-to-host-conference-call-to-discuss-first-quarter-financial-results-and-recent-operational-highlights-302131344.html
SOURCE Oncolytics Biotech® Inc.
Paulness
10 months ago
NEWS -- Oncolytics Biotech® Announces Upcoming Presentations at the American Society of Clinical Oncology Annual Meeting
SAN DIEGO and CALGARY, AB, April 25, 2024 /PRNewswire/ -- Oncolytics Biotech® Inc. (NASDAQ: ONCY) (TSX: ONC), a leading clinical-stage company specializing in immunotherapy for oncology, today announced the acceptance of two abstracts at the 2024 American Society of Clinical Oncology (ASCO) Annual Meeting, which is taking place from May 31 – June 4, 2024, in Chicago, Illinois. Details on the abstracts and poster presentation are shown below.
Title: Phase 1/2 randomized, open-label, multicenter, Simon two-stage study of pelareorep combined with modified FOLFIRINOX +/- atezolizumab in patients with metastatic pancreatic ductal adenocarcinoma.
Presentation Type: Poster
Abstract Number: TPS4203
Session Title: Gastrointestinal Cancer – Gastroesophageal, Pancreatic, and Hepatobiliary
Session Date and Time: June 1, 2024, 1:30 – 4:30 p.m. CT
Title: Pelareorep driven blood TIL expansion in patients with pancreatic, breast and colon cancer.
Presentation Type: Online abstract
Abstract Number: e14625
Abstracts will be published on the ASCO Annual Meeting website at 5:00 p.m. ET on May 23, 2024.
About Oncolytics Biotech Inc.
Oncolytics is a clinical-stage biotechnology company developing pelareorep, an intravenously delivered immunotherapeutic agent. Pelareorep has demonstrated promising results in two randomized Phase 2 studies in metastatic breast cancer and Phase 1 and 2 studies in pancreatic cancer. It acts by inducing anti-cancer immune responses and promotes an inflamed tumor phenotype -- turning "cold" tumors "hot" -- through innate and adaptive immune responses to treat a variety of cancers.
Pelareorep has demonstrated synergies with multiple approved oncology treatments. Oncolytics is currently conducting and planning combination clinical trials with pelareorep in solid and hematological malignancies as it advances towards registrational studies in metastatic breast cancer and pancreatic cancer, both of which have received Fast Track designation from the FDA. For further information, please visit: https://www.oncolyticsbiotech.com or follow the company on social media on LinkedIn and on X @oncolytics.
Company Contact
Jon Patton
Director of IR & Communication
jpatton@oncolytics.ca
Investor Relations for Oncolytics
Timothy McCarthy
LifeSci Advisors
+1-917-679-9282
tim@lifesciadvisors.com
View original content: https://www.prnewswire.com/news-releases/oncolytics-biotech-announces-upcoming-presentations-at-the-american-society-of-clinical-oncology-annual-meeting-302127249.html
SOURCE Oncolytics Biotech® Inc.
Paulness
11 months ago
NEWS -- Oncolytics Biotech® Advances Toward Registration-Enabling Trial for Pelareorep in Breast Cancer with Submission of Type C Meeting Request to FDA
Requested for Q2 2024, the Type C meeting is to focus on planned registration-enabling trial in HR+/HER2- metastatic breast cancerOverall survival results from the randomized HR+/HER2- metastatic breast cancer BRACELET-1 trial expected in H2 2024SAN DIEGO and CALGARY, AB, April 11, 2024 /PRNewswire/ -- Oncolytics Biotech® Inc. (NASDAQ: ONCY) (TSX: ONC), a leading clinical-stage company specializing in immunotherapeutics for oncology, is pleased to announce the submission of a Type C meeting request to the FDA. This meeting aims to discuss the Company's planned registration-enabling trial for pelareorep in HR+/HER2- metastatic breast cancer (mBC).
"A key focus for Oncolytics in 2024 is defining the regulatory path for pelareorep in breast cancer treatment. We are optimistic that pelareorep, in combination with paclitaxel, could significantly enhance clinical outcomes for patients with HR+/HER2- metastatic breast cancer. Our position is strengthened by encouraging data from two randomized studies (BRACELET-1 and IND-213) and the AWARE-1 study, paving the way for the next phase of pelareorep's development and its registration. Ongoing discussions with our clinical collaborators and partners have helped us to prepare a robust, compelling briefing document," said Dr. Matt Coffey, President and Chief Executive Officer of Oncolytics. "We eagerly anticipate our discussion with the FDA to align on the design and objectives of the registrational trial for pelareorep in metastatic breast cancer, a critical step towards bringing this innovative treatment to patients. Having a well-defined plan for the registrational track study will also help advance our strategic partnering discussions. We hope to meet with the agency in Q2 2024 and look forward to a productive dialogue. With anticipated overall survival data from the BRACELET-1 study and productive discussions with the FDA, 2024 is poised to be a transformative year for Oncolytics and our stakeholders."
Thomas Heineman, M.D., Ph.D., Chief Medical Officer at Oncolytics, added, "The data from the randomized BRACELET-1 trial showcased compelling results for the pelareorep/paclitaxel combination therapy in HR+/HER2- metastatic breast cancer patients, with a nearly tripled confirmed response rate, a 50% improvement in median progression-free survival, and a hazard ratio of 0.29 compared to the paclitaxel alone control. Importantly, these data support the statistically significant near doubling of median overall survival in another randomized phase 2 study, IND-213, which also evaluated pelareorep and paclitaxel in HR+/HER2- metastatic breast cancer patients."
Dr. Heineman continued, "Our proposed study plans to evaluate pelareorep in patients with HR+/HER2- mBC who are eligible for chemotherapy after progressing on prior hormonal therapy, including a CDK 4/6 inhibitor. We also intend to evaluate potential biomarkers, including the expansion of tumor-infiltrating lymphocytes, using T cell receptor sequencing. We look forward to the opportunity to discuss our plans with the agency and align on the best approach to advance the development of pelareorep as a potential treatment option to improve outcomes for breast cancer patients."
About Oncolytics Biotech Inc.
Oncolytics is a clinical-stage biotechnology company developing pelareorep, an intravenously delivered immunotherapeutic agent. Pelareorep has demonstrated promising results in Phase 2 studies in breast and pancreatic cancers. It acts by inducing anti-cancer immune responses and promotes an inflamed tumor phenotype -- turning "cold" tumors "hot" -- through innate and adaptive immune responses to treat a variety of cancers.
Pelareorep has demonstrated synergies with multiple approved oncology treatments. Oncolytics is currently conducting and planning combination clinical trials with pelareorep in solid and hematological malignancies as it advances towards registrational studies in metastatic breast cancer and pancreatic cancer, both of which have received Fast Track designation from the FDA. For further information, please visit: https://www.oncolyticsbiotech.com or follow the company on social media on LinkedIn and on X @oncolytics.
This press release contains forward-looking statements, within the meaning of Section 21E of the Securities Exchange Act of 1934, as amended and forward-looking information under applicable Canadian securities laws (such forward-looking statements and forward-looking information are collectively referred to herein as "forward-looking statements"). Forward-looking statements contained in this press release include Oncolytics' belief as to the potential, mechanism of action and benefits of pelareorep as a cancer therapeutic; our plans for a meeting with the FDA in relation to the Company's planned registration-enabling trial for pelareorep in patients with HR+/HER-2 mBC and the anticipated timing thereof; our focus in 2024; our belief that 2024 is poised to be a transformative year for Oncolytics and its stakeholders; the design and areas of evaluation for our proposed study of pelareorep in patients with HR+/HER-2 mBC; our plans to advance towards registrational studies in metastatic breast cancer and pancreatic cancer; and other statements related to anticipated developments in Oncolytics' business and technologies. In any forward-looking statement in which Oncolytics expresses an expectation or belief as to future results, such expectations or beliefs are expressed in good faith and are believed to have a reasonable basis, but there can be no assurance that the statement or expectation or belief will be achieved. Such forward-looking statements involve known and unknown risks and uncertainties, which could cause Oncolytics' actual results to differ materially from those in the forward-looking statements. Such risks and uncertainties include, among others, the availability of funds and resources to pursue research and development projects, the efficacy of pelareorep as a cancer treatment, the success and timely completion of clinical studies and trials, Oncolytics' ability to successfully commercialize pelareorep, uncertainties related to the research and development of pharmaceuticals, uncertainties related to the regulatory process and general changes to the economic environment. We may incur expenses or delays relating to such events outside of our control, including public health crises such as pandemics and epidemics, which could have a material adverse impact on our business, operating results and financial condition. Investors should consult Oncolytics' quarterly and annual filings with the Canadian and U.S. securities commissions for additional information on risks and uncertainties relating to the forward-looking statements. Investors are cautioned against placing undue reliance on forward-looking statements. The Company does not undertake any obligation to update these forward-looking statements, except as required by applicable laws.
Company Contact
Jon Patton
Director of IR & Communication
mailto://jpatton@oncolytics.ca
Investor Relations for Oncolytics
Timothy McCarthy
LifeSci Advisors
+1-917-679-9282
mailto://tim@lifesciadvisors.com
View original content: https://www.prnewswire.com/news-releases/oncolytics-biotech-advances-toward-registration-enabling-trial-for-pelareorep-in-breast-cancer-with-submission-of-type-c-meeting-request-to-fda-302113665.html
SOURCE Oncolytics Biotech® Inc.
Paulness
12 months ago
NEWS -- Oncolytics Biotech® Files Amendment to Initiate New Pancreatic Cancer GOBLET Cohort Supported by PanCAN
US$5M grant supports study of pelareorep in combination with modified FOLFIRINOX +/- atezolizumab
Testing with the most common therapies could facilitate broad use of pelareorep in pancreatic cancer patients
SAN DIEGO and CALGARY, AB, March 5, 2024 /CNW/ -- Oncolytics Biotech® Inc. (NASDAQ: ONCY) (TSX: ONC), a clinical-stage immunotherapeutics company focused on oncology, today announced it has submitted an amendment to GOBLET to initiate a new Phase 1/2 cohort evaluating pelareorep in combination with modified FOLFIRINOX (mFOLFIRINOX) with and without atezolizumab (Tecentriq®) in patients with newly diagnosed metastatic pancreatic ductal adenocarcinoma (PDAC). This amendment will be reviewed by the Paul Ehrlich Institute (PEI; Germany's regulatory body) for approval before patient enrollment can begin. The cohort, the fifth of the GOBLET gastrointestinal cancer study, is being supported by the US$5 million Therapeutic Accelerator Award from the Pancreatic Cancer Action Network (PanCAN), an innovative program established to accelerate the development of new treatments for pancreatic cancer. Evaluation of this novel treatment approach will complement Oncolytics' ongoing development of pelareorep, atezolizumab, gemcitabine, and nab-paclitaxel in PDAC, which is expected to advance to a registrational study later this year.
"We are enthusiastic to have the support of PanCAN to expand the evaluation of pelareorep in pancreatic cancer and explore mFOLFIRINOX as another combination that could improve outcomes for patients. Notably, this patient population is newly diagnosed patients who are receiving first-line treatment. Chemotherapies, including either mFOLFIRINOX or gemcitabine and nab-paclitaxel, are the backbone treatment regimens of pancreatic cancer therapy1. Evaluating pelareorep in combination with these widely used regimens is an important step in our broad clinical development program," said Dr. Matt Coffey, President and Chief Executive Officer of Oncolytics. "Last fall, we reported a 62% objective response rate for the GOBLET PDAC cohort studying pelareorep in combination with the checkpoint inhibitor atezolizumab in addition to gemcitabine and nab-paclitaxel (link to the PR, link to the poster). This response is about three times that of historical controls and forms the basis of the registrational program, expected to begin this year. Therefore, we are enthusiastic about this new mFOLFIRINOX pancreatic cancer cohort and look forward to enrolling the first patient as soon as possible."
Dirk Arnold, M.D., Ph.D., Director of Asklepios Tumorzentrum Hamburg, and primary investigator of the GOBLET trial, commented, "One of the reasons for pancreatic cancer's poor survival rate is that it effectively evades the immune system and can induce an immunosuppressive tumor microenvironment (TME)2. Pelareorep is an attractive combination partner because of its ability to address both issues by activating the innate and adaptive immune systems while driving the remodeling of the tumor microenvironment. Positive results from the Phase 2 study evaluating pelareorep combined with atezolizumab and chemotherapy reported last fall support the potential use of these agents together. I am hopeful that the combination of pelareorep and mFOLFIRINOX (with or without atezolizumab) will yield positive response data and advance the development of new treatment options for patients with pancreatic cancer."
"This study is designed to evaluate whether pelareorep can enhance outcomes in patients receiving mFOLFIRINOX, one of the most commonly used metastatic pancreatic cancer treatments. Combining pelareorep with mFOLFIRINOX represents an expansion of our existing pancreatic cancer program and maximizes the potential of pelareorep-based combination therapies to benefit pancreatic cancer patients," commented Thomas Heineman, M.D., Ph.D., Chief Medical Officer at Oncolytics. "The mFOLFIRINOX cohort utilizes a screened selection design within a Simon two-stage approach that will also allow evaluation of the contribution of atezolizumab to the pelareorep/mFOLFIRINOX combination. In addition, this study is designed to provide valuable translational assessments, such as the expansion of tumor-infiltrating lymphocytes (TILs) in the blood, which has been associated with tumor responses. We look forward to building on PanCAN's strong relationships with the pancreatic cancer community and furthering our collaboration with AIO-Studien-gGmbH (AIO) on the GOBLET study."
References
1. Botta G, et al. SWI/SNF complex alterations as a biomarker of immunotherapy efficacy in pancreatic cancer. JCI Insight. 2021;6(18):e150453. https://doi.org/10.1172/jci.insight.150453.
2. Yoon JH, et al. Immunotherapy for pancreatic cancer. World J Clin Cases. 2021 May 6;9(13):2969-2982. doi: 10.12998/wjcc.v9.i13.2969. PMID: 33969083; PMCID: PMC8080736.
About GOBLET cohort 5
The mFOLFIRINOX cohort of the Phase 1/2 GOBLET study is designed to evaluate newly diagnosed PDAC patients treated with pelareorep + mFOLFIRINOX with or without atezolizumab. There will be a three-patient safety run-in to evaluate the tolerability of each treatment arm - pelareorep + mFOLFIRINOX + atezolizumab and pelareorep + mFOLFIRINOX. A total of fifteen patients may be randomized to each arm in Stage one of the Simon-two stage design. The co-primary endpoints of the cohort are objective response rate and safety. The success criteria for Stage 1 is defined as six or more responses in one or both of the treatment groups. Successful completion of Stage one will support expansion into Stage two, which can include one or both treatment regimens, and would enroll 17 additional evaluable patients. A total of 13 or more responses from Stage 1 and 2 combined are required to achieve the success criteria. Translational data will also be generated.
About GOBLET
The GOBLET (Gastrointestinal tumOrs exploring the treatment comBinations with the oncolytic reovirus peLarEorep and anTi-PD-L1) study is a phase 1/2 multiple indication study in advanced or metastatic gastrointestinal tumors. The study is being conducted at 12 centers in Germany and is being managed by AIO-Studien-gGmbH. The co-primary endpoints of the study are objective response rate (ORR) and/or disease control rate assessed at week 16 and safety. Key secondary and exploratory endpoints include additional efficacy assessments and evaluation of potential biomarkers (T cell clonality and CEACAM6). The study employs a Simon two-stage design with Stage 1 comprising five treatment groups:
1. Pelareorep in combination with atezolizumab, gemcitabine, and nab-paclitaxel in 1st line advanced/metastatic pancreatic cancer patients;
2. Pelareorep in combination with atezolizumab in 1st line MSI (microsatellite instability)-high metastatic colorectal cancer patients;
3. Pelareorep in combination with atezolizumab and TAS-102 in 3rd line metastatic colorectal cancer patients
4. Pelareorep in combination with atezolizumab in 2nd line advanced and unresectable anal cancer patients; and
5. Pelareorep in combination with mFOLFIRINOX with and without atezolizumab in newly diagnosed metastatic PDAC patients.
Any cohort meeting pre-specified efficacy criteria in Stage 1 may be advanced to Stage 2 and enroll additional patients.
About AIO
AIO-Studien-gGmbH (AIO) emerged from the study center of the internal oncology working group within the German Cancer Society (DKG). AIO operates with a non-profit purpose of promoting science and research with a focus on medical oncology. Since its foundation, AIO has become a successful sponsor and study management company and has established itself both nationally and internationally.
About Oncolytics Biotech Inc.
Oncolytics is a clinical-stage biotechnology company developing pelareorep, an intravenously delivered immunotherapeutic agent. Pelareorep has demonstrated promising results in Phase 2 studies in breast and pancreatic cancers. It acts by inducing anti-cancer immune responses and promotes an inflamed tumor phenotype -- turning "cold" tumors "hot" -- through innate and adaptive immune responses to treat a variety of cancers.
Pelareorep has demonstrated synergies with multiple approved oncology treatments. Oncolytics is currently conducting and planning combination clinical trials with pelareorep in solid and hematological malignancies as it advances towards registrational studies in metastatic breast cancer and pancreatic cancer, both of which have received Fast Track designation from the FDA. For further information, please visit: https://www.oncolyticsbiotech.com or follow the company on social media on LinkedIn and on X @oncolytics.
This press release contains forward-looking statements, within the meaning of Section 21E of the Securities Exchange Act of 1934, as amended and forward-looking information under applicable Canadian securities laws (such forward-looking statements and forward-looking information are collectively referred to herein as "forward-looking statements"). Forward-looking statements contained in this press release include Oncolytics' belief as to the potential, mechanism of action and benefits of pelareorep as a cancer therapeutic; our stated goals, objectives and mission; our belief that pelareorep in combination with mFOLFIRINOX could improve outcomes for pancreatic cancer patients and advance the development of new treatment options for patients with pancreatic cancer; our plans to build on PanCAN's strong relationships with the pancreatic cancer community and further our collaboration with AIO-Studien-gGmbH on our GOBLET study; our plans to advance towards registrational studies in metastatic breast cancer and pancreatic cancer; and other statements related to anticipated developments in Oncolytics' business and technologies. In any forward-looking statement in which Oncolytics expresses an expectation or belief as to future results, such expectations or beliefs are expressed in good faith and are believed to have a reasonable basis, but there can be no assurance that the statement or expectation or belief will be achieved. Such forward-looking statements involve known and unknown risks and uncertainties, which could cause Oncolytics' actual results to differ materially from those in the forward-looking statements. Such risks and uncertainties include, among others, the availability of funds and resources to pursue research and development projects, the efficacy of pelareorep as a cancer treatment, the success and timely completion of clinical studies and trials, Oncolytics' ability to successfully commercialize pelareorep, uncertainties related to the research and development of pharmaceuticals, uncertainties related to the regulatory process and general changes to the economic environment. In particular, we may be impacted by business interruptions resulting from COVID-19 coronavirus, including operating, manufacturing supply chain, clinical trial and project development delays and disruptions, labour shortages, travel and shipping disruption, and shutdowns (including as a result of government regulation and prevention measures). We may incur expenses or delays relating to such events outside of our control, which could have a material adverse impact on our business, operating results and financial condition. Investors should consult Oncolytics' quarterly and annual filings with the Canadian and U.S. securities commissions for additional information on risks and uncertainties relating to the forward-looking statements. Investors are cautioned against placing undue reliance on forward-looking statements. The Company does not undertake any obligation to update these forward-looking statements, except as required by applicable laws.
Company Contact
Jon Patton
Director of IR & Communication
+1-858-886-7813
mailto://jpatton@oncolytics.ca
Investor Relations for Oncolytics
Timothy McCarthy
LifeSci Advisors
+1-917-679-9282
mailto://tim@lifesciadvisors.com
View original content to download multimedia: https://www.prnewswire.com/news-releases/oncolytics-biotech-files-amendment-to-initiate-new-pancreatic-cancer-goblet-cohort-supported-by-pancan-302079547.html
SOURCE Oncolytics Biotech® Inc.
View original content to download multimedia: http://www.newswire.ca/en/releases/archive/March2024/05/c7756.html
Paulness
12 months ago
NEWS -- Oncolytics Biotech® to Host Conference Call to Discuss Fourth Quarter and Full Year Financial Results and Recent Operational Highlights
Conference call and webcast to take place on Thursday, March 7, 2024, at 4:30 p.m. ET
SAN DIEGO and CALGARY, AB, March 4, 2024 /CNW/ -- Oncolytics Biotech® Inc. (NASDAQ: ONCY) (TSX: ONC), a clinical-stage immunotherapeutics company focused on oncology, today announced that it will host a conference call and webcast on Thursday, March 7, 2024, at 4:30 p.m. ET to discuss a corporate update and financial results for the fourth quarter and full year 2023.
Conference Call & Webcast
Date: Thursday, March 7, 2024
Time: 4:30 p.m. ET
Dial In – North American Toll-Free: (888) 664-6383
Dial In – International: (416) 764-8650
RapidConnect: to join the conference call without operator assistance, please click here
Conference ID (if needed): 6244-5815
Webcast: please click here
A webcast of the call will also be available on the Investor Relations page of Oncolytics' website, available by clicking here, and will be archived for three months. A dial-in replay will be available for one week and can be accessed by dialing (888) 390-0541 (North America) or (416) 764-8677 (International) and using replay code: 445-815#.
About Oncolytics Biotech Inc.
Oncolytics is a clinical-stage biotechnology company developing pelareorep, an intravenously delivered immunotherapeutic agent. Pelareorep has demonstrated promising results in Phase 2 studies in breast and pancreatic cancers. It acts by inducing anti-cancer immune responses and promotes an inflamed tumor phenotype -- turning "cold" tumors "hot" -- through innate and adaptive immune responses to treat a variety of cancers.
Pelareorep has demonstrated synergies with multiple approved oncology treatments. Oncolytics is currently conducting and planning combination clinical trials with pelareorep in solid and hematological malignancies as it advances towards registrational studies in metastatic breast cancer and pancreatic cancer, both of which have received Fast Track designation from the FDA. For further information, please visit: https://www.oncolyticsbiotech.com or follow the company on social media on LinkedIn and on X @oncolytics.
Company Contact
Jon Patton
Director of IR & Communication
+1-858-886-7813
mailto://jpatton@oncolytics.ca
Investor Relations for Oncolytics
Timothy McCarthy
LifeSci Advisors
+1-917-679-9282
mailto://tim@lifesciadvisors.com
View original content: https://www.prnewswire.com/news-releases/oncolytics-biotech-to-host-conference-call-to-discuss-fourth-quarter-and-full-year-financial-results-and-recent-operational-highlights-302078051.html
SOURCE Oncolytics Biotech® Inc.
View original content: http://www.newswire.ca/en/releases/archive/March2024/04/c8901.html
Paulness
1 year ago
NEWS -- Oncolytics Biotech® Initiates Enrollment Expansion of GOBLET Anal Cancer Cohort
Successful Stage 1 data showed a near tripling of Objective Response Rate compared to checkpoint inhibitor monotherapy, including a Complete Response, and supports expansion
SAN DIEGO and CALGARY, Alberta, Feb. 14, 2024 /CNW/ -- Oncolytics Biotech® Inc. (NASDAQ: ONCY) (TSX: ONC), a clinical-stage immunotherapeutics company focused on oncology, today announced the expansion of enrollment for the anal cancer cohort of the GOBLET study evaluating pelareorep in combination with atezolizumab (Tecentriq®) in patients with second-line or later unresectable squamous cell carcinoma of the anal canal (SCCA). The study was expanded based on positive data from Stage 1 of the study, presented at the 2nd International Multidisciplinary Anal Cancer Conference (IMACC) in November 2023 (link to the PR, link to the poster).
"These exciting clinical data, which exceed the Simon two-stage success criteria, provide strong support to expand the evaluation of pelareorep in patients with advanced anal cancer. The results reported at IMACC 2023 showed that the combination of pelareorep and atezolizumab provided a 37.5% objective response rate, including one patient with a long-lasting complete response, and good overall tolerability. These data represent a meaningful contrast to recent clinical trial results which show that patients with second-line or later anal carcinoma treated with checkpoint inhibitor therapy experienced response rates of 10-14%1-3," said Dr. Matt Coffey, President and Chief Executive Officer of Oncolytics."
"We begin the Stage 2 expansion with substantial optimism for patients and the potential of pelareorep, especially considering the initial efficacy signal observed for pelareorep-based therapy in pancreatic cancer. There is currently no established standard therapy for patients with anal carcinoma who have failed first-line treatment. Continued positive results could potentially expand the opportunity for pelareorep beyond the lead indications of breast cancer and pancreatic cancer and open the door to a rapid regulatory pathway in this rare and significantly under-served patient population," continued Dr. Coffey.
Dirk Arnold, M.D., Ph.D., Director of Asklepios Tumorzentrum Hamburg, and primary investigator of the GOBLET trial, commented, "One of the most difficult challenges in my practice is the limited number of treatment options that are available for patients with advanced anal cancer who have progressed on first-line therapy. I am enthusiastic about the expansion of this cohort because it will enable the continued evaluation of the pelareorep/atezolizumab combination and could provide important confirmatory data that may lead to better treatment options for patients with this late-stage disease."
"We look forward to building on the oncology community's enthusiastic reception of the IMACC 2023 data by expanding enrollment in the anal carcinoma cohort and incorporating additional sites into the study," commented Thomas Heineman, M.D., Ph.D., Chief Medical Officer at Oncolytics. "Careful consideration of recently published clinical trial results indicates that a modest expansion of fewer than 20 patients will be sufficient to solidify the efficacy signal we have observed to date and lay the groundwork for a potential future registrational study in this population. We look forward to continuing our excellent collaboration with the clinical sites and investigators at AIO and hope to report additional results in 2025."
References
1. Rao S, et al. Phase II study of retifanlimab in patients (pts) with squamous carcinoma of the anal canal (SCAC) who progressed following platinum-based chemotherapy. Annals of Oncology. 2020 September. doi: https://doi.org/10.1016/j.annonc.2020.08.2272.
2. Marabelle A, et al. Pembrolizumab for previously treated advanced anal squamous cell carcinoma: results from the non-randomised, multicohort, multicentre, phase 2 KEYNOTE-158 study. Lancet Gastroenterol Hepatol. 2022 May;7(5):446-454. doi: 10.1016/S2468-1253(21)00382-4.
3. Lonardi S, et al. Randomized phase II trial of avelumab alone or in combination with cetuximab for patients with previously treated, locally advanced, or metastatic squamous cell anal carcinoma: the CARACAS study. J Immunother Cancer. 2021 November;9(11):e002996. doi: 10.1136/jitc-2021-002996. PMID: 34815354; PMCID: PMC8611452.
About GOBLET
The GOBLET (Gastrointestinal tumOrs exploring the treatment comBinations with the oncolytic reovirus peLarEorep and anTi-PD-L1) study is a phase 1/2 multiple indication study in advanced or metastatic gastrointestinal tumors. The study is being conducted at 12 centers in Germany and is being managed by AIO-Studien-gGmbH. The co-primary endpoints of the study are objective response rate (ORR) assessed at week 16 and safety. Key secondary and exploratory endpoints include additional efficacy assessments and evaluation of potential biomarkers (T cell clonality and CEACAM6). The study employs a Simon two-stage design with Stage 1 comprising four treatment groups:
1. Pelareorep in combination with atezolizumab, gemcitabine, and nab-paclitaxel in 1st line advanced/metastatic pancreatic cancer patients;
2. Pelareorep in combination with atezolizumab in 1st line MSI (microsatellite instability)-high metastatic colorectal cancer patients;
3. Pelareorep in combination with atezolizumab and TAS-102 in 3rd line metastatic colorectal cancer patients; and
4. Pelareorep in combination with atezolizumab in 2nd line advanced and unresectable anal cancer patients.
Any cohort meeting pre-specified efficacy criteria in Stage 1 may be advanced to Stage 2 and enroll additional patients.
About AIO
AIO-Studien-gGmbH (AIO) emerged from the study center of the internal oncology working group within the German Cancer Society (DKG). AIO operates with a non-profit purpose of promoting science and research with a focus on medical oncology. Since its foundation, AIO has become a successful sponsor and study management company and has established itself both nationally and internationally.
About Oncolytics Biotech Inc.
Oncolytics is a clinical-stage biotechnology company developing pelareorep, an intravenously delivered immunotherapeutic agent. Pelareorep has demonstrated promising results in Phase 2 studies in breast and pancreatic cancers. It acts by inducing anti-cancer immune responses and promotes an inflamed tumor phenotype -- turning "cold" tumors "hot" -- through innate and adaptive immune responses to treat a variety of cancers.
Pelareorep has demonstrated synergies with multiple approved oncology treatments. Oncolytics is currently conducting and planning combination clinical trials with pelareorep in solid and hematological malignancies as it advances towards registrational studies in metastatic breast cancer and pancreatic cancer. For further information, please visit: https://www.oncolyticsbiotech.com.
This press release contains forward-looking statements, within the meaning of Section 21E of the Securities Exchange Act of 1934, as amended and forward-looking information under applicable Canadian securities laws (such forward-looking statements and forward-looking information are collectively referred to herein as "forward-looking statements"). Forward-looking statements contained in this press release include Oncolytics' belief as to the potential, mechanism of action and benefits of pelareorep as a cancer therapeutic; our plan to expand the evaluation of pelareorep in patients with advanced anal cancer; our belief that continued positive results could potentially expand the opportunity for pelareorep beyond the lead indications of breast cancer and pancreatic cancer and open the door to a rapid regulatory pathway; our belief that the expansion of the anal cancer cohort will enable the continued evaluation of the pelareorep/atezolizumab combination and could provide important confirmatory data that may lead to better treatment options for patients with this late-stage disease; our belief in the potential for a future registrational study in anal cancer; our plans to continue our collaboration with the clinical sites and investigators at AIO-Studien-gGmbH and hope to report additional results in 2025; our plans to advance towards registrational studies in metastatic breast cancer and pancreatic cancer; and other statements related to anticipated developments in Oncolytics' business and technologies. In any forward-looking statement in which Oncolytics expresses an expectation or belief as to future results, such expectations or beliefs are expressed in good faith and are believed to have a reasonable basis, but there can be no assurance that the statement or expectation or belief will be achieved. Such forward-looking statements involve known and unknown risks and uncertainties, which could cause Oncolytics' actual results to differ materially from those in the forward-looking statements. Such risks and uncertainties include, among others, the availability of funds and resources to pursue research and development projects, the efficacy of pelareorep as a cancer treatment, the success and timely completion of clinical studies and trials, Oncolytics' ability to successfully commercialize pelareorep, uncertainties related to the research and development of pharmaceuticals, uncertainties related to the regulatory process and general changes to the economic environment. In particular, we may be impacted by business interruptions resulting from COVID-19 coronavirus, including operating, manufacturing supply chain, clinical trial and project development delays and disruptions, labour shortages, travel and shipping disruption, and shutdowns (including as a result of government regulation and prevention measures). We may incur expenses or delays relating to such events outside of our control, which could have a material adverse impact on our business, operating results and financial condition. Investors should consult Oncolytics' quarterly and annual filings with the Canadian and U.S. securities commissions for additional information on risks and uncertainties relating to the forward-looking statements. Investors are cautioned against placing undue reliance on forward-looking statements. The Company does not undertake any obligation to update these forward-looking statements, except as required by applicable laws.
Company Contact
Jon Patton
Director of IR & Communication
+1-858-886-7813
mailto://jpatton@oncolytics.ca
Investor Relations for Oncolytics
Timothy McCarthy
LifeSci Advisors
+1-917-679-9282
mailto://tim@lifesciadvisors.com
View original content: https://www.prnewswire.com/news-releases/oncolytics-biotech-initiates-enrollment-expansion-of-goblet-anal-cancer-cohort-302061219.html
SOURCE Oncolytics Biotech® Inc.
View original content: http://www.newswire.ca/en/releases/archive/February2024/14/c7011.html


 News
News Market Data


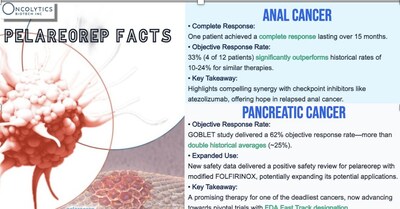
 glenn1919
2 months ago
glenn1919
2 months ago
 Monksdream
7 months ago
Monksdream
7 months ago

