CONSHOHOCKEN, Pa., April 29 /PRNewswire-FirstCall/ -- Quaker
Chemical Corporation (NYSE:KWR) today announced sales for the first
quarter 2008 of $147.7 million, a quarterly record, and net income
of $5.1 million, increases of 18.3% and 44.0%, respectively,
compared to the first quarter of 2007. Earnings per share increased
to $0.50 per diluted share from $0.35 per diluted share for the
first quarter of 2007. "We're very pleased with our start in 2008,
particularly given today's world," commented Ronald J. Naples,
Chairman and Chief Executive Officer. "We achieved improvement in
operating income as a percentage of sales to over 6%, despite the
headwinds of rapidly escalating raw material costs. We did see a
decrease in our sequential gross margin percentage from the fourth
quarter of 2007, but were able to maintain our margins in dollar
terms, and continue to work with our customers to recognize the
value we deliver and our cost realities. With our future in mind,
we remain committed to invest in key growth initiatives, while at
the same time being mindful of today's challenges and limited
visibility of the current economic environment and commodity price
trends. As suggested by our recent dividend increase, we have
confidence about our long-term future and the prospects of earnings
improvement for 2008." First Quarter 2008 Summary Net sales for the
first quarter were $147.7 million, up 18.3% from $124.9 million for
the first quarter 2007. The increase in net sales was attributable
to volume growth, higher sales prices and foreign exchange rate
translation. Volume growth was realized in virtually all the
Company's regions, including higher revenue related to the
Company's Chemical Management Services ("CMS") channel. Foreign
exchange rate translation increased revenues by approximately 8%
for the first quarter of 2008, compared to the same period in 2007.
Selling price increases were realized, in part, as a result of an
ongoing effort to offset higher raw material costs. CMS revenues
were higher due to the full year impact of additional CMS accounts
gained in 2007, as well as the renewal and restructuring of several
of the Company's CMS contracts. Gross margin dollars were up more
than $5.0 million, or 13.2% for the first quarter of 2008, compared
to the same period in 2007. However, the gross margin percentage
was 29.5% for the first quarter of 2008, compared to 30.9% for the
first quarter of 2007. The Company's larger mix of CMS contracts
reported on a gross versus pass-through basis decreased gross
margin as a percentage of sales by approximately 0.5 percentage
points. The remaining decline in gross margin as a percentage of
sales is due to increased raw material costs in excess of price
increases, as well as product and regional sales mix. The Company
has announced and implemented a number of further price increases
to aid in offsetting unprecedented levels in the Company's key raw
material costs. Selling, general and administrative expenses for
the quarter increased $2.6 million, compared to the first quarter
of 2007. Foreign exchange rate translation accounted for the
majority of the increase over the prior year period. Inflationary
increases were largely offset by lower legal and environmental
costs and lower incentive compensation expense. The decrease in
other income was primarily due to foreign exchange rate losses in
2008 compared to gains in 2007. Net interest expense was lower due
to lower average borrowings as well as lower interest rates.
Balance Sheet and Cash Flow Items The Company's net debt increased
from December 31, 2007, primarily to fund working capital needs
driven by higher quarterly sales and scheduled first quarter
payments, including the payment of incentive compensation. The
Company's net debt-to-total-capital ratio was 34% at March 31,
2008, compared to 43% at March 31, 2007 and 32% at December 31,
2007. Quaker Chemical Corporation is a leading global provider of
process chemicals, chemical specialties, services, and technical
expertise to a wide range of industries -- including steel,
automotive, mining, aerospace, tube and pipe, coatings and
construction materials. Our products, technical solutions, and
chemical management services enhance our customers' processes,
improve their product quality, and lower their costs. Quaker's
headquarters is located near Philadelphia in Conshohocken,
Pennsylvania. This release contains forward-looking statements that
are subject to certain risks and uncertainties that could cause
actual results to differ materially from those projected in such
statements. A major risk is that the Company's demand is largely
derived from the demand for its customers' products, which subjects
the Company to downturns in a customer's business and unanticipated
customer production shutdowns. Other major risks and uncertainties
include, but are not limited to, significant increases in raw
material costs, customer financial stability, worldwide economic
and political conditions, foreign currency fluctuations, and future
terrorist attacks such as those that occurred on September 11,
2001. Other factors could also adversely affect us. Therefore, we
caution you not to place undue reliance on our forward-looking
statements. This discussion is provided as permitted by the Private
Securities Litigation Reform Act of 1995. As previously announced,
Quaker Chemical's investor conference call to discuss first quarter
results is scheduled for April 30, 2008 at 2:30 p.m. (ET). Access
the conference by calling 877-269-7756 or visit Quaker's Web site
at http://www.quakerchem.com/ for a live webcast. Quaker Chemical
Corporation Condensed Consolidated Statement of Income (Dollars in
thousands, except per share data and share amounts) (Unaudited)
Three Months Ended March 31, 2008 2007 Net sales $147,718 124,891
Cost of goods sold 104,083 86,345 Gross margin 43,635 38,546 %
29.5% 30.9% Selling, general and administrative expenses 34,504
31,919 Operating income 9,131 6,627 % 6.2% 5.3% Other income, net
161 327 Interest expense, net (1,182) (1,350) Income before taxes
8,110 5,604 Taxes on income 2,765 1,844 5,345 3,760 Equity in net
income of associated companies 112 125 Minority interest in net
income of subsidiaries (364) (348) Net income $5,093 $3,537 % 3.4%
2.8% Per share data: Net income - basic $0.50 $0.36 Net income -
diluted $0.50 $0.35 Shares Outstanding: Basic 10,085,859 9,907,683
Diluted 10,179,539 10,024,905 Quaker Chemical Corporation Condensed
Consolidated Balance Sheet (Dollars in thousands, except par value
and share amounts) (Unaudited) March 31, December 31, 2008 2007
ASSETS Current assets Cash and cash equivalents $20,527 $20,195
Accounts receivable, net 120,273 118,135 Inventories, net 64,559
60,738 Prepaid expenses and other current assets 16,057 14,433
Total current assets 221,416 213,501 Property, plant and equipment,
net 63,707 62,287 Goodwill 45,799 43,789 Other intangible assets,
net 7,668 7,873 Investments in associated companies 7,959 7,323
Deferred income taxes 32,018 30,257 Other assets 40,476 34,019
Total assets $419,043 $399,049 LIABILITIES AND SHAREHOLDERS' EQUITY
Current liabilities Short-term borrowings and current portion of
long-term debt $3,875 $4,288 Accounts and other payables 68,519
67,380 Accrued compensation 9,730 17,287 Other current liabilities
17,701 17,396 Total current liabilities 99,825 106,351 Long-term
debt 89,235 78,487 Deferred income taxes 8,209 7,583 Other
non-current liabilities 77,557 71,722 Total liabilities 274,826
264,143 Minority interest in equity of subsidiaries 4,750 4,513
Shareholders' equity Common stock, $1 par value; authorized
30,000,000 shares; issued 10,268,988 shares 10,269 10,147 Capital
in excess of par value 11,844 10,104 Retained earnings 118,506
115,767 Accumulated other comprehensive loss (1,152) (5,625) Total
shareholders' equity 139,467 130,393 Total liabilities and
shareholders' equity 419,043 $399,049 Quaker Chemical Corporation
Condensed Consolidated Statement of Cash Flows For the Three months
ended March 31, (Dollars in thousands) (Unaudited) 2008 2007 Cash
flows from operating activities Net income $5,093 $3,537
Adjustments to reconcile net income to net cash used in operating
activities: Depreciation 2,680 2,719 Amortization 300 339 Equity in
net income of associated companies, net of dividends (112) 44
Minority interest in earnings of subsidiaries 364 348 Deferred
income tax 1,246 361 Deferred compensation and other, net 22 267
Stock-based compensation 376 262 (Gain) Loss on disposal of
property, plant and equipment (35) 5 Insurance settlement realized
(136) (265) Pension and other postretirement benefits (2,458) (869)
Increase (decrease) in cash from changes in current assets and
current liabilities, net of acquisitions: Accounts receivable 1,159
(10,633) Inventories (2,374) (3,019) Prepaid expenses and other
current assets (3,037) (873) Accounts payable and accrued
liabilities (9,280) 2,749 Net cash used in operating activities
(6,192) (5,028) Cash flows from investing activities Capital
expenditures (1,949) (2,721) Payments related to acquisitions
(1,000) (1,000) Proceeds from disposition of assets 65 - Insurance
settlement received and interest earned 5,112 143 Change in
restricted cash, net (4,976) 122 Net cash used in investing
activities (2,748) (3,456) Cash flows from financing activities Net
decrease in short-term borrowings (378) (1,262) Proceeds from
long-term debt 9,844 5,277 Repayments of long-term debt (251) (225)
Dividends paid (2,181) (2,137) Stock options exercised, other 1,486
1,809 Distributions to minority shareholders - (270) Net cash
provided by financing activities 8,520 3,192 Effect of exchange
rate changes on cash 752 17 Net increase (decrease) in cash and
cash equivalents 332 (5,275) Cash and cash equivalents at the
beginning of the period 20,195 16,062 Cash and cash equivalents at
the end of the period $20,527 $10,787 DATASOURCE: Quaker Chemical
Corporation CONTACT: Mark A. Featherstone, Vice President and Chief
Financial Officer of Quaker Chemical Corporation, +1-610-832-4160
Web site: http://www.quakerchem.com/
Copyright
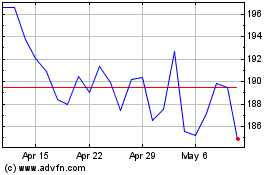
Quaker Houghton (NYSE:KWR)
Historical Stock Chart
From Jun 2024 to Jul 2024

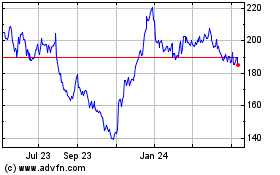
Quaker Houghton (NYSE:KWR)
Historical Stock Chart
From Jul 2023 to Jul 2024
