UNITED STATES
SECURITIES AND EXCHANGE COMMISSION
Washington, D.C. 20549
FORM 6-K
REPORT OF FOREIGN PRIVATE ISSUER
PURSUANT TO RULE 13a-16 OR 15d-16
OF THE SECURITIES EXCHANGE ACT OF 1934
For the month of August, 2023
Commission File Number: 001-37915
Fortis Inc.
Fortis Place, Suite 1100
5 Springdale Street
St. John's, Newfoundland and Labrador
Canada, A1E 0E4
(Address of Principal Executive Office)
Indicate by check mark whether the registrant files or will file annual reports under cover
of Form 20-F or Form 40-F: Form 20-F ☐ Form 40-F ☑
EXHIBITS
SIGNATURES
Pursuant to the requirements of the Securities Exchange Act of 1934, the
registrant has duly caused this report to be signed on its behalf by the undersigned, thereunto duly authorized.
| |
|
|
| |
Fortis Inc.
(Registrant)
|
| Date: August 2, 2023 |
/s/James R. Reid |
| |
By: |
James R. Reid |
| |
Title: |
Executive Vice President, Sustainability and Chief Legal Officer |
| |
|
|
| |
|
|
Exhibit 99.1

Q2 2023 Earnings Conference Call August 2, 2023
FORWARD - LOOKING INFORMATION 2 Fortis includes forward - looking information in this presentation within the meaning of applicable Canadian securities laws and forward - looking statements within the meaning of the Private Securities Litigation Reform Act of 1995 (collectively referred to as "forward - looking information") . Forward - looking information reflects expectations of Fortis management regarding future growth, results of operations, performance and business prospects and opportunities . Wherever possible, words such as anticipates, believes, budgets, could, estimates, expects, forecasts, intends, may, might, plans, projects, schedule, should, target, will, would, and the negative of these terms, and other similar terminology or expressions have been used to identify the forward - looking information, which includes, without limitation : the 2030 GHG emissions reduction target ; the 2035 GHG emissions reduction target ; the 2050 net - zero GHG emissions target ; forecast capital expenditures for 2023 - 2027 , including cleaner energy investments ; forecast rate base and rate base growth for 2023 - 2027 ; dividend growth guidance through 2027 ; the expected timing, outcome and impact of regulatory proceedings and decisions ; the expected timing and outcome of the sale of Aitken Creek ; the expectation of providing long - term value to shareholders ; the nature, timing, benefits and expected costs of certain capital projects, including ITC MISO Long - Range Transmission Plan, UNS Energy Renewable Generation ; UNS Energy Vail - to - Tortolita Transmission Project, FortisBC Tilbury LNG Storage Expansion, FortisBC AMI Project, FortisBC Eagle Mountain Woodfibre Gas Line Project, FortisBC Tilbury 1 B Project, FortisBC Okanagan Capacity Upgrade, Wataynikaneyap Transmission Power Project, and additional opportunities beyond the capital plan, including Central Hudson's investment in the Propel NY Energy project through Transco ; the expectation to exit coal by 2032 ; TEP's Integrated Resource Plan and planned additions of wind, solar and storage through 2035 ; FortisBC's 2030 renewable gas targets ; and forecast debt maturities for 2023 - 2032 . Forward looking information involves significant risks, uncertainties and assumptions . Certain material factors or assumptions have been applied in drawing the conclusions contained in the forward - looking information, including, without limitation : no material impact from energy price volatility, global supply chain constraints and inflation ; reasonable regulatory decisions and the expectation of regulatory stability ; the successful execution of the capital plan ; no material capital project or financing cost overrun ; no material changes in the assumed U . S . dollar to Canadian dollar exchange rate ; sufficient human resources to deliver service and execute the capital plan ; no significant variability in interest rates ; and the Board of Directors exercising its discretion to declare dividends, taking into account the business performance and financial condition of the Corporation . Fortis cautions readers that a number of factors could cause actual results, performance or achievements to differ materially from the results discussed or implied in the forward - looking information . These factors should be considered carefully, and undue reliance should not be placed on the forward - looking information . For additional information with respect to certain of these risks or factors, reference should be made to the continuous disclosure materials filed from time to time by the Corporation with Canadian securities regulatory authorities and the Securities and Exchange Commission . All forward - looking information herein is given as of the date of this presentation . Fortis disclaims any intention or obligation to update or revise any forward - looking information, whether as a result of new information, future events or otherwise . Unless otherwise specified, all financial information is in Canadian dollars and rate base refers to midyear rate base .

David Hutchens President and CEO
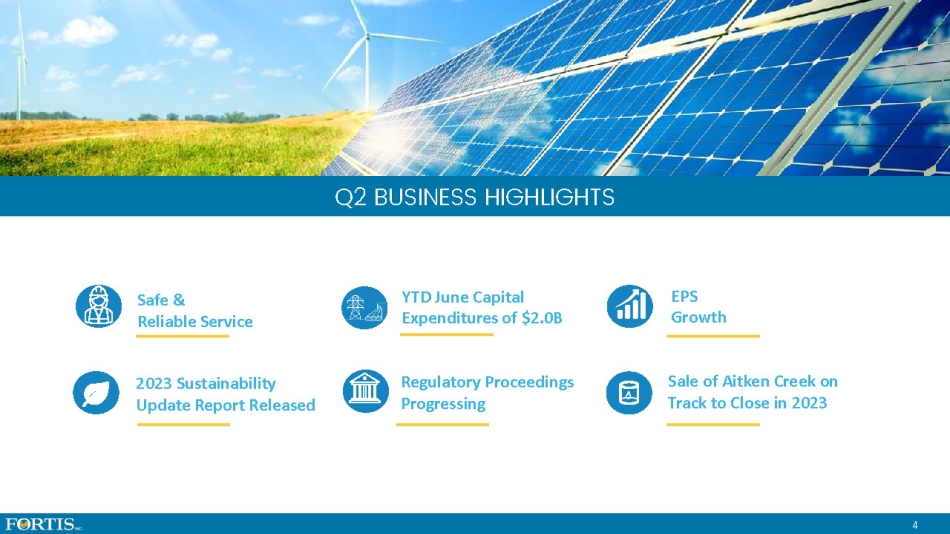
EPS Growth Q2 BUSINESS HIGHLIGHTS 4 4 Safe & Reliable Service 2023 Sustainability Update Report Released YTD June Capital Expenditures of $2.0B Sale of Aitken Creek on Track to Close in 2023 Regulatory Proceedings Progressing
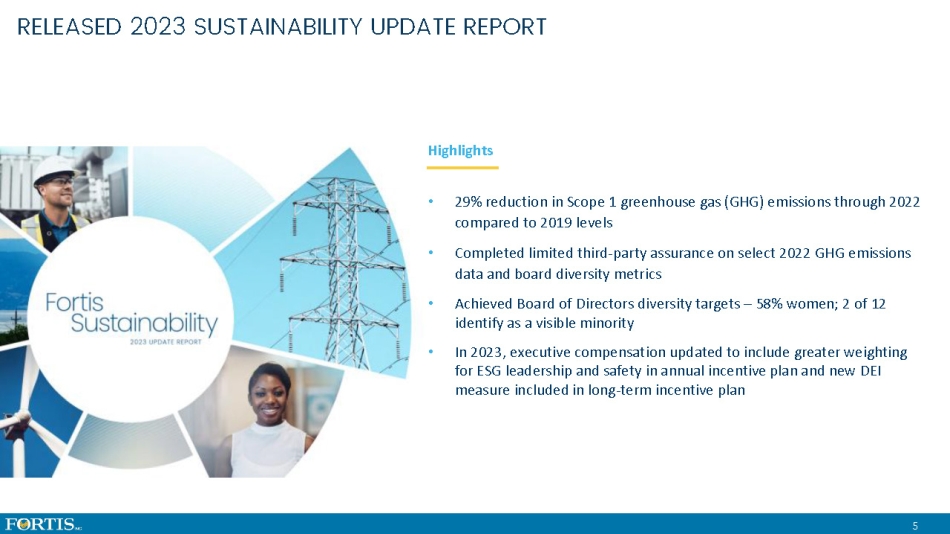
RELEASED 2023 SUSTAINABILITY UPDATE REPORT 5 Highlights • 29% reduction in Scope 1 greenhouse gas (GHG) emissions through 2022 compared to 2019 levels • Completed limited third - party assurance on select 2022 GHG emissions data and board diversity metrics • Achieved Board of Directors diversity targets – 58% women; 2 of 12 identify as a visible minority • In 2023, executive compensation updated to include greater weighting for ESG leadership and safety in annual incentive plan and new DEI measure included in long - term incentive plan
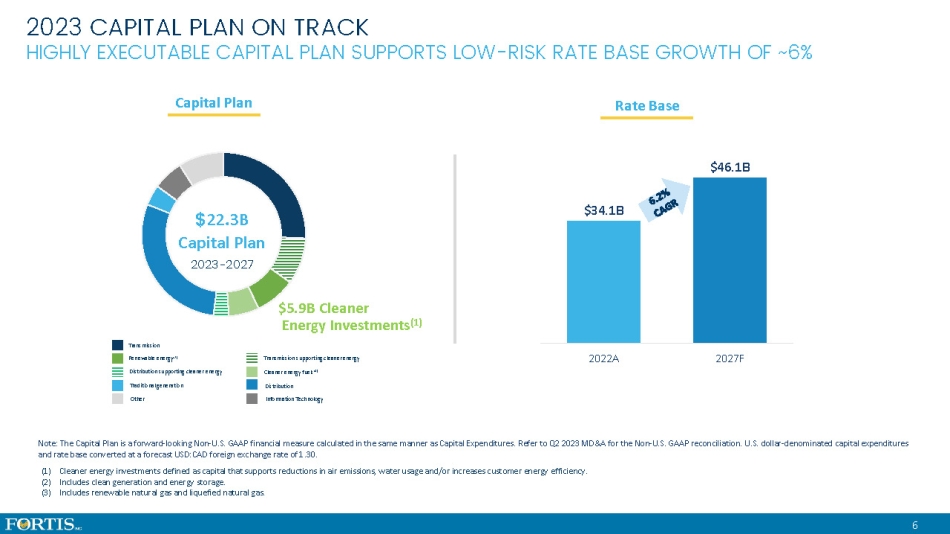
6 Note: The Capital Plan is a forward - looking Non - U.S. GAAP financial measure calculated in the same manner as Capital Expenditure s. Refer to Q2 2023 MD&A for the Non - U.S. GAAP reconciliation. U.S. dollar - denominated capital expenditures and rate base converted at a forecast USD:CAD foreign exchange rate of 1.30. (1) Cleaner energy investments defined as capital that supports reductions in air emissions, water usage and/or increases custome r e nergy efficiency. (2) Includes clean generation and energy storage. (3) Includes renewable natural gas and liquefied natural gas. $34.1 B $46.1 B 2022A 2027F Rate Base $ 22.3B Capital Plan 2023 - 2027 $5.9B Cleaner Energy Investments (1) HIGHLY EXECUTABLE CAPITAL PLAN SUPPORTS LOW - RISK RATE BASE GROWTH OF ~6% Capital Plan Transmission Renewable energy (2) Distribution supporting cleaner energy Traditional generation Other Transmission supporting cleaner energy Cleaner energy fuels (3) Distribution Information Technology 2023 Capital Plan on Track 2023 CAPITAL PLAN ON TRACK
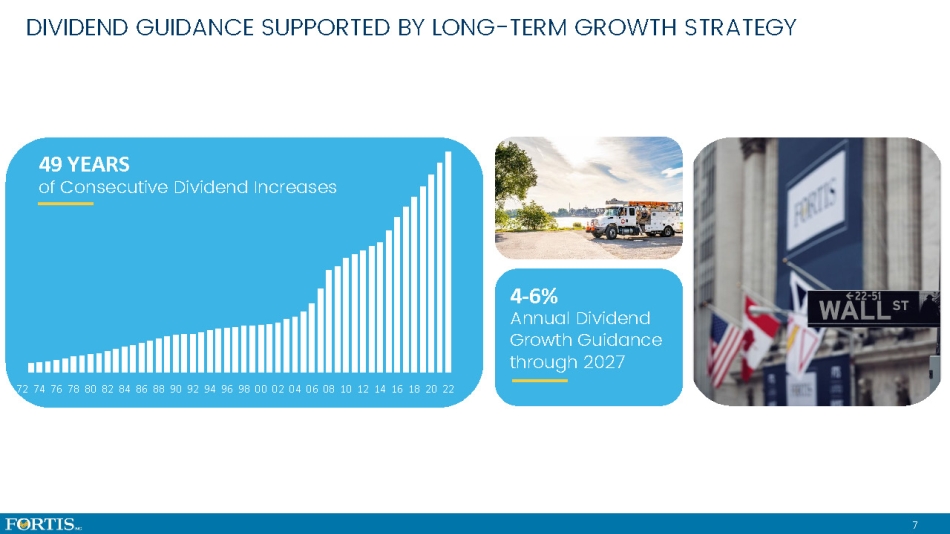
7 72 74 76 78 80 82 84 86 88 90 92 94 96 98 00 02 04 06 08 10 12 14 16 18 20 22 49 YEARS of Consecutive Dividend Increases 4 - 6% Annual Dividend Growth Guidance through 2027 DIVIDEND GUIDANCE SUPPORTED BY LONG - TERM GROWTH STRATEGY

Jocelyn Perry Executive Vice President and CFO
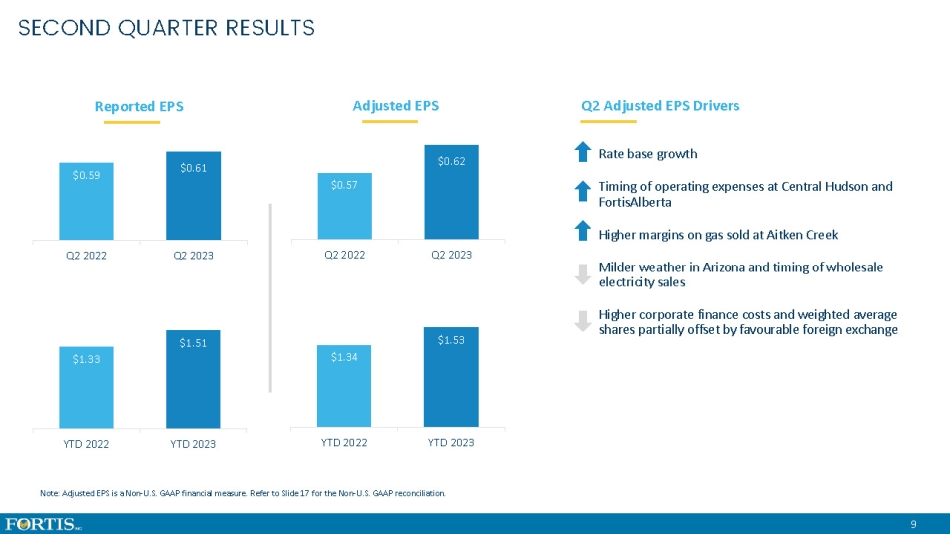
• Rate base growth • Timing of operating expenses at Central Hudson and FortisAlberta • Higher margins on gas sold at Aitken Creek • Milder weather in Arizona and timing of wholesale electricity sales • Higher corporate finance costs and weighted average shares partially offset by favourable foreign exchange Adjusted EPS 9 Q2 Adjusted EPS Drivers Note: Adjusted EPS is a Non - U.S. GAAP financial measure. Refer to Slide 17 for the Non - U.S. GAAP reconciliation. $0.57 $0.62 Q2 2022 Q2 2023 $1.34 $1.53 YTD 2022 YTD 2023 SECOND QUARTER RESULTS Reported EPS $0.59 $0.61 Q2 2022 Q2 2023 $1.33 $1.51 YTD 2022 YTD 2023
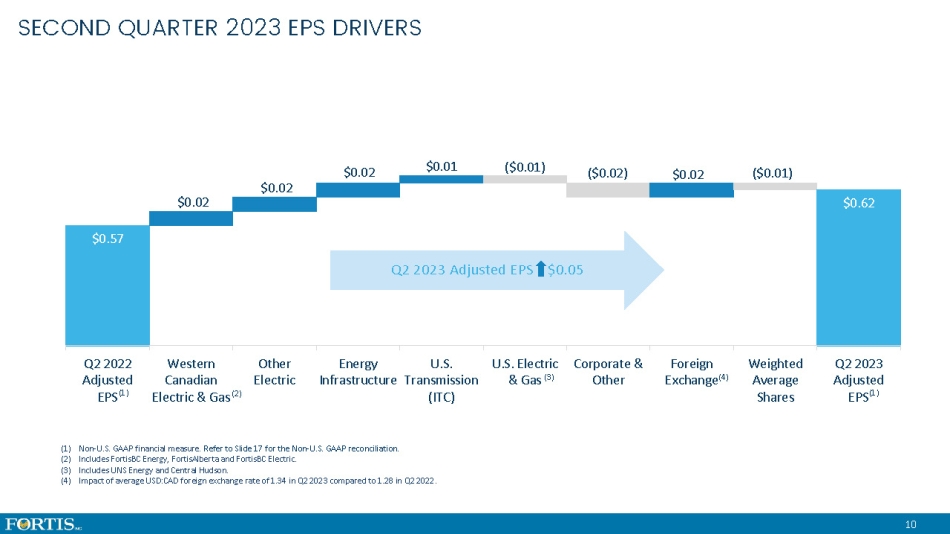
$0.57 $0.02 $0.02 $0.02 $0.01 ( $0.01 ) ( $0.02 ) $0.02 ( $0.01 ) $0.62 Q2 2022 Adjusted EPS Western Canadian Electric & Gas Other Electric Energy Infrastructure U.S. Transmission (ITC) U.S. Electric & Gas Corporate & Other Foreign Exchange Weighted Average Shares Q2 2023 Adjusted EPS (2) (1) Non - U.S. GAAP financial measure. Refer to Slide 17 for the Non - U.S. GAAP reconciliation. (2) Includes FortisBC Energy, FortisAlberta and FortisBC Electric. (3) Includes UNS Energy and Central Hudson. (4) Impact of average USD:CAD foreign exchange rate of 1. 34 in Q2 2023 compared to 1.28 in Q2 2022. (1) 10 (3) (4) Q2 2023 Adjusted EPS $0.05 (1) SECOND QUARTER 2023 EPS DRIVERS
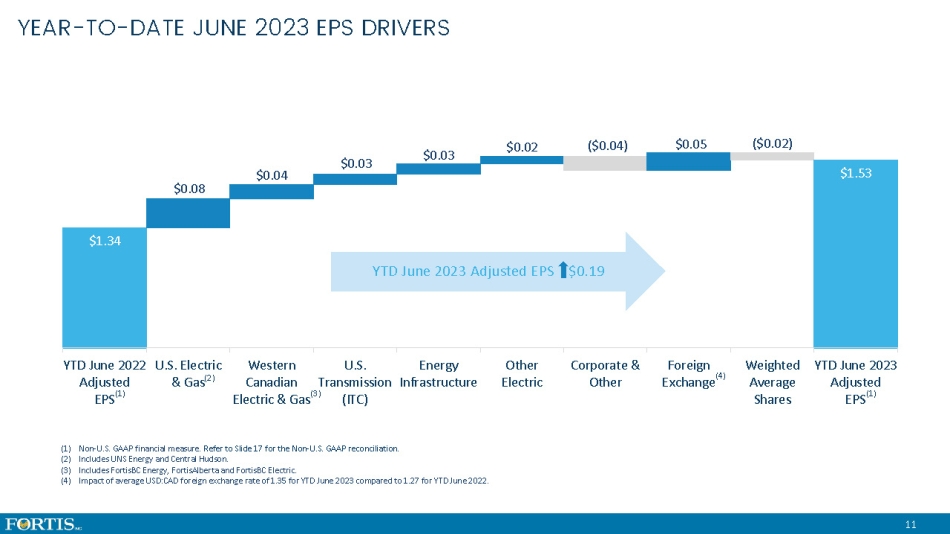
$1.34 $0.08 $0.04 $0.03 $0.03 $0.02 ( $0.04 ) $0.05 ( $0.02 ) $1.53 YTD June 2022 Adjusted EPS U.S. Electric & Gas Western Canadian Electric & Gas U.S. Transmission (ITC) Energy Infrastructure Other Electric Corporate & Other Foreign Exchange Weighted Average Shares YTD June 2023 Adjusted EPS (2) (1) Non - U.S. GAAP financial measure. Refer to Slide 17 for the Non - U.S. GAAP reconciliation. (2) Includes UNS Energy and Central Hudson. (3) Includes FortisBC Energy, FortisAlberta and FortisBC Electric. (4) Impact of average USD:CAD foreign exchange rate of 1. 35 for YTD June 2023 compared to 1.27 for YTD June 2022. (1) 11 (3) (4) YTD June 2023 Adjusted EPS $0.19 (1) YEAR - TO - DATE JUNE 2023 EPS DRIVERS
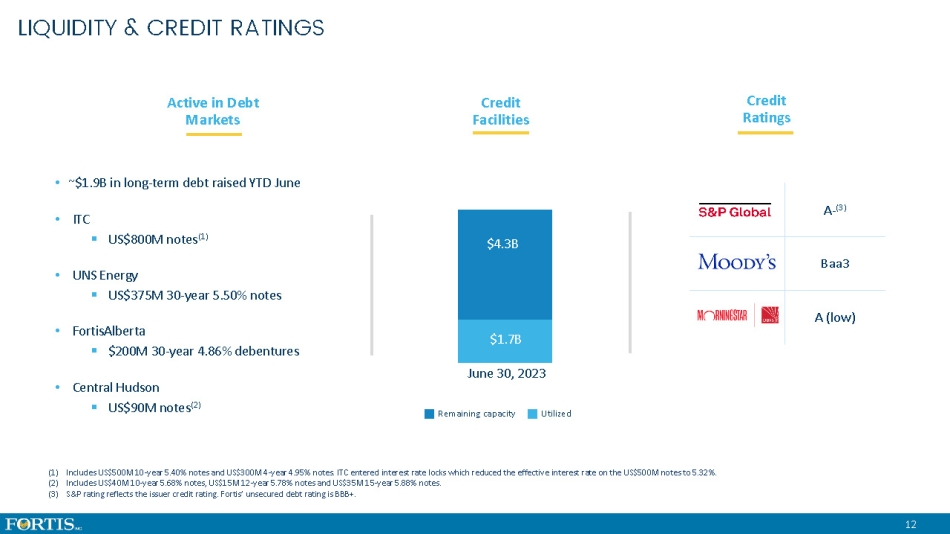
• ~$1.9B in long - term debt raised YTD June • ITC ▪ US$800M notes (1) • UNS Energy ▪ US$375M 30 - year 5.50% notes • FortisAlberta ▪ $200M 30 - year 4.86% debentures • Central Hudson ▪ US$90M notes (2) $1.7B $ 4.3 B June 30, 2023 Remaining capacity (1) Includes US$500M 10 - year 5.40% notes and US$300M 4 - year 4.95% notes. ITC entered interest rate locks which reduced the effective interest rate on the US$500M notes to 5.32%. (2) Includes US$40M 10 - year 5.68% notes, US$15M 12 - year 5.78% notes and US$35M 15 - year 5.88% notes. (3) S&P rating reflects the issuer credit rating. Fortis’ unsecured debt rating is BBB+. Utilized 12 Credit Ratings Active in Debt Markets Credit Facilities A - (3) Baa3 A (low) LIQUIDITY & CREDIT RATINGS
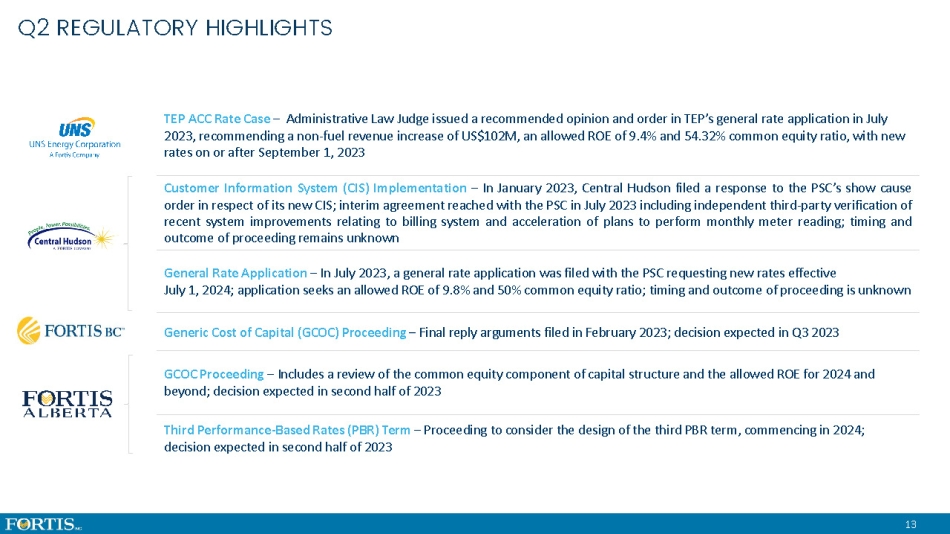
TEP ACC Rate Case – Administrative Law Judge issued a recommended opinion and order in TEP’s general rate application in July 2023, recommending a non - fuel revenue increase of US$102M, an allowed ROE of 9.4% and 54.32% common equity ratio, with new rates on or after September 1, 2023 Customer Information System (CIS) Implementation – In January 2023 , Central Hudson filed a response to the PSC’s show cause order in respect of its new CIS ; interim agreement reached with the PSC in July 2023 including independent third - party verification of recent system improvements relating to billing system and acceleration of plans to perform monthly meter reading ; timing and outcome of proceeding remains unknown General Rate Application – In July 2023 , a general rate application was filed with the PSC requesting new rates effective July 1 , 2024 ; application seeks an allowed ROE of 9 . 8 % and 50 % common equity ratio ; timing and outcome of proceeding is unknown Generic Cost of Capital (GCOC) Proceeding – Final reply arguments filed in February 2023 ; decision expected in Q 3 2023 GCOC Proceeding – Includes a review of the common equity component of capital structure and the allowed ROE for 2024 and beyond; decision expected in second half of 2023 Third Performance - Based Rates (PBR) Term – Pr oceeding to consider the design of the third PBR term, commencing in 2024; decision expected in second half of 2023 13 Q2 REGULATORY HIGHLIGHTS
WHY INVEST IN FORTIS? Focused on ENERGY DELIVERY Geographic & Regulatory DIVERSITY 4 - 6% ANNUAL DIVIDEND Growth Guidance SAFE, WELL - RUN Local Utilities LOW - RISK Growth Profile Virtually All REGULATED ESG Leadership Innovative 14 WHY INVEST IN FORTIS?
15 UPCOMING EVENTS • Investor Day – September 19, 2023 (Event hosted in St. John’s, NL with webcast) • Q3 2023 – October 27, 2023 • Q4 2023 – February 9, 2024 Expected Earnings Release Dates Save the Date

Q2 2023 Earnings Conference Call August 2, 2023
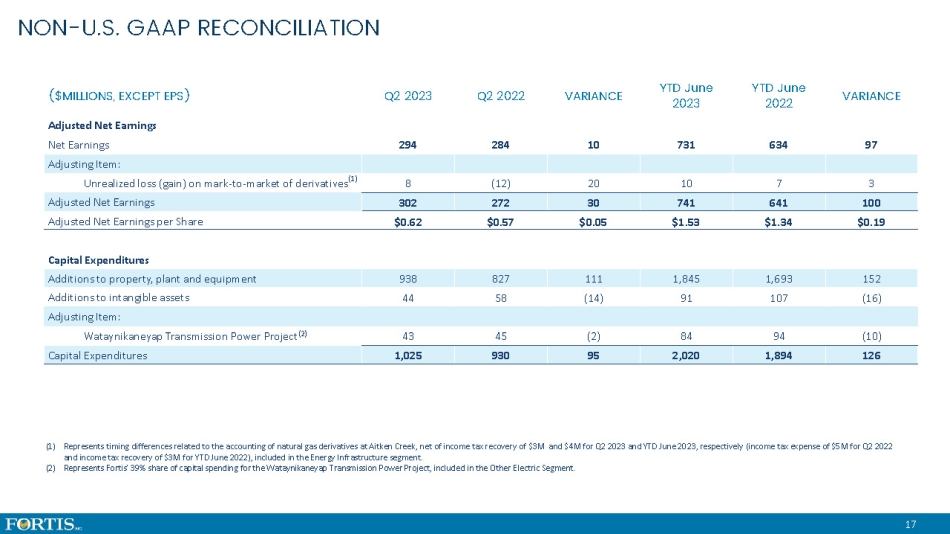
17 VARIANCE YTD June 2022 YTD June 2023 VARIANCE Q2 2022 Q2 2023 ($MILLIONS, EXCEPT EPS) Adjusted Net Earnings 97 634 731 10 284 294 Net Earnings Adjusting Item: 3 7 10 20 (12) 8 Unrealized loss (gain) on mark - to - market of derivatives (1) 100 641 741 30 272 302 Adjusted Net Earnings $0.19 $1.34 $1.53 $0.05 $0.57 $0.62 Adjusted Net Earnings per Share Capital Expenditures 152 1,693 1,845 111 827 938 Additions to property, plant and equipment (16) 107 91 (14) 58 44 Additions to intangible assets Adjusting Item: (10) 94 84 (2) 45 43 Wataynikaneyap Transmission Power Project (2) 126 1,894 2,020 95 930 1,025 Capital Expenditures (1) Represents timing differences related to the accounting of natural gas derivatives at Aitken Creek, net of income tax recover y o f $3M and $4M for Q2 2023 and YTD June 2023, respectively (income tax expense of $5M for Q2 2022 and income tax recovery of $3M for YTD June 2022), included in the Energy Infrastructure segment. (2) Represents Fortis’ 39% share of capital spending for the Wataynikaneyap Transmission Power Project, included in the Other Ele ctr ic Segment. NON - U.S. GAAP RECONCILIATION
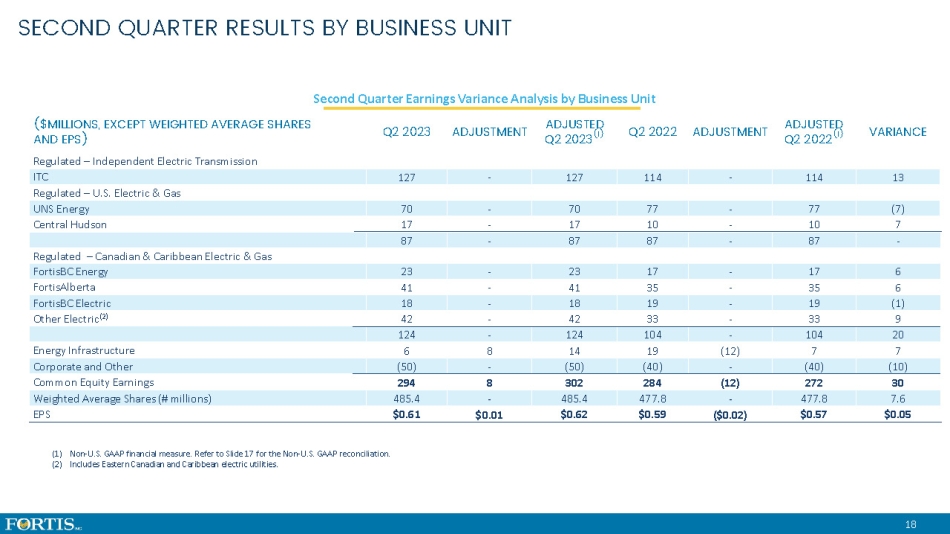
18 Second Quarter Earnings Variance Analysis by Business Unit VARIANCE ADJUSTED Q2 2022 (1) ADJUSTMENT Q2 2022 ADJUSTED Q2 2023 (1) ADJUSTMENT Q2 2023 ($MILLIONS, EXCEPT WEIGHTED AVERAGE SHARES AND EPS) Regulated – Independent Electric Transmission 13 114 - 114 127 - 127 ITC Regulated – U.S. Electric & Gas (7) 77 - 77 70 - 70 UNS Energy 7 10 - 10 17 - 17 Central Hudson - 87 - 87 87 - 87 Regulated – Canadian & Caribbean Electric & Gas 6 17 - 17 23 - 23 FortisBC Energy 6 35 - 35 41 - 41 FortisAlberta (1) 19 - 19 18 - 18 FortisBC Electric 9 33 - 33 42 - 42 Other Electric (2) 20 104 - 104 124 - 124 7 7 (12) 19 14 8 6 Energy Infrastructure (10) (40) - (40) (50) - (50) Corporate and Other 30 272 (12) 284 302 8 294 Common Equity Earnings 7.6 477.8 - 477.8 485.4 - 485.4 Weighted Average Shares (# millions) $0.05 $0.57 ($0.02) $0.59 $0.62 $0.01 $0.61 EPS (1) Non - U.S. GAAP financial measure. Refer to Slide 17 for the Non - U.S. GAAP reconciliation. (2) Includes Eastern Canadian and Caribbean electric utilities. SECOND QUARTER RESULTS BY BUSINESS UNIT
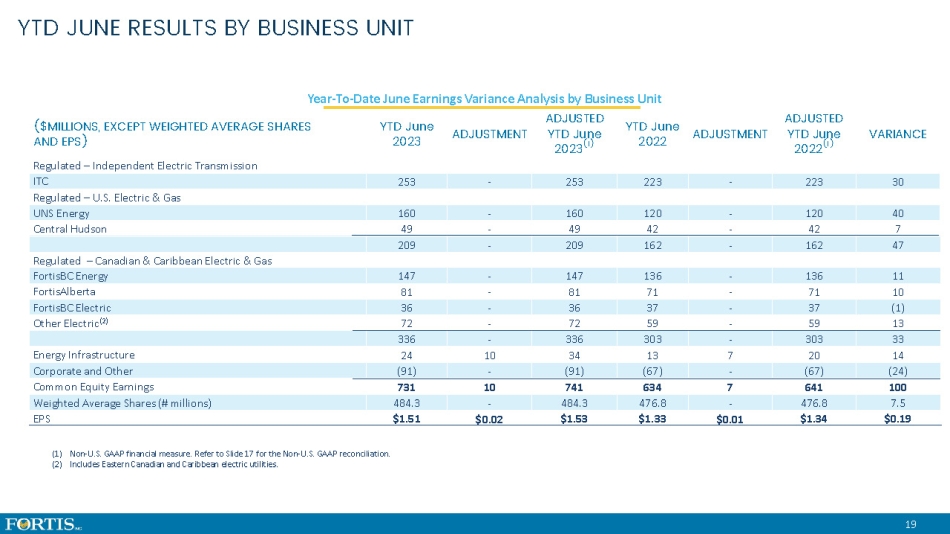
19 Year - To - Date June Earnings Variance Analysis by Business Unit VARIANCE ADJUSTED YTD June 2022 (1) ADJUSTMENT YTD June 2022 ADJUSTED YTD June 2023 (1) ADJUSTMENT YTD June 2023 ($MILLIONS, EXCEPT WEIGHTED AVERAGE SHARES AND EPS) Regulated – Independent Electric Transmission 30 223 - 223 253 - 253 ITC Regulated – U.S. Electric & Gas 40 120 - 120 160 - 160 UNS Energy 7 42 - 42 49 - 49 Central Hudson 47 162 - 162 209 - 209 Regulated – Canadian & Caribbean Electric & Gas 11 136 - 136 147 - 147 FortisBC Energy 10 71 - 71 81 - 81 FortisAlberta (1) 37 - 37 36 - 36 FortisBC Electric 13 59 - 59 72 - 72 Other Electric (2) 33 303 - 303 336 - 336 14 20 7 13 34 10 24 Energy Infrastructure (24) (67) - (67) (91) - (91) Corporate and Other 100 641 7 634 741 10 731 Common Equity Earnings 7.5 476.8 - 476.8 484.3 - 484.3 Weighted Average Shares (# millions) $0.19 $1.34 $0.01 $1.33 $1.53 $0.02 $1.51 EPS (1) Non - U.S. GAAP financial measure. Refer to Slide 17 for the Non - U.S. GAAP reconciliation. (2) Includes Eastern Canadian and Caribbean electric utilities. YTD JUNE RESULTS BY BUSINESS UNIT
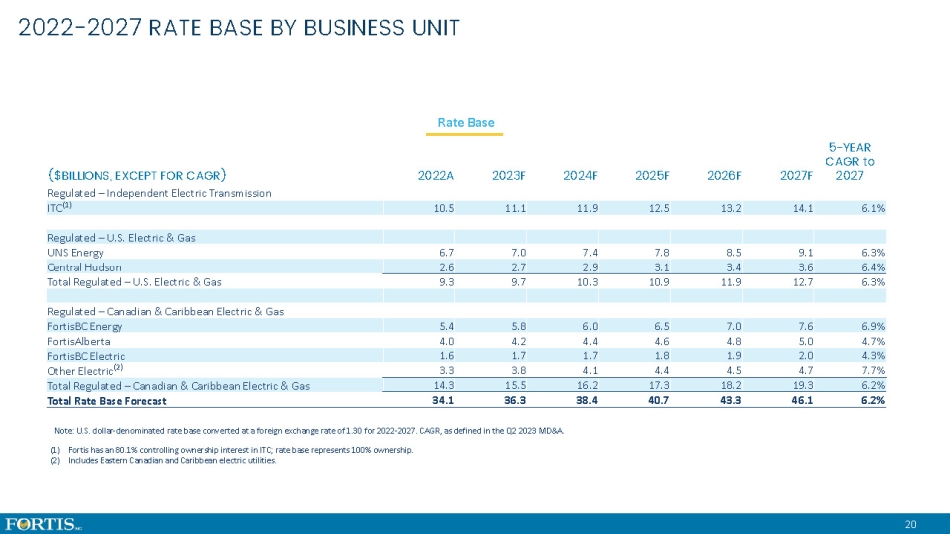
20 (1) Fortis has an 80.1% controlling ownership interest in ITC; rate base represents 100% ownership. (2) Includes Eastern Canadian and Caribbean electric utilities. Rate Base 5 - YEAR CAGR to 2027 2027F 2026F 2025F 2024F 2023F 2022A ($BILLIONS, EXCEPT FOR CAGR) Regulated – Independent Electric Transmission 6.1% 14.1 13.2 12.5 11.9 11.1 10.5 ITC (1) Regulated – U.S. Electric & Gas 6.3% 9.1 8.5 7.8 7.4 7.0 6.7 UNS Energy 6.4% 3.6 3.4 3.1 2.9 2.7 2.6 Central Hudson 6.3% 12.7 11.9 10.9 10.3 9.7 9.3 Total Regulated – U.S. Electric & Gas Regulated – Canadian & Caribbean Electric & Gas 6.9% 7.6 7.0 6.5 6.0 5.8 5.4 FortisBC Energy 4.7% 5.0 4.8 4.6 4.4 4.2 4.0 FortisAlberta 4.3% 2.0 1.9 1.8 1.7 1.7 1.6 FortisBC Electric 7.7% 4.7 4.5 4.4 4.1 3.8 3.3 Other Electric (2) 6.2% 19.3 18.2 17.3 16.2 15.5 14.3 Total Regulated – Canadian & Caribbean Electric & Gas 6.2% 46.1 43.3 40.7 38.4 36.3 34.1 Total Rate Base Forecast Note: U.S. dollar - denominated rate base converted at a foreign exchange rate of 1.30 for 2022 - 2027. CAGR, as defined in the Q2 2 023 MD&A. 2022 - 2027 RATE BASE BY BUSINESS UNIT
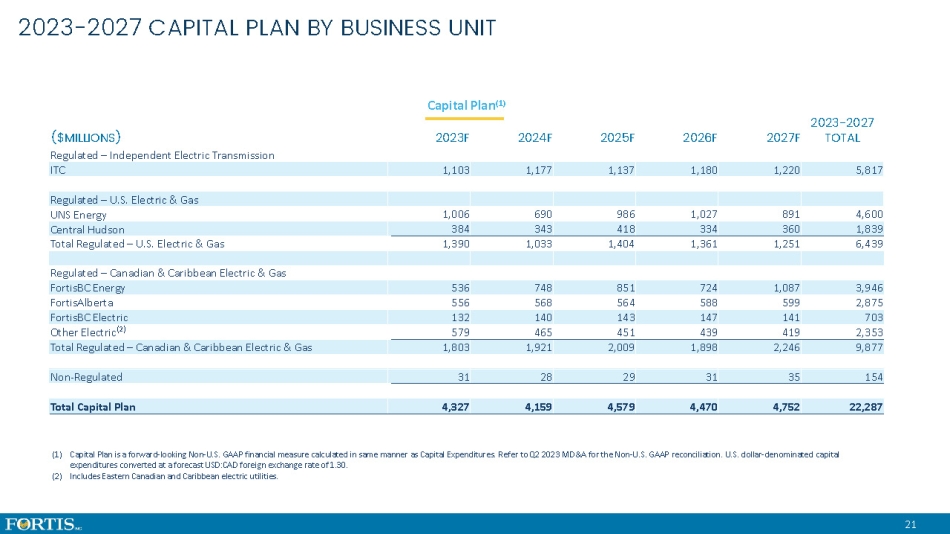
21 Capital Plan (1) 2023 - 2027 TOTAL 2027F 2026F 2025F 2024F 2023F ($MILLIONS) Regulated – Independent Electric Transmission 5,817 1,220 1,180 1,137 1,177 1,103 ITC Regulated – U.S. Electric & Gas 4,600 891 1,027 986 690 1,006 UNS Energy 1,839 360 334 418 343 384 Central Hudson 6,439 1,251 1,361 1,404 1,033 1,390 Total Regulated – U.S. Electric & Gas Regulated – Canadian & Caribbean Electric & Gas 3,946 1,087 724 851 748 536 FortisBC Energy 2,875 599 588 564 568 556 FortisAlberta 703 141 147 143 140 132 FortisBC Electric 2,353 419 439 451 465 579 Other Electric (2) 9,877 2,246 1,898 2,009 1,921 1,803 Total Regulated – Canadian & Caribbean Electric & Gas 154 35 31 29 28 31 Non - Regulated 22,287 4,752 4,470 4,579 4,159 4,327 Total Capital Plan (1) Capital Plan is a forward - looking Non - U.S. GAAP financial measure calculated in same manner as Capital Expenditures. Refer to Q2 2023 MD&A for the Non - U.S. GAAP reconciliation. U.S. dollar - denominated capital expenditures converted at a forecast USD:CAD foreign exchange rate of 1.30. (2) Includes Eastern Canadian and Caribbean electric utilities. 2023 - 2027 CAPITAL PLAN BY BUSINESS UNIT
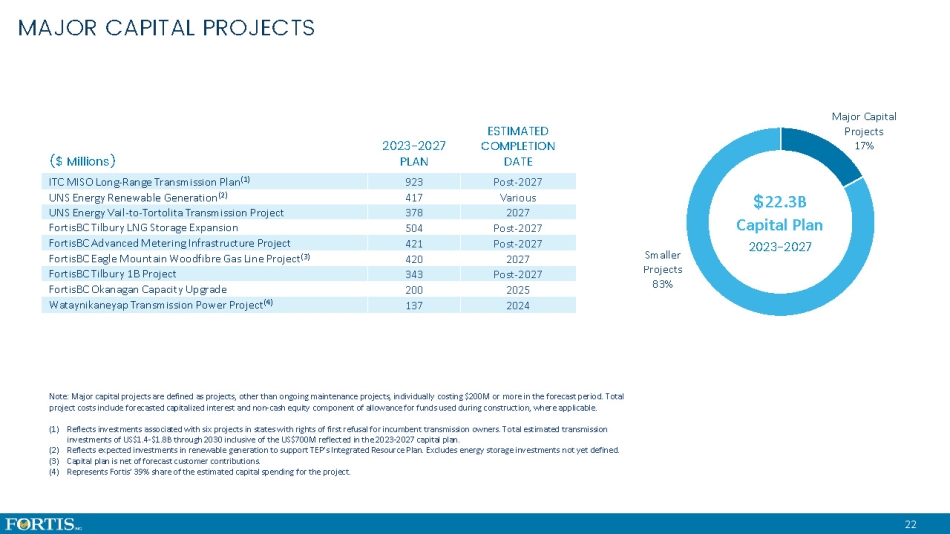
22 ESTIMATED COMPLETION DATE 2023 - 2027 PLAN ($ Millions) Post - 2027 923 ITC MISO Long - Range Transmission Plan (1) Various 417 UNS Energy Renewable Generation (2) 2027 378 UNS Energy Vail - to - Tortolita Transmission Project Post - 2027 504 FortisBC Tilbury LNG Storage Expansion Post - 2027 421 FortisBC Advanced Metering Infrastructure Project 2027 420 FortisBC Eagle Mountain Woodfibre Gas Line Project (3) Post - 2027 343 FortisBC Tilbury 1B Project 2025 200 FortisBC Okanagan Capacity Upgrade 2024 137 Wataynikaneyap Transmission Power Project (4) Note: Major capital projects are defined as projects, other than ongoing maintenance projects, individually costing $200M or mor e in the forecast period. Total project costs include forecasted capitalized interest and non - cash equity component of allowance for funds used during construct ion, where applicable. (1) Reflects investments associated with six projects in states with rights of first refusal for incumbent transmission owners. T ota l estimated transmission investments of US$1.4 - $1.8B through 2030 inclusive of the US$700M reflected in the 2023 - 2027 capital plan. (2) Reflects expected investments in renewable generation to support TEP’s Integrated Resource Plan. Excludes energy storage inve stm ents not yet defined. (3) Capital plan is net of forecast customer contributions. (4) Represents Fortis’ 39% share of the estimated capital spending for the project. Major Capital Projects 17% Smaller Projects 83% $ 22.3B Capital Plan 2023 - 2027 MAJOR CAPITAL PROJECTS
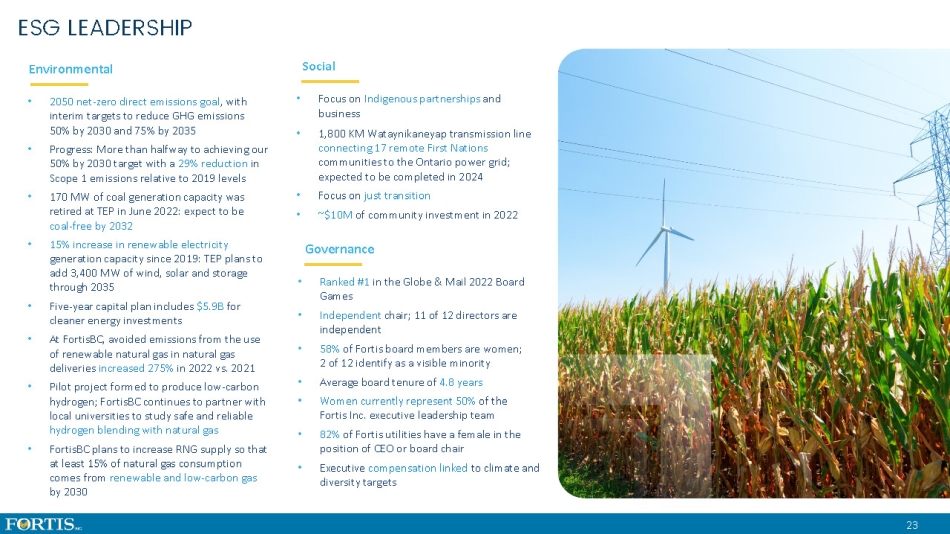
23 Environmental • 2050 net - zero direct emissions goal , with interim targets to reduce GHG emissions 50% by 2030 and 75% by 2035 • Progress: More than halfway to achieving our 50% by 2030 target with a 29% reduction in Scope 1 emissions relative to 2019 levels • 170 MW of coal generation capacity was retired at TEP in June 2022: expect to be coal - free by 2032 • 15% increase in renewable electricity generation capacity since 2019: TEP plans to add 3,400 MW of wind, solar and storage through 2035 • Five - year capital plan includes $5.9B for cleaner energy investments • At FortisBC, avoided emissions from the use of renewable natural gas in natural gas deliveries increased 275% in 2022 vs. 2021 • Pilot project formed to produce low - carbon hydrogen; FortisBC continues to partner with local universities to study safe and reliable hydrogen blending with natural gas • FortisBC plans to increase RNG supply so that at least 15% of natural gas consumption comes from renewable and low - carbon gas by 2030 • Focus on Indigenous partnerships and business • 1,800 KM Wataynikaneyap transmission line connecting 17 remote First Nations communities to the Ontario power grid; expected to be completed in 2024 • Focus on just transition • ~$10M of community investment in 2022 • Ranked #1 in the Globe & Mail 2022 Board Games • Independent chair; 11 of 12 directors are independent • 58% of Fortis board members are women; 2 of 12 identify as a visible minority • Average board tenure of 4.8 years • Women currently represent 50% of the Fortis Inc. executive leadership team • 82% of Fortis utilities have a female in the position of CEO or board chair • Executive compensation linked to climate and diversity targets Social Governance ESG LEADERSHIP
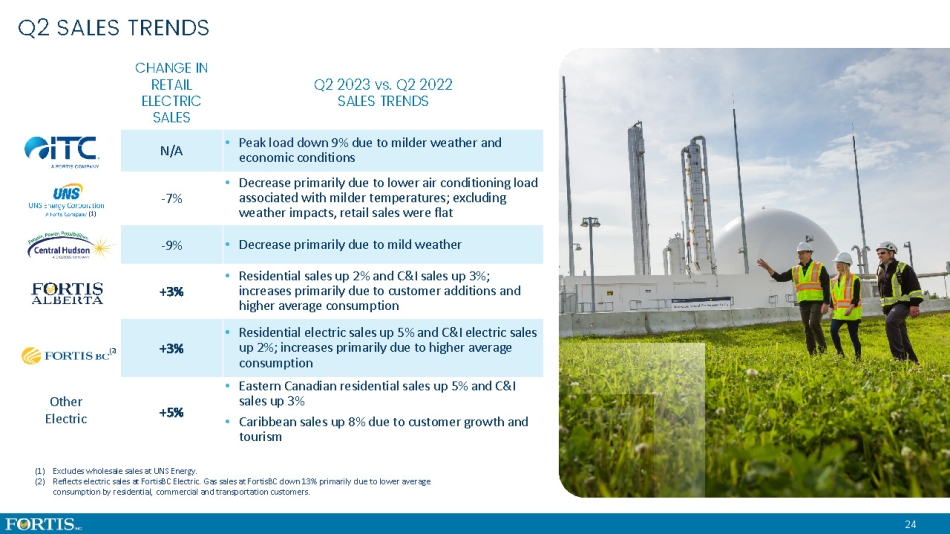
Other Electric (1) Excludes wholesale sales at UNS Energy. (2) Reflects electric sales at FortisBC Electric. Gas sales at FortisBC down 13% primarily due to lower average consumption by residential, commercial and transportation customers. Q2 2023 vs. Q2 2022 SALES TRENDS CHANGE IN RETAIL ELECTRIC SALES • Peak load down 9% due to milder weather and economic conditions N/A • Decrease primarily due to lower air conditioning load associated with milder temperatures; excluding weather impacts, retail sales were flat - 7% • Decrease primarily due to mild weather - 9% • Residential sales up 2% and C&I sales up 3%; increases primarily due to customer additions and higher average consumption +3% • Residential electric sales up 5% and C&I electric sales up 2%; increases primarily due to higher average consumption +3% • Eastern Canadian residential sales up 5% and C&I sales up 3% • Caribbean sales up 8% due to customer growth and tourism +5% (1) (2) Q2 SALES TRENDS 24

25 $- $0.5 $1.0 $1.5 $2.0 $2.5 $3.0 2023F 2024F 2025F 2026F 2027F 2028F 2029F 2030F 2031F 2032F Non-Regulated Regulated 10 - Year Average : $1.1B billions Note: Debt as at June 30, 2023 and excludes any new debt issuances during the forecast period. Excludes repayments of finance le ases along with the current portion of credit facilities, which are assumed to be extended by one - year annually. (1) Includes non - regulated debt issued at Fortis Inc. and ITC Holdings. (1) DEBT MATURITIES
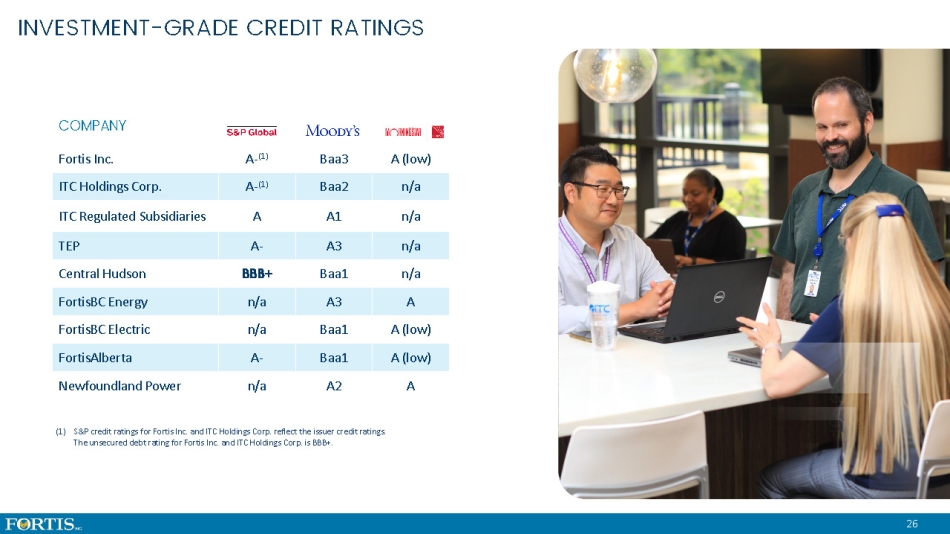
26 COMPANY A (low) Baa3 A - (1) Fortis Inc. n/a Baa2 A - (1) ITC Holdings Corp. n/a A1 A ITC Regulated Subsidiaries n/a A3 A - TEP n/a Baa1 BBB+ Central Hudson A A3 n/a FortisBC Energy A (low) Baa1 n/a FortisBC Electric A (low) Baa1 A - FortisAlberta A A2 n/a Newfoundland Power (1) S&P credit ratings for Fortis Inc. and ITC Holdings Corp. reflect the issuer credit ratings. The unsecured debt rating for Fortis Inc. and ITC Holdings Corp. is BBB+. INVESTMENT - GRADE CREDIT RATINGS
Fortis (NYSE:FTS)
Historical Stock Chart
From Apr 2024 to May 2024

Fortis (NYSE:FTS)
Historical Stock Chart
From May 2023 to May 2024
