PepsiCo on Pace for Record High After 3Q Earnings Results -- Data Talk
October 03 2019 - 11:37AM
Dow Jones News
PepsiCo, Inc. (PEP) is currently at $139.31, up $5.37 or
4.01%
-- Would be new all-time high (Based on available data back to
Jan. 21, 1972)
-- On pace for largest percent increase since July 10, 2018,
when it rose 4.76%
-- Earlier Thursday, PepsiCo reported third-quarter adjusted
earnings were $1.56 a share, beating FactSet's analyst consensus
estimate by 6 cents a share
-- The company said organic revenue growth, which strips out
currency swings and acquisitions -- was up 4.3% in the period. The
company is now guiding to either meet or beat its expectations for
organic revenue growth of 4% for the year
-- Currently up three of the past four days
-- Up 26.1% year-to-date; on pace for best year since 2000, when
it rose 40.6%
-- Up 30.67% from 52 weeks ago (Oct. 4, 2018), when it closed at
$106.61
-- Would be a new 52 week closing high
-- Up 32.6% from its 52 week closing low of $105.06 on Oct. 11,
2018
-- Traded as high as $139.31; new all-time intraday high (Based
on available data back to Jan. 21, 1972)
-- Up 4.01% at today's intraday high; largest intraday percent
increase since July 10, 2018, when it rose as much as 4.86%
-- Second best performer in the S&P 500 today
-- Best performer in the Nasdaq 100 today
All data as of 11:03:02 AM
Source: Dow Jones Market Data, FactSet
(END) Dow Jones Newswires
October 03, 2019 11:22 ET (15:22 GMT)
Copyright (c) 2019 Dow Jones & Company, Inc.
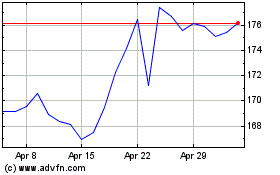
PepsiCo (NASDAQ:PEP)
Historical Stock Chart
From Jun 2024 to Jul 2024

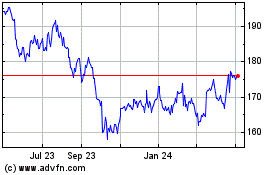
PepsiCo (NASDAQ:PEP)
Historical Stock Chart
From Jul 2023 to Jul 2024
