Calpers Discloses Private-Equity Fees
November 24 2015 - 1:10PM
Dow Jones News
The largest U.S. pension fund said it has paid $3.4 billion in
performance fees to private-equity managers since 1990, doling out
$700 million in the past year alone.
The California Public Employees' Retirement System, known by its
abbreviation Calpers, disclosed the performance-related expenses
for the first time Tuesday. Calpers said those performance fees
were based on returns of $24.2 billion since 1990 and $4.1 billion
for the year ended June 30.
Pension funds across the country for years have failed to either
ask or disclose how much private-equity firms kept in performance
fees, which are the biggest source of profits for outside money
managers.
Scrutiny to provide such detail on private-equity costs has
escalated in recent months, as Calpers and other public pension
funds look to reduce the number of outside managers they partner
with and the investment profits they have to share with them. The
Sacramento, Calif.-based Calpers has assets of around $295 billion,
according to its most-recent disclosure.
Private-equity firms buy companies using money from pension
funds and other investors, hoping to earn more in a sale or public
offering later on. They typically charge clients a management fee
of 1% to 2% of assets and a performance fee of about 20% of the
gains when they sell companies for a profit.
Calpers has about 10% of its portfolio, or $28.7 billion,
invested with private-equity firms. Calpers has investments with
more than 700 private-equity funds and works with some of the
biggest names in the industry, including Blackstone Group LP and
Carlyle Group LP.
Private equity is Calpers' top-performing asset, producing
returns of 11.9% over the past decade, the pension fund said.
"Private equity is a complicated asset class and the Board and
investment office staff will now have even more insight into our
program," said Henry Jones, Calpers investment committee chair, in
a statement.
Write to Timothy W. Martin at timothy.martin@wsj.com
Subscribe to WSJ: http://online.wsj.com?mod=djnwires
(END) Dow Jones Newswires
November 24, 2015 12:55 ET (17:55 GMT)
Copyright (c) 2015 Dow Jones & Company, Inc.
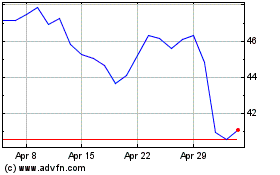
Carlyle (NASDAQ:CG)
Historical Stock Chart
From Jun 2024 to Jul 2024

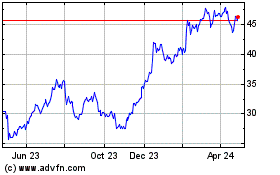
Carlyle (NASDAQ:CG)
Historical Stock Chart
From Jul 2023 to Jul 2024
