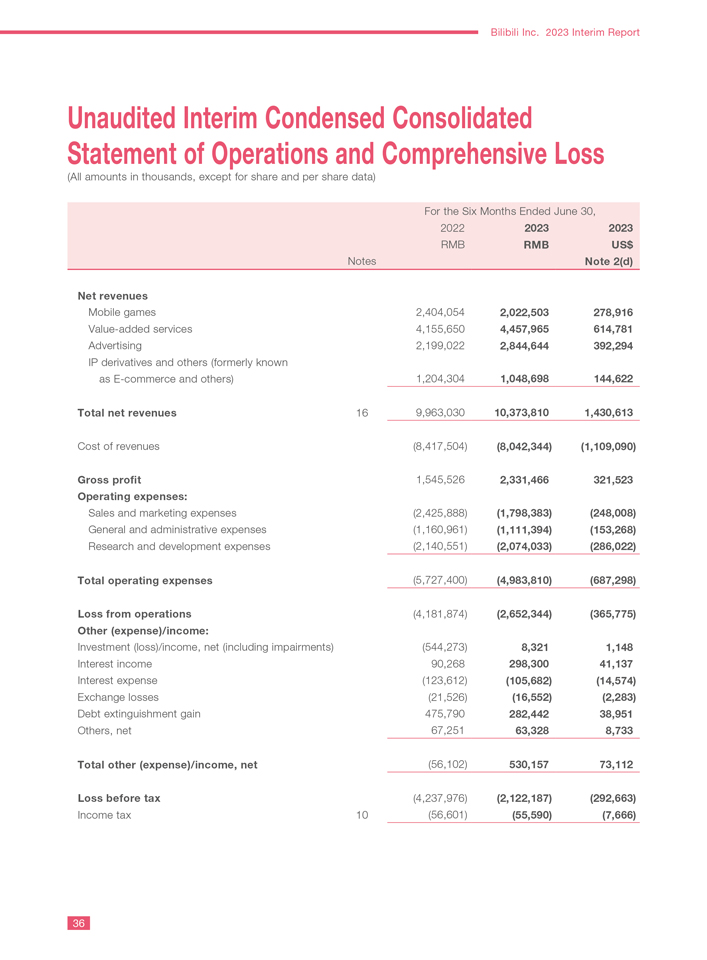
Bilibili Inc. 2023 Interim Report Unaudited Interim Condensed Consolidated Statement of Operations and Comprehensive Loss (All amounts
in thousands, except for share and per share data) For the Six Months Ended June 30, 2022 2023 2023 RMB RMB US$ Notes Note 2(d) Net revenues Mobile games 2,404,054 2,022,503 278,916 Value-added services 4,155,650 4,457,965 614,781 Advertising
2,199,022 2,844,644 392,294 IP derivatives and others (formerly known as E-commerce and others) 1,204,304 1,048,698 144,622 Total net revenues 16 9,963,030 10,373,810 1,430,613 Cost of
revenues (8,417,504) (8,042,344) (1,109,090) Gross profit 1,545,526 2,331,466 321,523 Operating expenses: Sales and marketing expenses (2,425,888) (1,798,383) (248,008) General and administrative expenses (1,160,961) (1,111,394) (153,268) Research
and development expenses (2,140,551) (2,074,033) (286,022) Total operating expenses (5,727,400) (4,983,810) (687,298) Loss from operations (4,181,874) (2,652,344) (365,775) Other (expense)/income: Investment (loss)/income, net (including
impairments) (544,273) 8,321 1,148 Interest income 90,268 298,300 41,137 Interest expense (123,612) (105,682) (14,574) Exchange losses (21,526) (16,552) (2,283) Debt extinguishment gain 475,790 282,442 38,951 Others, net 67,251 63,328 8,733 Total
other (expense)/income, net (56,102) 530,157 73,112 Loss before tax (4,237,976) (2,122,187) (292,663) Income tax 10 (56,601) (55,590) (7,666) 36