XRP Resilience Sparks Further Gains As Price Surpasses $0.466 Level
July 13 2024 - 10:30AM
NEWSBTC
Recently, the price of XRP with a bullish momentum has made a
significant surge above the $0.4663 resistance mark. This upside
movement has jarred up optimism among investors and market
analysts, leading to speculation about whether the next anticipated
target of $0.5724 is within reach. As XRP continues to gain
pace, this article delves into providing an in-depth analysis of
XRP’s current price action and analyzes technical indicators to
answer the question of whether this rally can sustain its momentum
and achieve new heights or if a correction is imminent. With a
market capitalization of more than $28 billion and a trading volume
of more than $2 billion as of the time of writing, the price of XRP
is currently up by 11.55%, trading at around $0.5088 in the last 24
hours. Its market cap and trading volume are currently up by 11.60%
and 73.65% respectively. XRP Breakthrough At $0.466: Analyzing The
Surge On the 4-hour chart, the price of XRP has actively risen with
strong momentum above the 100-day Simple Moving Average (SMA) and
the $0.4663 resistance level. Additionally, it can be observed that
the cryptocurrency asset is currently making a bullish move toward
the $0.5724 mark. The formation of the 4-hour Relative Strength
Index (RSI) also suggests that XRP’s price may extend its bullish
move toward the $0.5724 resistance level as the signal line of the
indicator has been maintaining a steady movement above 50% and is
currently trending inside the overbought zone. On the 1-day chart,
it can be observed that the crypto asset has been on a bullish move
since after the failure to close below the $0.4088 support level
successfully and is currently attempting to move above the 100-day
SMA toward the $0.5724 resistance level. Lastly, an analytical
examination of the formation of the 1-day RSI reveals that XRP
could sustain its bullish rally toward the $0.4233 resistance mark
as the signal line of the indicator has risen above 50% and is
heading for the overbought zone. Potential Risks And Resistance
Levels Ahead If XRP can maintain its current bullish momentum to
reach the $0.5724 resistance level and close above, it may continue
to move upward to challenge the $0.6697 resistance level. If this
level is breached, the digital asset may experience further price
gain toward the $0.7342 resistance level and possibly other levels
above. Conversely, should XRP pull back at $0.5724, it will start
to decline once more toward the $0.3389 support level. Furthermore,
the crypto asset may see further price decline to challenge the
$0.3483 support level and perhaps other levels below if this level
is broken. Featured image from Adobe Stock, chart from
Tradingview.com
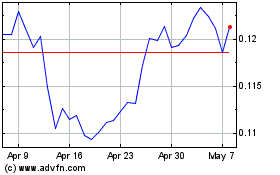
TRON (COIN:TRXUSD)
Historical Stock Chart
From Jun 2024 to Jul 2024

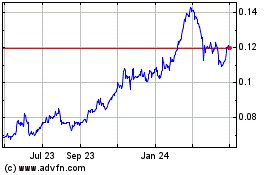
TRON (COIN:TRXUSD)
Historical Stock Chart
From Jul 2023 to Jul 2024
