Bitcoin Price Surges Towards $61,000, Eyeing Potential Breakout To $67-$68k Range
May 03 2024 - 6:00PM
NEWSBTC
Bitcoin (BTC), the largest cryptocurrency in the market, has
experienced a notable resurgence in its bullish momentum, with the
Bitcoin price reclaiming the crucial $61,000 threshold. This
recovery follows a week-long downtrend that led to a 20% drop to
$56,000 on Wednesday. As the bullish momentum returns, the
possibility of further testing upper resistance levels and
reclaiming previously lost price levels grows stronger. Bitcoin
Bulls Eye $68,000 According to market expert Justin Bennett, a
recovery of the $61,000 resistance level would open up potential
areas such as $67,000 to $68,000. However, at the present moment,
this level continues to pose a significant resistance. Related
Reading: Standard Chartered Bank Analysts Sound Warning Alarm:
Bitcoin Price Can Still Drop To $50,000 Analyzing the recent
correction in the Bitcoin price, analyst Crypto Con suggests that
the market correction was necessary for the long-term price
trajectory. The full retest of the 20-week Exponential Moving
Average (EMA) support at $56,700 and the return to indicator
support zones, such as the Directional Movement Index, indicate a
healthy price consolidation. In addition to the technical
indicators, on-chain and market data analytics firm CryptoQuant’s
founder and CEO, Ki Young Ju, highlights the current bullish
sentiment. According to their data, whales accumulated a
significant amount of Bitcoin, totaling 47,000 BTC, within the past
24 hours. This increased accumulation by large investors further
bolsters the positive outlook for Bitcoin’s price. Bitcoin Price
Poised For Bullish Surge Crypto analyst Titan of Crypto has
provided further bullish predictions for the Bitcoin price,
suggesting that recent corrections have resulted in the grabbing of
leverage longs liquidity. In addition, the Stochastic Relative
Strength Index (RSI)on the 5-day chart is on the verge of crossing
into bullish territory. This occurrence has historically been
followed by an upward price movement in Bitcoin, leading to higher
highs. Such a pattern has the potential to fuel renewed investor
confidence and attract further buying pressure. Related Reading:
Why This Crypto Bull Run Might Not Live Up To The Past: Analyst
Another positive signal highlighted by Titan of Crypto is the
recent buy signal generated by the Supertrend indicator, as seen in
the chart below. This technical tool helps identify trends in an
asset’s price movement. The buy signal, which occurred just
three months ago, implies that Bitcoin may still have significant
room for growth before reaching its cycle top. According to the
analyst, historical data suggests that the average duration from
the buy signal to the cycle top is approximately 19 months,
indicating the potential for a sustained upward trend. Currently
trading at $61,600, Bitcoin has seen a significant increase of 4.7%
in the last 24 hours alone. It remains to be seen if BTC will
successfully break above resistance levels, while also challenging
the ability of previously retested support levels to withstand
potential future downtrends. Featured image from Shutterstock,
chart from TradingView.com
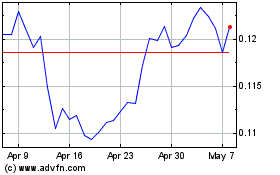
TRON (COIN:TRXUSD)
Historical Stock Chart
From Apr 2024 to May 2024

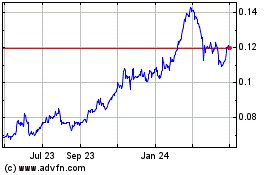
TRON (COIN:TRXUSD)
Historical Stock Chart
From May 2023 to May 2024
