MVRV Ratio Reveals Bitcoin’s Market Position Amid Short-Term Selling Pressure
January 29 2025 - 3:00PM
NEWSBTC
Bitcoin (BTC) has shown a swift recovery, climbing back above
$95,000 after experiencing a notable dip below this level just a
day prior. This price rebound has reignited discussions among
analysts about the underlying market dynamics and potential future
trends. Recent insights from CryptoQuant contributors shed light on
key metrics influencing Bitcoin’s price behavior, focusing on the
Market Value to Realized Value (MVRV) Ratio. Related Reading:
Bitcoin Short-Term Holders Now Capitulating: Bottom Here? Current
Stance On MVRV Ratio And Its Implications For Bitcoin The MVRV
Ratio is a widely used metric that measures Bitcoin’s market value
relative to its realized value. It can be used to identify whether
the market is overbought or oversold. CryptoQuant analyst
KriptoBaykusV2 has analyzed the current MVRV Ratio, which stands at
2.2, indicating a balanced market state. This metric offers
valuable insights into Bitcoin’s price cycles, shedding light on
historical overbought and oversold conditions. The MVRV Ratio is
calculated by dividing Bitcoin’s market value (the total Bitcoin
supply multiplied by its current price) by its realized value (the
aggregate value of all Bitcoins based on their last movement
price). This ratio provides insight into the profitability of
Bitcoin holders, helping to gauge market sentiment. Historically,
an MVRV above 3 has signaled overbought conditions with higher
correction risks, as seen during the 2017 and 2021 bull runs.
Conversely, an MVRV below 1 has identified oversold zones, marking
potential buying opportunities during bear markets like those in
2018 and 2020. Currently, with the MVRV Ratio at 2.2, the market is
in a neutral state, suggesting neither overbought nor oversold
conditions. This indicates a balanced environment with the
potential for trend shifts. According to KriptoBaykusV2, the MVRV
Ratio’s position provides critical signals for both short-term
traders seeking tactical opportunities and long-term investors
aiming for strategic positioning. Selling Pressure and Short-Term
Market Trends Meanwhile, another CryptoQuant analyst, G a a h,
highlighted the prevailing short-term selling pressure affecting
Bitcoin’s market dynamics. The Take Buy Sell Ratio indicator
reveals that selling activity outweighs buying, suggesting that
supply currently exceeds demand. This trend is often observed
during profit-taking phases near resistance levels, resulting in
price corrections or sideways trading. Additionally, short-term
holders are reportedly liquidating positions, with many sales
occurring at little to no profit. This behavior contributes to
increased market volatility and short-term downward pressure on
Bitcoin’s price. Although Bitcoin has seen a quick recovery in
price now trading above $96,000, G a a h wrote: On the price chart,
a bearish structure is forming with a high probability of
continuation given the circumstances in the data presented.
Featured image created with DALL-E, Chart from TradingView
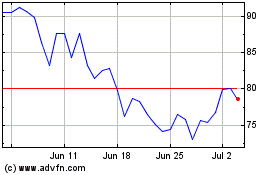
Quant (COIN:QNTUSD)
Historical Stock Chart
From Jan 2025 to Feb 2025

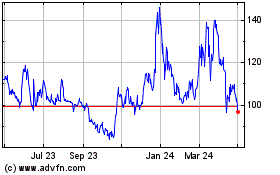
Quant (COIN:QNTUSD)
Historical Stock Chart
From Feb 2024 to Feb 2025
