Dogecoin Could Be Preparing For Next Big Rally, Analyst Explains
October 08 2024 - 8:30AM
NEWSBTC
An analyst has explained how Dogecoin could currently be gearing up
for the next bull run if historical pattern is anything to go by.
Dogecoin Has Recently Shown Similar Trend To Past Cycles In a new
post on X, analyst Ali Martinez has discussed about how Dogecoin
has been forming a familiar pattern in its monthly price recently.
Below is the chart shared by the analyst, which depicts the pattern
in question. As is visible in the graph, Dogecoin had been stuck
inside a long Descending Triangle between 2021 and 2024. The
“Descending Triangle” here refers to a technical analysis (TA)
pattern that, as its name suggests, looks like a triangle slopped
downwards. Related Reading: Bitcoin Miner Selloff Is Calming Down:
Green Sign For Rally To Continue? In this pattern, the price of the
asset consolidates between two lines: a bottom level parallel to
the time-axis and an upper level converging towards the bottom
level. Like other TA patterns, the upper level is probable to act
as resistance, while the bottom one as support. Also, a break out
of either of these lines can imply a continuation of trend in that
direction. From the chart, it’s visible that Dogecoin managed to
find a break above its multi-year Descending Triangle this year and
as the pattern foreshadowed, the surge above the upper level led to
a sharp rally, in which the memecoin’s price saw an appreciation of
almost 208%. Since the top of the run, though, the asset has
witnessed a peak retracement of around 65% so far. This
development, however, may not actually be bad, as the analyst has
pointed out that the chain of events that Dogecoin has gone through
in recent years is in fact similar to what happened on two other
occasions in the past. In both of these instances, DOGE broke out
of a multi-year Descending Triangle to observe a sharp rally,
followed by a retracement of a similar scale as the one witnessed
recently. The memecoin then went on to observe full-blown bull runs
in both of these cases. Based on this historical pattern, Martinez
notes, “after a recent 65% pullback, DOGE could be gearing up for
the next big rally!” It now remains to be seen how the asset’s
price develops from here and whether any similar rally would follow
this time as well or not. Related Reading: XRP Crashes 14% As
Whales Send Deposits To Exchanges In some other news, whales have
shown rising activity on the Dogecoin network recently, as the
analyst has pointed out in another X post. This increased activity
from the large holders can lead to more volatility for Dogecoin,
which could be towards a net upside if the whales are making these
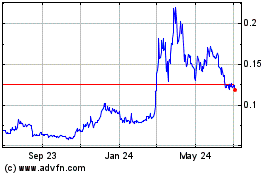
transfers for buying purposes. DOGE Price At the time of writing,
Dogecoin is trading around $0.11, down more than 7% over the last
week. Featured image from Dall-E, IntoTheBlock.com, chart from
TradingView.com
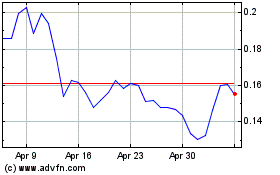
Dogecoin (COIN:DOGEUSD)
Historical Stock Chart
From Oct 2024 to Nov 2024

Dogecoin (COIN:DOGEUSD)
Historical Stock Chart
From Nov 2023 to Nov 2024
