In recent years, the energy sector has been through major
upheavals attributable to a series of unwanted episodes in the
global economy. Starting from the oil spill in the Gulf of Mexico
to the broader European debt crisis, these events have collectively
resulted in huge volatility in the energy sector (Two Energy ETFs
Holding Their Ground).
In fact, energy-based ETFs were hard hit during 2012 due to a
sluggish oil market. For most of 2012, energy ETFs were in the red
with some recovery witnessed only in the latter part of the
year.
A rebound in energy prices in the second half gave some life to
energy ETFs though, with some strong performances pushing the space
higher. This continued in the start of 2013 only to shed most of
the gains as the year progressed, thereby trailing the broader
market index.
However, as oil prices have come back a bit in recent trading,
some are optimistic about a broader recovery in the space heading
into the summer. In fact last week the sector came out second best
after technology suggesting to some that a recovery may be underway
in the space.
What’s Behind the Surge?
Recently the dollar, having gained strength against other world
currencies for much of 2013, has finally lost its momentum. This
led to a rise in oil prices which inevitably benefited energy
companies. Also, strong earnings reported by some of the oil and
gas producer companies led to a rally in the S&P energy
sector.
The surge in the energy sector is mainly due to a rise in U.S.
oil production. The U.S. which is the largest consumer of oil has
spurred energy production by leaps and bounds. This has indeed
given a strong boost to energy stocks and ETFs. This is especially
true for the companies engaged in the drilling and extraction of
oil (Energy ETFs: Strong Start to 2013).
Also, innovative technologies along with streamlined
industrialization are assisting in ramping up the production of oil
in the U.S. Exploitation of resources like shale, natural gas and
fossil fuel are driving investors towards the energy sector.
ETFs to Watch
The strong fundamentals in the energy sector are positively
impacting Energy Select Sector SPDR Fund
(XLE). XLE, after
recording a very subtle return for most of the year, finally seems
to be gaining strength backed by strong energy sector momentum. In
fact, the ETF is just slightly behind the broader market index.
XLE is one of the most popular ways to tap the energy sector.
Given the current bullish trend in oil production in the U.S., this
ETF represents an effective way to capitalize on the strength as
oil companies play a substantial role in the performance of the
fund (read 5 Sector ETFs Surging to Start 2013).
Oil Gas & Consumables Fuels companies form 79.06% of the ETF
portfolio while the rest goes to energy equipment & services.
The high level of concentration in the oil sector companies could
prove to be a boon for the fund if oil prices gain momentum
further.
The fund since the start of the year has posted gains of 13.08%.
This is a huge gain when compared with the overall 2012 gain of
5.21% (Time to Buy Energy ETFs?).
The ETF is home to 46 stocks in which it invests an asset base
of $7.7 billion. The fund appears to be highly concentrated as it
is 60% dependent on the top ten holdings for its performance.
In fact, two oil giants, Exxon and Chevron, take up nearly 32%
of the asset base. The fund charges a fee of 18 basis points
annually.
The fund is trading near its all time high. In the Tuesday
trading session, the ETF touched the $80.98 mark which is a penny
higher than what the fund had recorded post crisis in Mar 2011
(Three ETFs for The Energy Efficiency Boom).
Investor should also note that XLE appears to be cheap relative
to the broader U.S. market as indicated by its P/E. Therefore it is
pretty inexpensive compared to other industries. XLE has a P/E
ratio of 13.09 as compared to the P/E ratio of 14.74 for
SPDR S&P 500 ETF
(SPY).

Other ETFs
iShares U.S. Energy ETF
(IYE)
IYE offers a broader exposure to oil and gas companies in which
Oil & Gas Producers form 74.68% of the fund while Oil
Equipment, Services & Distribution companies take 25.11% of the
asset base.
The fund is home to 88 securities in which it invests an asset
base of $1.2 billion. The fund is heavily invested in the top ten
holdings as revealed by its concentration level of 63.6% (Three
ETFs With Incredible Diversification).
Among individual holdings, Exxon, Chevron and Schlumberger form
the top line of the fund. All the three companies get a share of
43.57% in total in the fund. The fund charges a fee of 46 basis
points. In the year-to-date period, the fund has delivered a return
of 6.1%.
Market Vectors Oil Services ETF
(OIH)
OIH appears to be quite popular among investors as revealed by
its trading volume of more than 3 million shares a day. The fund
since its inception in Dec 2011 has been able to build an asset
base of $1.7 billion (Oil Bull Market Is No Place For MLP ETF
Investors).
The fund appears to invest its rich asset base in a holding of
26 securities which are mostly large cap companies. However, the
fund has not been able to minimize company-specific risk as 67.1%
of the asset base goes towards the top ten holdings.
The fund has assigned heavy weighting to the top two holdings
namely Schlumberger Ltd and Halliburton Co. The allocation to the
two companies stand at 27.7%. The fund charges a fee of 35 basis
points annually.
The performance of the fund after the recent rise in oil
production has been striking. The fund delivered a return of 15.87%
in the year-to-date period.
Want the latest recommendations from Zacks Investment Research?
Today, you can download 7 Best Stocks for the Next 30
Days. Click to get this free report >>
ISHARS-DJ EGY (IYE): ETF Research Reports
MKT VEC-OIL SVC (OIH): ETF Research Reports
SPDR-EGY SELS (XLE): ETF Research Reports
To read this article on Zacks.com click here.
Zacks Investment Research
Want the latest recommendations from Zacks Investment Research?
Today, you can download 7 Best Stocks for the Next 30 Days. Click
to get this free report
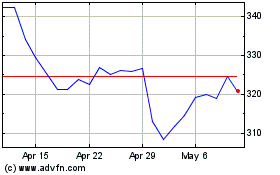
VanEck Oil Services ETF (AMEX:OIH)
Historical Stock Chart
From Jan 2025 to Feb 2025

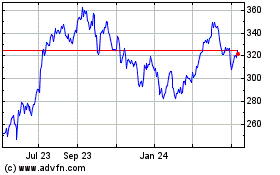
VanEck Oil Services ETF (AMEX:OIH)
Historical Stock Chart
From Feb 2024 to Feb 2025
