More Trouble for Oil Services ETFs? - ETF News And Commentary
April 18 2013 - 9:00AM
Zacks
The recent crash in the precious metal space has rocked
commodity investors. Metals like gold and silver have faced the
wrath of the vicious sell-off in the commodity space earlier in the
week, losing double digits in many cases (read Brutal Trading
Continues in Gold Mining ETFs).
Unfortunately, along with precious metals, other commodities as
well as commodity producers have seen a vicious plunge in prices as
well. This has created a huge dent in what was until recently ever
increasing positive sentiment.
Speaking of energy commodities, these have had a good start to
the year, particularly after a forgetful year in 2012. In fact the
energy commodities for long have been plagued by falling prices on
account of oversupply as well as reduced industrial demand.
It was also reflected in the top and bottom lines of energy
companies as the energy sector proved to be one of the laggards for
the S&P 500. However, after a good start to the year, it seems
that the energy commodities, especially oil – is most likely to
continue its weak trend from the previous fiscal year (see Two
Niche ETFs Beating SPY).
Nevertheless, a closer look at the chart of Market
Vectors Oil Services ETF (OIH) reveals that oil services
companies might be in for a tough time ahead. OIH tracks the
performance of 26 oil services stocks and thus provides great
exposure to the broad segment.

The chart above represents a one year daily price chart of OIH.
As we can see, after a brief surge upwards initially in 2013, the
ETF found a top around the middle of February. Since then the
trading action has been pretty choppy, to say the least (read Gold
ETFs in Focus: When to Consider GLDI).
Although the ETF still continues to be in a long term uptrend as
indicated by the upward rising support line, the short term picture
is pretty bleak. Since reaching the top, the near term weakness has
well and truly crept into the ETF and is seen to make lower highs
and lows.
Furthermore, the recent downward momentum is most likely to take
the ETF further down. In fact the long and short term trend has
caused a triangle formation in the ETF which it has very recently
broken to the downside.
And the downward momentum on this occasion seems to be pretty
strong as the ETF has seen significantly higher trading volumes
(encircled portion in the volumes chart) while the breakout
occurred (see Small Cap Japan ETFs: Overlooked Winners?).
Downward pressure in oil prices coupled with a strong U.S.
dollar will surely take a toll on the ETF. Still, after the recent
volatile trading sessions, it is unlikely that the ETF will plunge
very soon.
Instead a more realistic course of action would be a brief
consolidation at current levels since the ETF seems to be quite
oversold. Though we think that the fund could plunge further after
this consolidation period. The same is concurred by the RSI and
Williams R data which show an oversold reading.
Bottom Line
As is quite evident, the ETF is extremely correlated with prices
of oil, therefore any weakness in the energy commodity is likely to
show up in the ETF as well. This is particularly important
considering the fact that oil prices have also been facing downward
pressure for quite a long time.
Also, the investment case for oil remains rather bleak in the
near term. This explains that the weakness in the ETF is here to
stay for some more time.
Furthermore, OIH has a Zacks ETF Rank of 3 or ‘Hold’; therefore
we are not looking for great things from the ETF in the near term
either. The ETF has a ‘High’ risk outlook as well, so investors
should probably avoid this volatile and uncertain oil fund for the
time being.
Want the latest recommendations from Zacks Investment Research?
Today, you can download 7 Best Stocks for the Next 30
Days. Click to get this free report >>
MKT VEC-OIL SVC (OIH): ETF Research Reports
US-OIL FUND LP (USO): ETF Research Reports
To read this article on Zacks.com click here.
Zacks Investment Research
Want the latest recommendations from Zacks Investment Research?
Today, you can download 7 Best Stocks for the Next 30 Days. Click
to get this free report
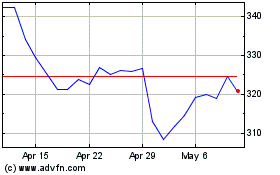
VanEck Oil Services ETF (AMEX:OIH)
Historical Stock Chart
From Dec 2024 to Jan 2025

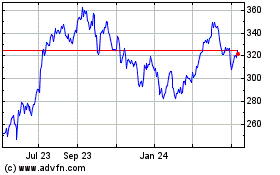
VanEck Oil Services ETF (AMEX:OIH)
Historical Stock Chart
From Jan 2024 to Jan 2025
