Persisting worries about Europe's sovereign debt crisis
crippling the continent’s economy, high U.S. crude stocks and
worries about China’s growth outlook have been weighing on investor
sentiment. The concern has weakened oil prices to a seven-month low
of around $90 a barrel.
This unfavorable view has been partly offset by a tightening
global supply picture in view of the geopolitical fallout over
Iran's alleged nuclear ambitions and strong demand from developing
countries (Commodity ETFs Plunge on Supply Forecast).
As such, crude oil’s near-term fundamentals remain mixed, to say
the least. The long-term outlook for oil, however, remains
favorable given the commodity’s constrained supply picture.
In particular, while the Western economies exhibit sluggish
growth prospects, global oil consumption is expected to get a boost
from continued strength in the major emerging powers like India and
Brazil that continue to grow at a healthy rate.
According to the Energy Information Administration (EIA), which
provides official energy statistics from the U.S. Government, world
crude consumption grew by an estimated 0.8 million barrels per day
in 2011 to a record-high level of 87.9 million barrels per day
(Inside The Forgotten Energy ETFs).
In 2010, oil demand increased by over 2 million barrels per day
to 87.1 million barrels per day, which more than made up for the
losses of the previous two years, and surpassed the 2007 level of
86.3 million barrels per day (reached prior to the economic
downturn).
Global demand of crude oil for 2009 was below the 2008 level,
which itself was below the 2007 level – the first time since the
early 1980’s of two back-to-back negative growth years (Three ETFs
for The Unconventional Oil Revolution).
The agency, in its most recent Short-Term Energy Outlook, said
that it expects global oil demand growth of 1.0 million barrels per
day in 2012 and 1.2 million barrels per day in 2013. EIA’s latest
forecasts assumes that demand will decline in North America and
Europe but this will be more than made up by impressive consumption
surge coming from China, the Middle East, Central and South
America.
Separately, the Organization of the Petroleum Exporting
Countries (OPEC) -- which supplies around 40% of the world's crude
-- predicts that global oil demand would increase by 0.9 million
barrels per day annually, reaching 88.7 million barrels a day in
2012 from last year’s 87.8 million barrels a day.
Lastly, the third major energy consultative body, the
Paris-based International Energy Agency (IEA), the
energy-monitoring body of 28 industrialized countries, said that it
expects world oil consumption to grow by 0.8 million barrels per
day in 2012 to 90.0 million barrels per day.
In our view, crude oil prices in 2012 are likely to witness more
upside rather than downside, given the considerable supply
tightness in the market. While domestic demand is relatively soft
and the global economy still shows signs of weakness, the fact that
demand is outpacing supply appears to be evident.
As long as growth from developing nations continues and the
global output is unable to keep up, we are likely to experience a
surge in the price of a barrel of oil. With a world population of
seven billion people and all the easy oil being already discovered
and drilled for, we assume that crude will trade in the $90-$100
per barrel range in the near future as newer supplies of the key
commodity become harder to come by.
Thanks to these trends, some investors are looking to push into
this oil space (SWM Enters ETF World with Oil Sands ETF (SNDS)).
For investors seeking to play this trend in ETF form, the following
series of crude oil ETFs could make for interesting
picks:
United States Oil Fund
(USO)
The United States Oil Fund LP is a domestic exchange-traded
security designed to track the movements of West Texas Intermediate
(WTI) light, sweet crude oil. USO issues units that may be
purchased and sold on the NYSE
Arca.
The objective of the fund is to track the daily changes in
percentage terms of the net asset value of the unit to reflect the
daily changes in percentage terms of the spot price of light sweet
crude oil.
This is as measured by the changes in price of the futures
contract on light sweet crude oil traded on the NYMEX that is the
near month contract to expire, except when the near month contract
is within two weeks of expiration, in which case it is measured by
the futures contract that is the next month contract to expire.
The fund appears to be liquid and trades with the volume of more
than 9 million shares a day. USO manages assets under management of
$1,264.7 million. The investment is in a portfolio consisting of
listed crude oil futures contracts and other oil-related futures
and may consist of forwards and swap contracts.
These investments will be collateralized by cash, cash
equivalents and U.S. government obligations with remaining
maturities of two years or less (Play an Oil Bull with These Three
Emerging Market ETFs).
The fund charges an expense ratio of 45 basis points making it a
relatively low cost choice in the space.
S&P GSCI Crude Oil Total Return Index ETN
(OIL)
S&P GSCI Crude Oil Total Return Index ETN has been designed
to provide investors with cost effective exposure to crude oil as
measured by the S&P GSCI Crude Oil Tot Return Index.
The S&P GSCI Crude Oil Total Return Index reflects the
returns that are potentially available through an unleveraged
investment in the West Texas Intermediate (WTI) crude oil futures
contract plus the Treasury bill rate of interest that could be
earned on funds committed to the trading of the underlying
contracts.
The fund offers liquidity to investors as over 2 million shares
trades in a day. The fund has assets under management of $449.4
million and charges an expense ratio of 75 basis points
annually.
PowerShares DB Oil Fund
(DBO)
The PowerShares DB Oil Fund is based on the DBIQ Optimum Yield
Crude Oil Index Excess Return managed by DB Commodity Services LLC.
The Index is a rules-based index composed of futures contracts on
Light Sweet Crude Oil (WTI) and reflects the performance of crude
oil (Beyond Corn: Three Commodity ETFs Surging this Summer).
The fund trades with the volume of 81,600 shares a day and has
assets under management of $601.3 million. The fund charges an
expense ration of 79 basis points suggesting that it could be a
relatively high cost product in the space.
PowerShares DB Energy Fund
(DBE)
The product tracks the DBIQ Optimum Yield Energy Index Excess
Return, which is a rules-based benchmark consisting of some of the
most heavily traded energy commodities on Earth.
Currently, the basket consists of just five commodities with the
vast majority tied up in oil and oil-derivatives. In fact, natural
gas accounts for just seven percent of the portfolio while light
crude, heating oil, Brent crude, and RBOB Gasoline account for
roughly 23% each of the fund. Investors should note that this
product is structured as a limited partnership for tax
purposes.
Liquidity is low in the ETF with volume of 18,200 shares in a
day (Guide to the 25 Most Liquid ETFs).The fund has managed to
build an asset base of just $158.1 million, while fees come in at
78 basis points a year.
Want the latest recommendations from Zacks Investment Research?
Today, you can download 7 Best Stocks for the Next 30
Days. Click to get this free report >>
PWRSH-DB EGY FD (DBE): ETF Research Reports
PWRSH-DB OIL FD (DBO): ETF Research Reports
IPATH-GS CRUDE (OIL): ETF Research Reports
US-OIL FUND LP (USO): ETF Research Reports
To read this article on Zacks.com click here.
Zacks Investment Research
Want the latest recommendations from Zacks Investment Research?
Today, you can download 7 Best Stocks for the Next 30 Days. Click
to get this free report
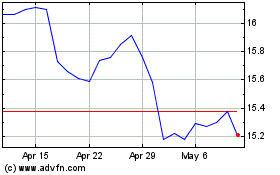
Invesco DB Oil (AMEX:DBO)
Historical Stock Chart
From May 2024 to Jun 2024

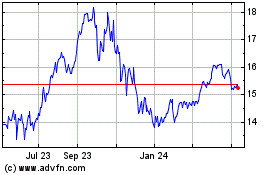
Invesco DB Oil (AMEX:DBO)
Historical Stock Chart
From Jun 2023 to Jun 2024
