MEDICAL PROPERTIES TRUST INC false 0001287865 0001287865 2024-05-09 2024-05-09


UNITED STATES

SECURITIES AND EXCHANGE COMMISSION

WASHINGTON, D.C. 20549


FORM 8-K


CURRENT REPORT

PURSUANT TO SECTION 13 OR 15(d)

OF THE SECURITIES EXCHANGE ACT OF 1934

Date of report (Date of earliest event reported): May 9, 2024


MEDICAL PROPERTIES TRUST, INC.

(Exact Name of Registrant as Specified in Charter)


Commission File Number 001-32559


Maryland   20-0191742

(State or other jurisdiction of

incorporation or organization)


(I.R.S. Employer

Identification No.)


1000 Urban Center Drive, Suite 501

Birmingham, AL

  35242
(Address of principal executive offices)   (Zip Code)

Registrant’s telephone number, including area code

(205) 969-3755


Check the appropriate box below if the Form 8-K filing is intended to simultaneously satisfy the filing obligation of the Registrant under any of the following provisions:


Written communications pursuant to Rule 425 under the Securities Act (17 CFR 230.425)


Soliciting material pursuant to Rule 14a-12 under the Exchange Act (17 CFR 240.14a-12)


Pre-commencement communications pursuant to Rule 14d-2(b) under the Exchange Act (17 CFR 240.14d-2(b))


Pre-commencement communications pursuant to Rule 13e-4(c) under the Exchange Act (17 CFR 240.13e-4(c))

Securities registered pursuant to Section 12(b) of the Act:


Title of each class


Trading
Symbol


Name of each exchange

on which registered

Common Stock, par value $0.001 per share, of Medical Properties Trust, Inc.   MPW   The New York Stock Exchange

Indicate by check mark whether the registrant is an emerging growth company as defined in Rule 405 of the Securities Act of 1933 (§230.405 of this chapter) or Rule 12b-2 of the Securities Exchange Act of 1934 (§240.12b-2 of this chapter).

Emerging growth company

If an emerging growth company, indicate by check mark if the registrant has elected not to use the extended transition period for complying with any new or revised financial accounting standards provided pursuant to Section 13(a) of the Exchange Act. ☐


Item 2.02. Results of Operations and Financial Condition.

On May 9, 2024, Medical Properties Trust, Inc. issued a press release announcing its financial results for the three months ended March 31, 2024. A copy of the press release is attached as Exhibit 99.1 to this Current Report on Form 8-K and is incorporated herein by reference. The information in this Current Report on Form 8-K, including the information set forth in Exhibit 99.1 and Exhibit 99.2 attached hereto, shall not be deemed “filed” for purposes of Section 18 of the Securities Exchange Act of 1934, as amended, or otherwise subject to the liability of that section or Sections 11 and 12(a)(2) of the Securities Act of 1933, as amended. In addition, this information shall not be deemed incorporated by reference in any filing of Medical Properties Trust, Inc. with the Securities and Exchange Commission, except as expressly set forth by specific reference in any such filing.

Item 9.01. Financial Statements and Exhibits.

(d) Exhibits.


Exhibit Number   

Description

99.1    Press release dated May 9, 2024 reporting financial results for the three months ended March 31, 2024
99.2    Medical Properties Trust, Inc. 1st Quarter 2024 Supplemental Information
104    Cover Page Interactive Data File (embedded within the Inline XBRL document)


2


SIGNATURES

Pursuant to the requirements of the Securities Exchange Act of 1934, as amended, the registrant has duly caused this report to be signed on its behalf by the undersigned hereunder duly authorized.


MEDICAL PROPERTIES TRUST, INC.
By:  

/s/ R. Steven Hamner

Name:   R. Steven Hamner
Title:   Executive Vice President and Chief Financial Officer

Date: May 9, 2024


3

Exhibit 99.1


LOGO


Contact: Drew Babin, CFA, CMA

Senior Managing Director of Corporate Communications

Medical Properties Trust, Inc.

(646) 884-9809

dbabin@medicalpropertiestrust.com

MEDICAL PROPERTIES TRUST, INC. REPORTS FIRST QUARTER RESULTS

Executed Total Liquidity Transactions of $1.6 Billion Year-to-Date, or 80% of MPT’s Initial FY 2024 Target

Debt, Net of Cash, Reduced by Approximately $1.6 Billion Since the First Quarter of 2023

Birmingham, AL – May 9, 2024 – Medical Properties Trust, Inc. (the “Company” or “MPT”) (NYSE: MPW) today announced financial and operating results for the first quarter ended March 31, 2024, as well as certain events occurring subsequent to quarter end.


Net loss of ($1.23) and Normalized Funds from Operations (“NFFO”) of $0.24 for the 2024 first quarter on a per share basis;


First quarter net loss included approximately $693 million ($1.16 per share) in impairments, primarily non-real estate adjustments related to Steward Health Care System (“Steward”) and the International Joint Venture;


Commenced rents in the first quarter at development properties leased to Lifepoint Behavioral in Texas and to IMED in Valencia, Spain;


Completed in April the sale of five hospitals in California and New Jersey to Prime Healthcare for $350 million;


Sold in April a 75% interest in five Utah hospitals operated by an affiliate of CommonSpirit Health to an institutional asset manager, resulting in approximately $1.1 billion of total proceeds;


Paid a regular quarterly dividend of $0.15 per share; and


Selected as Green Lease Leader by the Department of Energy’s Better Building Alliance and the Institute for Market Transformation.

Edward K. Aldag, Jr., Chairman, President and Chief Executive Officer, said, “We continue to execute a capital allocation strategy that we now expect will exceed our initial target of $2.0 billion in liquidity transactions in 2024. This strategy has repeatedly validated MPT’s approach to underwriting, demonstrated strong market demand for real hospital assets and provided immediate capital to reduce our debt.”

Mr. Aldag continued, “Regarding Steward’s recent filing for Chapter 11 bankruptcy, we expect this process may facilitate an orderly transition of Steward’s operations to new operators. As Steward continues these efforts, MPT has agreed to provide $75 million in DIP funding to ensure continued operations and continuity of patient care.


1


Looking ahead, we remain confident in the valuable role MPT serves in the healthcare ecosystem – providing operators with necessary financing solutions to optimize their capital stack and redirect resources towards caring for patients. We have constructed a highly diversified portfolio across geographies, operators, and facility types with significant long-term cash flow potential.”

Included in the financial tables accompanying this press release is information about the Company’s assets and liabilities, operating results, and reconciliations of net income (loss) to NFFO, including per share amounts, all on a basis comparable to 2023 results.

PORTFOLIO UPDATE

Medical Properties Trust has total assets of approximately $17.4 billion, including $11.3 billion of general acute facilities, $2.4 billion of behavioral health facilities and $1.7 billion of post-acute facilities. As of March 31, 2024, MPT’s portfolio included 436 properties and approximately 43,000 licensed beds leased to or mortgaged by 53 hospital operating companies across the United States as well as in the United Kingdom, Switzerland, Germany, Spain, Finland, Colombia, Italy and Portugal.

MPT’s operations in the U.K. and in Continental Europe continue to benefit from strong growth in reimbursement rates, overall volumes and high acuity admissions. While expense headwinds remain, particularly for labor and energy, most operators are reporting increasing operating profits year-over-year.

Across the Company’s U.S. portfolio, excluding facilities operated by Steward and Prospect Medical Holdings (“Prospect”), admissions are increasing almost universally across the general acute, inpatient rehabilitation (IRF) and inpatient behavioral portfolios. While reimbursement rates are not growing as fast as they are in Europe, they are generally accelerating, and our operators continue to succeed in reducing contract labor and limiting overall cost inflation.

In April, MPT achieved GOLD recognition as a 2024 Green Lease Leader by the Institute for Market Transformation and the U.S. Department of Energy’s Better Buildings Alliance. This represents an improvement versus its SILVER recognition last year, for implementing environmentally beneficial standards into executed lease agreements. To receive this recognition, the Company executed lease provisions requiring client energy and water disclosure and annual landlord-tenant engagement to discuss plans that optimize building performance.

During the first quarter of 2024, Steward paid cash rent of $9 million as scheduled on the consolidated master lease and cash interest of $2 million on various working capital and other loans. Steward continued to fully pay rent for the unconsolidated Massachusetts portfolio. Subsequent to MPT’s $60 million bridge loan extended to Steward in early January, the Company and Steward’s asset-backed creditors each funded $75 million of additional loans, which were anticipated as Steward proceeded with re-tenanting and business divestiture efforts.

As announced earlier this week, MPT has approved $75 million in debtor-in-possession financing following Steward’s decision to commence an in-court restructuring process under Chapter 11 of the U.S. Bankruptcy Code. The Company has not committed to additional funding and expects Steward to use the financing to ensure continuity of patient care while accelerating the re-tenanting of hospitals to new operators. Any debtor-in-possession financing terms are subject to approval of the bankruptcy court.


2


During the first quarter of 2024, Prospect paid cash rent and interest of $7 million to MPT. The estimated fair market value of MPT’s investment in PHP Holdings declined by approximately $60 million during the first quarter as the result of changes in independent third party appraisals.

OPERATING RESULTS AND OUTLOOK

Net loss for the first quarter ended March 31, 2024 was ($736 million) (($1.23) per share) compared to net income of $33 million ($0.05 per share) in the year earlier period. Net loss for the quarter ended March 31, 2024 included approximately $693 million ($1.16 per share) of impairments estimated and recorded pursuant to U.S. GAAP accounting rules and reflective of conservative assumptions regarding potential recoveries, which MPT remains committed to pursuing. These impairments included the full reserve of the Company’s approximate $360 million loan to Steward, its equity investment in Steward and its loan to the International Joint Venture.

NFFO for the first quarter ended March 31, 2024 was $142 million ($0.24 per share) compared to $222 million ($0.37 per share) in the year earlier period. The primary cause of the decrease in NFFO year-over-year was the significant decrease in revenue related to Steward.

A reconciliation of net (loss) income to FFO and NFFO, including per share amounts, can be found in the financial tables accompanying this press release.

CONFERENCE CALL AND WEBCAST

The Company has scheduled a conference call and webcast for May 9, 2024 at 11:00 a.m. Eastern Time to present the Company’s financial and operating results for the quarter ended March 31, 2024. The dial-in numbers for the conference call are 877-883-0383 (U.S.) and 412-902-6506 (International) along with passcode 1942886. The conference call will also be available via webcast in the Investor Relations section of the Company’s website, www.medicalpropertiestrust.com.

A telephone and webcast replay of the call will be available beginning shortly after the call’s completion. The telephone replay will be available through May 23, 2024, using dial-in numbers 877-344-7529 (U.S.), 855-669-9658 (Canada) and 412-317-0088 (International) along with passcode 8544788. The webcast replay will be available for one year following the call’s completion on the Investor Relations section of the Company’s website.

The Company’s supplemental information package for the current period will also be available on the Company’s website in the Investor Relations section.

The Company uses, and intends to continue to use, the Investor Relations page of its website, which can be found at www.medicalpropertiestrust.com, as a means of disclosing material nonpublic information and of complying with its disclosure obligations under Regulation FD, including, without limitation, through the posting of investor presentations that may include material nonpublic information. Accordingly, investors should monitor the Investor Relations page, in addition to following our press releases, SEC filings, public conference calls, presentations and webcasts. The information contained on, or that may be accessed through, our website is not incorporated by reference into, and is not a part of, this document.

About Medical Properties Trust, Inc.

Medical Properties Trust, Inc. is a self-advised real estate investment trust formed in 2003 to acquire and develop net-leased hospital facilities. From its inception in Birmingham, Alabama, the Company has grown to


3


become one of the world’s largest owners of hospital real estate with 436 facilities and approximately 43,000 licensed beds in nine countries and across three continents as of March 31, 2024. MPT’s financing model facilitates acquisitions and recapitalizations and allows operators of hospitals to unlock the value of their real estate assets to fund facility improvements, technology upgrades and other investments in operations. For more information, please visit the Company’s website at www.medicalpropertiestrust.com.

Forward-Looking Statements

This press release includes forward-looking statements within the meaning of Section 27A of the Securities Act of 1933, as amended, and Section 21E of the Securities Exchange Act of 1934, as amended. Forward-looking statements can generally be identified by the use of forward-looking words such as “may”, “will”, “would”, “could”, “expect”, “intend”, “plan”, “estimate”, “target”, “anticipate”, “believe”, “objectives”, “outlook”, “guidance” or other similar words, and include statements regarding our strategies, objectives, future expansion and development activities, asset sales and other liquidity transactions, expected returns on investments and expected financial performance. Forward-looking statements involve known and unknown risks and uncertainties that may cause our actual results or future events to differ materially from those expressed in or underlying such forward-looking statements, including, but not limited to: (i) the risk that Steward’s bankruptcy restructuring does not result in MPT recovering deferred rent or its other investments in Steward at full value, within a reasonable time period or at all; (ii) macroeconomic conditions, including due to geopolitical conditions and instability, which may lead to a disruption of or lack of access to the capital markets, disruptions and instability in the banking and financial services industries, rising inflation and movements in currency exchange rates; (iii) the risk that previously announced or contemplated property sales, loan repayments, and other capital recycling transactions do not occur as anticipated or at all; (iv) the risk that MPT is not able to attain its leverage, liquidity and cost of capital objectives within a reasonable time period or at all; (v) MPT’s ability to obtain debt financing on attractive terms or at all, as a result of changes in interest rates and other factors, which may adversely impact its ability to pay down, refinance, restructure or extend its indebtedness as it becomes due, or pursue acquisition and development opportunities; (vi) the ability of our tenants, operators and borrowers to satisfy their obligations under their respective contractual arrangements with us; (vii) the economic, political and social impact of, and uncertainty relating to, the potential impact from health crises (like COVID-19), which may adversely affect MPT’s and its tenants’ business, financial condition, results of operations and liquidity; (viii) our success in implementing our business strategy and our ability to identify, underwrite, finance, consummate and integrate acquisitions and investments; (ix) the nature and extent of our current and future competition; (x) international, national and local economic, real estate and other market conditions, which may negatively impact, among other things, the financial condition of our tenants, lenders and institutions that hold our cash balances, and may expose us to increased risks of default by these parties; (xi) factors affecting the real estate industry generally or the healthcare real estate industry in particular; (xii) our ability to maintain our status as a REIT for income tax purposes in the U.S. and U.K.; (xiii) federal and state healthcare and other regulatory requirements, as well as those in the foreign jurisdictions where we own properties; (xiv) the value of our real estate assets, which may limit our ability to dispose of assets at attractive prices or obtain or maintain equity or debt financing secured by our properties or on an unsecured basis; (xv) the ability of our tenants and operators to operate profitably and generate positive cash flow, remain solvent, comply with applicable laws, rules and regulations in the operation of our properties, to deliver high-quality services, to attract and retain qualified personnel and to attract patients; (xvi) potential environmental contingencies and other liabilities; (xvii) the risk that the expected sale of three Connecticut hospitals currently leased to Prospect does not occur at the agreed upon terms or at all; (xviii) the risk that MPT is unable to monetize its investment in Prospect at full value within a reasonable time period or at all; (xix) the cooperation of our joint venture partners, including adverse developments affecting the financial health of such joint venture partners or the joint venture itself; and (xx) the risks and uncertainties of litigation or other regulatory proceedings.


4


The risks described above are not exhaustive and additional factors could adversely affect our business and financial performance, including the risk factors discussed under the section captioned “Risk Factors” in our most recent Annual Report on Form 10-K, as may be updated in our other filings with the SEC. Forward-looking statements are inherently uncertain and actual performance or outcomes may vary materially from any forward-looking statements and the assumptions on which those statements are based. Readers are cautioned to not place undue reliance on forward-looking statements as predictions of future events. We disclaim any responsibility to update such forward-looking statements, which speak only as of the date on which they were made.

# # #


5


MEDICAL PROPERTIES TRUST, INC. AND SUBSIDIARIES

Consolidated Balance Sheets


(Amounts in thousands, except for per share data)             
     March 31, 2024     December 31, 2023  
     (Unaudited)     (A)  

Assets


Real estate assets


Land, buildings and improvements, intangible lease assets, and other

   $ 12,823,748     $ 13,237,187  

Investment in financing leases

     1,233,178       1,231,630  

Real estate held for sale

     295,130       —   

Mortgage loans

     309,926       309,315  


Gross investment in real estate assets

     14,661,982       14,778,132  

Accumulated depreciation and amortization

     (1,422,728     (1,407,971


Net investment in real estate assets

     13,239,254       13,370,161  

Cash and cash equivalents

     224,340       250,016  

Interest and rent receivables

     34,492       45,059  

Straight-line rent receivables

     677,570       635,987  

Investments in unconsolidated real estate joint ventures

     1,450,482       1,474,455  

Investments in unconsolidated operating entities

     934,138       1,778,640  

Other loans

     426,971       292,615  

Other assets

     453,709       457,911  


Total Assets

   $ 17,440,956     $ 18,304,844  


Liabilities and Equity


Liabilities


Debt, net

   $ 10,098,723     $ 10,064,236  

Accounts payable and accrued expenses

     302,526       412,178  

Deferred revenue

     32,076       37,962  

Obligations to tenants and other lease liabilities

     163,264       156,603  


Total Liabilities

     10,596,589       10,670,979  

Equity


Preferred stock, $0.001 par value. Authorized 10,000 shares; no shares outstanding

     —        —   

Common stock, $0.001 par value. Authorized 750,000 shares; issued and outstanding - 600,304 shares at March 31, 2024 and 598,991 shares at December 31, 2023

     600       599  

Additional paid-in capital

     8,567,199       8,560,309  

Retained deficit

     (1,706,862     (971,809

Accumulated other comprehensive (loss) income

     (18,838     42,501  


Total Medical Properties Trust, Inc. Stockholders’ Equity

     6,842,099       7,631,600  

Non-controlling interests

     2,268       2,265  


Total Equity

     6,844,367       7,633,865  


Total Liabilities and Equity

   $ 17,440,956     $ 18,304,844  


(A)

Financials have been derived from the prior year audited financial statements.


MEDICAL PROPERTIES TRUST, INC. AND SUBSIDIARIES

Consolidated Statements of Income

(Unaudited)


(Amounts in thousands, except for per share data)    For the Three Months Ended  
     March 31, 2024     March 31, 2023  

Revenues


Rent billed

   $ 199,299     $ 248,157  

Straight-line rent

     44,736       56,693  

Income from financing leases

     16,393       13,195  

Interest and other income

     10,888       32,166  


Total revenues

     271,316       350,211  

Expenses


Interest

     108,685       97,654  

Real estate depreciation and amortization

     75,586       83,860  

Property-related (A)

     4,818       7,110  

General and administrative

     33,348       41,724  


Total expenses

     222,437       230,348  

Other expense


(Loss) gain on sale of real estate

     (1,423     62  

Real estate and other impairment charges, net

     (693,088     (89,538

Earnings from equity interests

     10,549       11,352  

Other (including fair value adjustments on securities)

     (89,345     (5,166


Total other expense

     (773,307     (83,290


(Loss) income before income tax

     (724,428     36,573  

Income tax expense

     (10,949     (3,543


Net (loss) income

     (735,377     33,030  

Net income attributable to non-controlling interests

     (248     (236


Net (loss) income attributable to MPT common stockholders

   $ (735,625   $ 32,794  


Earnings per common share - basic and diluted:


Net (loss) income attributable to MPT common stockholders

   $ (1.23   $ 0.05  


Weighted average shares outstanding - basic

     600,304       598,302  

Weighted average shares outstanding - diluted

     600,304       598,310  

Dividends declared per common share (B)

   $ —      $ 0.29  


(A)

Includes $2.3 million and $4.2 million of ground lease and other expenses (such as property taxes and insurance) paid directly by us and reimbursed by our tenants for the three months ended March 31, 2024 and 2023, respectively.

(B)

Regular quarterly dividend was declared subsequent to March 31, 2024.


MEDICAL PROPERTIES TRUST, INC. AND SUBSIDIARIES

Reconciliation of Net (Loss) Income to Funds From Operations

(Unaudited)


(Amounts in thousands, except for per share data)    For the Three Months Ended  
     March 31, 2024     March 31, 2023  

FFO information:


Net (loss) income attributable to MPT common stockholders

   $ (735,625   $ 32,794  

Participating securities’ share in earnings

     —        (515


Net (loss) income, less participating securities’ share in earnings

   $ (735,625   $ 32,279  


Depreciation and amortization

     94,243       101,960  

Loss (gain) on sale of real estate

     1,423       (62

Real estate impairment charges

     —        52,104  


Funds from operations

   $ (639,959   $ 186,281  


Write-off of billed and unbilled rent and other

     1,817       2,192  

Other impairment charges, net

     693,088       37,434  

Litigation and other

     5,870       7,726  

Non-cash fair value adjustments

     81,276       (4,121

Tax rate changes and other

     (307     (7,305


Normalized funds from operations

   $ 141,785     $ 222,207  


Certain non-cash and related recovery information:


Share-based compensation

   $ 7,633     $ 11,829  

Debt costs amortization

   $ 4,839     $ 5,121  

Non-cash rent and interest revenue (A)

   $ —      $ (20,863

Cash recoveries of non-cash rent and interest revenue (B)

   $ 5,748     $ 31,356  

Straight-line rent revenue from operating and finance leases

   $ (47,246   $ (62,589

Per diluted share data:


Net (loss) income, less participating securities’ share in earnings

   $ (1.23   $ 0.05  


Depreciation and amortization

     0.16       0.17  

Loss (gain) on sale of real estate

     —        —   

Real estate impairment charges

     —        0.09  


Funds from operations

   $ (1.07   $ 0.31  


Write-off of billed and unbilled rent and other

     —        0.01  

Other impairment charges, net

     1.16       0.06  

Litigation and other

     0.01       0.01  

Non-cash fair value adjustments

     0.14       (0.01

Tax rate changes and other

     —        (0.01


Normalized funds from operations

   $ 0.24     $ 0.37  


Certain non-cash and related recovery information:


Share-based compensation

   $ 0.01     $ 0.02  

Debt costs amortization

   $ 0.01     $ 0.01  

Non-cash rent and interest revenue (A)

   $ —      $ (0.03

Cash recoveries of non-cash rent and interest revenue (B)

   $ 0.01     $ 0.05  

Straight-line rent revenue from operating and finance leases

   $ (0.08   $ (0.10

Notes:

Investors and analysts following the real estate industry utilize funds from operations (“FFO”) as a supplemental performance measure. FFO, reflecting the assumption that real estate asset values rise or fall with market conditions, principally adjusts for the effects of GAAP depreciation and amortization of real estate assets, which assumes that the value of real estate diminishes predictably over time. We compute FFO in accordance with the definition provided by the National Association of Real Estate Investment Trusts, or Nareit, which represents net income (loss) (computed in accordance with GAAP), excluding gains (losses) on sales of real estate and impairment charges on real estate assets, plus real estate depreciation and amortization, including amortization related to in-place lease intangibles, and after adjustments for unconsolidated partnerships and joint ventures.

In addition to presenting FFO in accordance with the Nareit definition, we disclose normalized FFO, which adjusts FFO for items that relate to unanticipated or non-core events or activities or accounting changes that, if not noted, would make comparison to prior period results and market expectations less meaningful to investors and analysts. We believe that the use of FFO, combined with the required GAAP presentations, improves the understanding of our operating results among investors and the use of normalized FFO makes comparisons of our operating results with prior periods and other companies more meaningful. While FFO and normalized FFO are relevant and widely used supplemental measures of operating and financial performance of REITs, they should not be viewed as a substitute measure of our operating performance since the measures do not reflect either depreciation and amortization costs or the level of capital expenditures and leasing costs (if any not paid by our tenants) to maintain the operating performance of our properties, which can be significant economic costs that could materially impact our results of operations. FFO and normalized FFO should not be considered an alternative to net income (loss) (computed in accordance with GAAP) as indicators of our results of operations or to cash flow from operating activities (computed in accordance with GAAP) as an indicator of our liquidity.

Certain line items above (such as depreciation and amortization) include our share of such income/expense from unconsolidated joint ventures. These amounts are included with all activity of our equity interests in the “Earnings from equity interests” line on the consolidated statements of income.


(A)

Includes revenue accrued during the period but not received in cash, such as deferred rent, payment-in-kind (“PIK”) interest or other accruals.

(B)

Includes cash received to satisfy previously accrued non-cash revenue, such as the cash receipt of previously deferred rent or PIK interest.

Exhibit 99.2

LOGO

Medical Properties Trust
QUARTERLY SUPPLEMENTAL
1Q 2024


LOGO

COMPANY OVERVIEW Company Information 3
FINANCIAL INFORMATION
6 Reconciliation of Funds from Operations 6 Debt Summary 7 Debt Maturities and Debt Metrics 8
PORTFOLIO INFORMATION Lease and Loan Maturity Schedule 9
9 Total Assets and Revenues    by Asset Type, Operator, State and Country 10 Rent Coverage 13 Summary of Investments and Development Projects 15
FINANCIAL STATEMENTS
Consolidated Statements of Income 16
16 Consolidated Balance Sheets 17
Investments in Unconsolidated Real Estate    Joint Ventures 18
Investments in Unconsolidated Operating Entities 19
Appendix—Non-GAAP Reconciliations 20
FORWARD-LOOKING STATEMENTS
This supplemental includes forward-looking statements within the meaning of Section 27A of the Securities Act of 1933, as amended, and Section 21E of the Securities Exchange Act of 1934, as amended. Forward-looking statements can generally be identified by the use of forward-looking words such as “may”, “will”, “would”, “could”, “expect”, “intend”, “plan”, “estimate”, “target”, “anticipate”, “believe”, “objectives”, “outlook”, “guidance” or other similar words, and include statements regarding our strategies, objectives, future expansion and development activities, asset sales and other liquidity transactions, expected returns on investments and expected financial performance. Forward-looking statements involve known and unknown risks and uncertainties that may cause our actual results or future events to differ materially from those expressed in or underlying such forward-looking statements, including, but not limited to: (i) the risk that Steward’s bankruptcy restructuring does not result in MPT recovering deferred rent or its other investments in Steward at full value, within a reasonable time period or at all; (ii) macroeconomic conditions, including due to geopolitical conditions and instability, which may lead to a disruption of or lack of access to the capital markets, disruptions and instability in the banking and financial services industries, rising inflation and movements in currency exchange rates; (iii) the risk that previously announced or contemplated property sales, loan repayments, and other capital recycling transactions do not occur as anticipated or at all; (iv) the risk that MPT is not able to attain its leverage, liquidity and cost of capital objectives within a reasonable time period or at all; (v) MPT’s ability to obtain debt financing on attractive terms or at all, as a result of changes in interest rates and other factors, which may adversely impact its ability to pay down, refinance, restructure or extend its indebtedness as it becomes due, or pursue acquisition and development opportunities; (vi) the ability of our tenants, operators and borrowers to satisfy their obligations under their respective contractual arrangements with us; (vii) the economic, political and social impact of, and uncertainty relating to, the potential impact from health crises (like COVID-19), which may adversely affect MPT’s and its tenants’ business, financial condition, results of operations and liquidity; (viii) our success in implementing our business strategy and our ability to identify, underwrite, finance, consummate and integrate acquisitions and investments; (ix) the nature and extent of our current and future competition; (x) international, national and local economic, real estate and other market conditions, which may negatively impact, among other things, the financial condition of our tenants, lenders and institutions that hold our cash balances, and may expose us to increased risks of default by these parties; (xi) factors affecting the real estate industry generally or the healthcare real estate industry in particular; (xii) our ability to maintain our status as a REIT for income tax purposes in the U.S. and U.K.; (xiii) federal and state healthcare and other regulatory requirements, as well as those in the foreign jurisdictions where we own properties; (xiv) the value of our real estate assets, which may limit our ability to dispose of assets at attractive prices or obtain or maintain equity or debt financing secured by our properties or on an unsecured basis; (xv) the ability of our tenants and operators to operate profitably and generate positive cash flow, remain solvent, comply with applicable laws, rules and regulations in the operation of our properties, to deliver high-quality services, to attract and retain qualified personnel and to attract patients;
(xvi) potential environmental contingencies and other liabilities; (xvii) the risk that the expected sale of three Connecticut hospitals currently leased to Prospect does not occur at the agreed upon terms or at all; (xviii) the risk that MPT is unable to monetize its investment in Prospect at full value within a reasonable time period or at all; (xix) the cooperation of our joint venture partners, including adverse developments affecting the financial health of such joint venture partners or the joint venture itself; and (xx) the risks and uncertainties of litigation or other regulatory proceedings. The risks described above are not exhaustive and additional factors could adversely affect our business and financial performance, including the risk factors discussed under the section captioned “Risk Factors” in our most recent Annual Report on Form 10-K, as may be updated in our other filings with the SEC. Forward-looking statements are inherently uncertain and actual performance or outcomes may vary materially from any forward-looking statements and the assumptions on which those statements are based. Readers are cautioned to not place undue reliance on forward-looking statements as predictions of future events. We disclaim any responsibility to update such forward-looking statements, which speak only as of the date on which they were made.
On the cover: CUF Viseu—Operated by José de Mello Saúde—Viseu, Portugal. Pictured above: IMED Colón—Valencia, Spain.
MEDICAL PROPERTIES TRUST | SUPPLEMENTAL INFORMATION | Q1 2024 2


LOGO

COMPANY OVERVIEW
M edical Properties Trust, Inc. is a self-advised real estate investment trust formed in 2003 to acquire and develop net-leased hospital facilities. From its inception in Birmingham, Alabama, the Company has grown to become one of the world’s largest owners of hospital real estate.
MPT’s financing model facilitates acquisitions and recapitalizations and allows operators of hospitals to unlock the value of their real estate assets to fund facility improvements, technology upgrades and other investments in operations.
436 53 ~43,000 31 9
properties operators beds U.S. states countries


LOGO

Edward K. Aldag, Jr. Chairman, President and Chief Executive Officer R. Steven Hamner Executive Vice President and Chief Financial Officer J. Kevin Hanna Senior Vice President, Controller and Chief Accounting Officer Rosa H. Hooper Senior Vice President of Operations & Secretary Larry H. PortalSenior Vice President, Senior Advisor to the CEO Charles R. Lambert Vice President, Treasurer and Managing Director of Capital Markets R. Lucas Savage Vice President, Head of Global Acquisitions
Edward K. Aldag, Jr. G. Steven Dawson R. Steven Hamner Caterina A. Mozingo Emily W. Murphy Elizabeth N. Pitman D. Paul Sparks, Jr. Michael G. Stewart C. Reynolds Thompson, III
Medical Properties Trust, Inc.
1000 Urban Center Drive, Suite 501 Birmingham, AL 35242
(205) 969-3755 (205) 969-3756 (fax)
www.medicalpropertiestrust.com
MEDICAL PROPERTIES TRUST | SUPPLEMENTAL INFORMATION | Q1 2024


LOGO

INVESTOR RELATIONS
Senior Managing Director of Corporate Communications (646) 884-9809 dbabin@medicalpropertiestrust.com
Managing Director of Investor Relations
(205) 397-8589 tberryman@medicalpropertiestrust.com
Equiniti Trust Company, LLC 6201 15th Avenue Brooklyn, NY 11219
https://equiniti.com/us
New York Stock Exchange (NYSE): MPW
Moody’s: Ba2
Standard & Poor’s: BB-
Clinique de Genolier -Switzerland—Operated by Swiss Medical Network.
MEDICAL PROPERTIES TRUST | SUPPLEMENTAL INFORMATION | Q1 2024 5


LOGO

FINANCIAL INFORMATION
RECONCILIATION OF NET (LOSS) INCOME TO FUNDS FROM OPERATIONS
(Unaudited)
(Amounts in thousands, except per share data)
March 31, 2024 March 31, 2023
FFO INFORMATION:
Net (loss) income attributable to MPT common stockholders $ (735,625) $ 32,794
Participating securities’ share in earnings    —    (515)
Net (loss) income, less participating securities’ share in earnings $ (735,625) $    32,279
Depreciation and amortization     94,243    101,960 Loss (gain) on sale of real estate    1,423    (62) Real estate impairment charges    —     52,104
Funds from operations $ (639,959) $ 186,281
Write-off of billed and unbilled rent and other    1,817    2,192 Other impairment charges, net    693,088     37,434 Litigation and other    5,870    7,726 Non-cash fair value adjustments     81,276    (4,121) Tax rate changes and other    (307)    (7,305)
Normalized funds from operations $ 141,785 $ 222,207
Certain non-cash and related recovery information:
Share-based compensation $     7,633 $    11,829 Debt costs amortization $     4,839 $     5,121 Non-cash rent and interest revenue (A) $    —$    (20,863) Cash recoveries of non-cash rent and interest revenue (B) $     5,748 $    31,356 Straight-line rent revenue from operating and finance leases $ (47,246) $ (62,589)
PER DILUTED SHARE DATA:
Net (loss) income, less participating securities’ share in earnings $ (1.23) $ 0.05
Depreciation and amortization    0.16    0.17 Loss (gain) on sale of real estate    —    -Real estate impairment charges    —    0.09
Funds from operations $     (1.07) $    0 .31
Write-off of billed and unbilled rent and other— 0.01 Other impairment charges, net 1.16 0.06 Litigation and other 0.01 0.01 Non-cash fair value adjustments    0.14    (0.01) Tax rate changes and other    —    (0.01)
Normalized funds from operations $    0 .24 $    0 .37
Certain non-cash and related recovery information:
Share-based compensation $    0 .01 $    0 .02 Debt costs amortization $    0 .01 $    0 .01 Non-cash rent and interest revenue (A) $    —$    (0.03) Cash recoveries of non-cash rent and interest revenue (B) $    0 .01 $    0 .05 Straight-line rent revenue from operating and finance leases $    (0.08) $    (0.10)
Notes:
Investors and analysts following the real estate industry utilize funds from operations (“FFO”) as a supplemental performance measure. FFO, reflecting the assumption that real estate asset values rise or fall with market conditions, principally adjusts for the effects of GAAP depreciation and amortization of real estate assets, which assumes that the value of real estate diminishes predictably over time. We compute FFO in accordance with the definition provided by the National Association of Real Estate Investment Trusts, or Nareit, which represents net income (loss) (computed in accordance with GAAP), excluding gains (losses) on sales of real estate and impairment charges on real estate assets, plus real estate depreciation and amortization, including amortization related to in-place lease intangibles, and after adjustments for unconsolidated partnerships and joint ventures.
In addition to presenting FFO in accordance with the Nareit definition, we disclose normalized FFO, which adjusts FFO for items that relate to unanticipated or non-core events or activities or accounting changes that, if not noted, would make comparison to prior period results and market expectations less meaningful to investors and analysts. We believe that the use of FFO, combined with the required GAAP presentations, improves the understanding of our operating results among investors and the use of normalized FFO makes comparisons of our operating results with prior periods and other companies more meaningful. While FFO and normalized FFO are relevant and widely used supplemental measures of operating and financial performance of REITs, they should not be viewed as a substitute measure of our operating performance since the measures do not reflect either depreciation and amortization costs or the level of capital expenditures and leasing costs (if any not paid by our tenants) to maintain the operating performance of our properties, which can be significant economic costs that could materially impact our results of operations. FFO and normalized FFO should not be considered an alternative to net income (loss) (computed in accordance with GAAP) as indicators of our results of operations or to cash flow from operating activities (computed in accordance with GAAP) as an indicator of our liquidity.
Certain line items above (such as depreciation and amortization) include our share of such income/expense from unconsolidated joint ventures. These amounts are included with all activity of our equity interests in the “Earnings from equity interests” line on the consolidated statements of income.
(A) Includes revenue accrued during the period but not received in cash, such as deferred rent, payment-in-kind (“PIK”) interest or other accruals.
(B) Includes cash received to satisfy previously accrued non-cash revenue, such as the cash receipt of previously deferred rent or PIK interest.
MEDICAL PROPERTIES TRUST | SUPPLEMENTAL INFORMATION | Q1 2024 6


LOGO

FINANCIAL INFORMATION
(As of March 31, 2024) ($ amounts in thousands)
DEBT SUMMARY
2026 Credit Facility Revolver(A)(B) Variable 5.330%—6.930% $    1,614,791 2027 Term Loan Variable 7.130%    200,000 2024 AUD Term Loan (A$470M)(A)(C) Fixed(D) 2.850%    306,487 2024 GBP Term Loan (Ł105M)(A) Fixed 5.250%    132,352
3.325% Notes Due 2025 (€500M)(A) Fixed 3.325%    539,500 2025 GBP Term Loan (Ł700M)(A) Fixed(E) 2.349%    883,610
0.993% Notes Due 2026 (€500M)(A) Fixed 0.993%    539,500
5.250% Notes Due 2026 Fixed 5.250%    500,000
2.500% Notes Due 2026 (Ł500M)(A) Fixed 2.500%    631,150
5.000% Notes Due 2027 Fixed 5.000%    1,400,000
3.692% Notes Due 2028 (Ł600M)(A) Fixed 3.692%    757,380
4.625% Notes Due 2029 Fixed 4.625%    900,000
3.375% Notes Due 2030 (Ł350M)(A) Fixed 3.375%    441,805
3.500% Notes Due 2031 Fixed 3.500%    1,300,000 $     10,146,575
Debt issuance costs and discount    (47,852)
Weighted average rate
Variable 18%
Fixed 82%
(A) Non-USD denominated debt converted to U.S. dollars at March 31, 2024.
(B) Amended Credit Facility agreement on April 12, 2024 which, among other things, reduced total revolving commitments to $1.4 billion. (C) This term loan was paid off on April 18, 2024.
(D) We entered into an interest rate swap transaction, effective July 3, 2019, to fix the benchmark variable interest rate of the loan. On March 10, 2023, the rate increased to 2.850%. (E) We entered into an interest rate swap transaction, effective March 6, 2020, to fix the benchmark variable interest rate of the loan. On March 10, 2023, the rate increased to 2.349%.
MEDICAL PROPERTIES TRUST | SUPPLEMENTAL INFORMATION | Q1 2024 7


LOGO

FINANCIAL INFORMATION
(As of March 31, 2024) ($ amounts in thousands)
DEBT MATURITIES
2024 $—$ 438,839 (A) $ 438,839 4.3% 2025 539,500 883,610 1,423,110 14.0% 2026 1,670,650 1,614,791 3,285,441 32.4% 2027 1,400,000 200,000 1,600,000 15.8% 2028 757,380—757,380 7.5% 2029 900,000—900,000 8.9% 2030 441,805—441,805 4.3% 2031 1,300,000—1,300,000 12.8%
DEBT BY LOCAL CURRENCY
United States $ 4,100,000 $ 1,195,000 $ 5,295,000 52.2% United Kingdom 1,830,335 1,308,816 3,139,151 30.9% Australia— 306,487 (A) 306,487 3.0% Europe 1,079,000 326,937 1,405,937 13.9%
DEBT METRICS
March 31, 2024
Adjusted Net Debt to Annualized EBITDAre Ratios:
Adjusted Net Debt $ 9,380,741 Adjusted Annualized EBITDAre 1,066,804
Adjusted Net Debt to Adjusted Annualized EBITDAre Ratio
Adjusted Net Debt $ 9,380,741 Transaction Adjusted Annualized EBITDAre 1,067,828
Adjusted Net Debt to Transaction Adjusted Annualized EBITDAre Ratio
Leverage Ratio:
Unsecured Debt $ 10,014,223 Secured Debt 132,352
Total Debt $ 10,146,575
Total Gross Assets(B) 18,863,684
Financial Leverage Interest Coverage Ratio:
Interest Expense $ 108,685 Capitalized Interest 1,968 Debt Costs Amortization (3,698) Total Interest $ 106,955 Adjusted EBITDAre $ 266,701
Adjusted Interest Coverage Ratio
(A) $306 million was paid off on April 18, 2024.
(B) Total Gross Assets equals total assets plus accumulated depreciation and amortization.
See appendix for reconciliation of Non-GAAP financial measures.
MEDICAL PROPERTIES TRUST | SUPPLEMENTAL INFORMATION | Q1 2024 8


LOGO

PORTFOLIO INFORMATION
LEASE AND LOAN MATURITY SCHEDULE (A)
($ amounts in thousands)
2024—$— 0.0% 2025 5 19,618 1.4% 2026 2 1,152 0.1% 2027 1 3,588 0.3% 2028 8 20,068 1.5% 2029 6 15,452 1.1% 2030 11 6,656 0.5% 2031 4 4,893 0.4% 2032 41 70,985 5.2% 2033 6 7,415 0.5% Thereafter 340 1,207,865 89.0%
Percentage of total base rent/interest
100%
89.0% 90% 80% 70% 60% 50% 40% 30% 20% 10% 5.2%
0.0% 1.4% 0.1% 0.3% 1.5% 1.1% 0.5% 0.4% 0.5% 0%
(A) Schedule includes leases and mortgage loans and related terms as of March 31, 2024.
(B) Lease/Loan expiration is based on the fixed term of the lease/loan and does not factor in potential renewal or other options provided for in our agreements.
(C) Reflects all properties, including those that are part of joint ventures, except vacant properties (approximately 0.2% of total assets), and facilities that are under development.
(D) Represents base rent/interest income contractually owed per the lease/loan agreements on an annualized basis as of period end (including foreign currency exchange rates) but does not include tenant recoveries, additional rents and other lease-related adjustments to revenue (i.e., straight-line rents and deferred revenues), or any reserves or write-offs.
MEDICAL PROPERTIES TRUST | SUPPLEMENTAL INFORMATION | Q1 2024 9


LOGO

PORTFOLIO INFORMATION
TOTAL ASSETS AND REVENUES BY ASSET TYPE
(March 31, 2024)
($ amounts in thousands)
General Acute Care Hospitals 190 $    11,115,957 63.8% $    178,710 65.9% Behavioral Health Facilities 70    2,432,850 14.0%     52,327 19.3% Inpatient Rehabilitation Facilities 114    1,436,694 8.2%     28,161 10.4% Long-Term Acute Care Hospitals 19    269,235 1.5%    6,384 2.3%
Freestanding ER/Urgent Care Facilities 43    228,587 1.3%    5,734 2.1% Other    —    1,957,633(B) 11.2%    —    -
Total
TOTAL ASSETS BY ASSET TYPE TOTAL REVENUES BY ASSET TYPE
2% 2% 1% 2% General Acute Care Hospitals
Behavioral Health Facilities
Inpatient Rehabilitation Facilities Long-Term Acute Care Hospitals Freestanding ER/Urgent Care Faciliti Other
DOMESTIC ASSETS BY ASSET TYPE DOMESTIC REVENUES BY ASSET TYPE
4% 4% 2%
2% General Acute Care Hospitals
Behavioral Health Facilities
Inpatient Rehabilitation Facilities
Long-Term Acute Care Hospitals Freestanding ER/Urgent Care Facilities
Other
Note: Investments in operating entities are allocated pro rata based on the gross book value of the real estate. Such pro rata allocations are subject to change from period to period.
(A) Reflects total assets on our consolidated balance sheets. (B) Includes our PHP Holdings investment of $639 million.
MEDICAL PROPERTIES TRUST | SUPPLEMENTAL INFORMATION | Q1 2024 10


LOGO

PORTFOLIO INFORMATION
TOTAL ASSETS—LARGEST INDIVIDUAL FACILITY
(March 31, 2024)
COMPREHENSIVE PROPERTY-LEVEL UNDERWRITING FRAMEWORK
MPT invests in real estate, not the consolidated financial performance of its tenants. Each facility is underwritten for characteristics that make the infrastructure attractive to any experienced, competent operator—not just the current tenant. If we have underwritten these correctly, then coupled
1.8% with our absolute net master lease structure, our real estate will be
Steward Health Care attractive to a replacement operator, should we find it necesssary to
Circle Health 1.1% transition. Such underwriting characteristics include:
Priory Group 0.7% Prospect Medical Holdings 1.1%
Lifepoint Behavioral Health 0.4% Physical Quality Competition 48 operators 2.0%
Demographics Financial and Market
TOTAL ASSETS AND REVENUES BY OPERATOR
(March 31, 2024)
($ amounts in thousands)
Steward Health Care 36
Florida market $    1,271,192 7.3% $    4,215 1.5% Texas/Arkansas/Louisiana market    785,037 4.5%    4,116 1.5% Massachusetts market    754,588 4.4%    496 0.2% Arizona market    282,690 1.6%    1,287 0.5% Ohio/Pennsylvania market    119,484 0.7%    519 0.2% Utah market    5,978 0.0%    —0.0% Total Steward Health Care $    3,218,969 18.5% $    10,633 3.9% Circle Health 36    2,088,232 12.0%    51,012 18.8% Priory Group 37    1,250,626 7.2%    25,882 9.5% Prospect Medical Holdings 13    1,093,094 6.3%    6,781 2.5% Lifepoint Behavioral Health(B) 19    813,498 4.7%    18,805 6.9% CommonSpirit Health 5    780,891 4.5%    29,353 10.8% Swiss Medical Network 19    680,403 3.9%    280 0.1% MEDIAN 81    654,458 3.8%    8,078 3.0% Ernest Health 29    619,301 3.6%    18,847 6.9% Lifepoint Health 8    492,584 2.8%    15,217 5.6% 43 operators 153    3,791,267 21.5%    86,428 32.0% Other    —    1,957,633 11.2%    —     —
Total
Note: Investments in operating entities are allocated pro rata based on the gross book value of the real estate. Such pro rata allocations are subject to change from period to period. (A) Reflects total assets on our consolidated balance sheets.
(B) Formerly Springstone.
MEDICAL PROPERTIES TRUST | SUPPLEMENTAL INFORMATION | Q1 2024 11


LOGO

PORTFOLIO INFORMATION
TOTAL ASSETS AND REVENUES BY U.S. STATE AND COUNTRY
(March 31, 2024)
($ amounts in thousands)
Texas 51 $    1,434,667 8.2% $     21,671 8.0% Florida 9    1,271,192 7.3%    4,216 1.6% California 19    1,248,995 7.2%    25,498 9.4% Utah 7     818,704 4.7%    30,437 11.2% Massachusetts 10     759,268 4.4%    387 0.1%
26 Other States 117    3,695,029 21.2%    81,247 29.9% Other    —    1,369,695 7.8%    —    -
United States 213 $    10,597,550 60.8% $    163,456 60.2%
United Kingdom 92 $    4,079,869 23.4% $     89,907 33.1% Germany 85     726,940 4.2%    10,136 3.7% Switzerland 19     680,403 3.9%    280 0.1% Spain 9     250,043 1.4%    2,642 1.0% Other Countries 18     518,213 2.9%    4,895 1.9% Other     —    587,938 3.4%    —    -
International 223 $    6,843,406 39.2% $    107,860 39.8% Total
Note: Investments in operating entities are allocated pro rata based on the gross book value of the real estate. Such pro rata allocations are subject to change from period to period. (A) Reflects total assets on our consolidated balance sheets.
TOTAL ASSETS BY COUNTRY TOTAL REVENUES BY COUNTRY
3% 3% 1%2% 1%
United States
United Kingdom Germany
Switzerland Spain Other Countries Other
ASSETS BY U.S. STATE REVENUES BY U.S. STATE
Texas
Florida
California
Utah 30% 9% 21% 7% Massachusetts
26 Other States
5% 11%
5% Other
MEDICAL PROPERTIES TRUST | SUPPLEMENTAL INFORMATION | Q1 2024 12


LOGO

PORTFOLIO INFORMATION
TOTAL PORTFOLIO TTM EBITDARM(A)(B) RENT COVERAGE
YOY AND SEQUENTIAL QUARTER COMPARISONS BY PROPERTY TYPE
EBITDARM Rent Coverage
3.00x
2.5x
2.50x 2.4x
2.3x
2.1x 2.1x
2.1x
2.00x 2.0x 1.9x
1.9x
1.8x
1.8x 1.8x
1.7x
1.50x
1.2x
1.00x 0.9x
0.50x
0.00x
General Acute Care Hospitals Inpatient Rehabilitation Behavioral Health Long-Term Acute Care Total Portfolio Facilities Facilities Hospitals Q4 2022 TTM Q3 2023 TTM Q4 2023 TTM
% of Total Assets(C)
63.8% 8.2% 14.0% 1.5%
Notes: All data presented is on a trailing twelve month basis. For properties acquired in the preceding twelve months, data is for the period between MPT acquisition and December 31, 2023.
(A) EBITDARM is facility-level earnings before interest, taxes, depreciation, amortization, rent and management fees. EBITDARM includes normal GAAP expensed maintenance and repair costs. EBITDARM does not give effect for capitalized expenditures that extend the life or improve the facility and equipment in a way to drive more future revenues. The majority of these types of capital expenditures are financed and do not have an immediate cash impact. MPT’s rent is not subordinate to capitalized expenses. In addition, EBITDARM does not represent property net income or cash flows from operations and should not be considered an alternative to those indicators. EBITDARM figures utilized in calculating coverages presented are based on financial information provided by MPT’s tenants. MPT has not independently verified this information, but has no reason to believe this information is inaccurate in any material respect. TTM Coverages are calculated based on actual, unadjusted EBITDARM results as presented in tenant financial reporting and cash rent paid to MPT, except as noted below.
- All CARES Act Grants received by tenants have been removed from the tenant’s reported financial results in the above time periods.
- EBITDARM figures for California hospitals include amounts expected to be received under the Hospital Quality Assurance Fee (“HQAF”) Program 8. The HQAF amounts are based on the current payment model from the California Hospital Association which was approved by CMS on December 19, 2023.
(B) General Acute Care coverages and Total Portfolio coverages do not include Pipeline Health facilities as Pipeline Health filed Chapter 11 bankruptcy in October 2022 and emerged in February 2023, one Prime Healthcare facility due to sale, Prospect Medical Holdings Connecticut facilities due to pending sale, $150M mortgage investment in Prospect Medical Holdings Pennsylvania facilities, and Steward Health Care due to restructuring.
(C) Reflects percentage of total assets on March 31, 2024 balance sheet. Percentages by property type exclude equity investments, non-real estate loans, freestanding ER/urgent care facilities, and facilities under development.
MEDICAL PROPERTIES TRUST | SUPPLEMENTAL INFORMATION | Q1 2024 13


LOGO

PORTFOLIO INFORMATION
TOTAL PORTFOLIO TTM EBITDARM RENT COVERAGE
EBITDARM RENT COVERAGE: OPERATORS WITH PROPERTY-LEVEL REPORTING
Steward Health Care(B) $    2,279,992 General Acute N/A Priory Group    1,210,231 Behavioral 2.2x MEDIAN     654,458 IRF 1.6x Ernest Health     619,301 IRF/LTACH 2.1x Prospect Medical Holdings(C)     510,919 General Acute 1.0x Prime Healthcare     274,855 General Acute 2.0x Aspris Children’s Services     240,846 Behavioral 2.1x Vibra Healthcare     217,523 IRF/LTACH 1.0x Surgery Partners     188,861 General Acute 7.3x Cordiant Healthcare Services     125,245 General Acute 1.3x Ardent Health Services    84,921 General Acute 7.9x Other Reporting Tenants     528,107 Various 2.9x
International Operator 1 $    2,037,599 General Acute 2.4x Domestic Operator 1     492,584 General Acute 0.6x Domestic Operator 2     376,885 General Acute/LTACH 1.7x Domestic Operator 3     778,102 Behavioral 1.5x
PROPERTY-LEVEL REPORTING NOT REQUIRED AND/OR NOT AVAILABLE
One of the largest nonprofit health care operators in the U.S.;
CommonSpirit Health $    780,891 General Acute
Investment grade-rated
Swiss Medical Network     441,636 General Acute Second largest group of private hospitals in Switzerland One of largest health care operators in the world; Parent
Ramsay Health Care UK     397,322 General Acute guaranty; Investment grade-rated
Pihlajalinna     211,953 General Acute One of Finland’s leading providers of social and health services
Saint Luke’s—Kansas City     126,073 General Acute Investment grade-rated
NHS    86,867 General Acute Single-payor government entity in UK
Dignity Health    43,155 General Acute Part of CommonSpirit; Parent guaranty; Investment grade-rated One of the largest private hospital systems in Portugal with 24
CUF    29,048 General Acute facilities and 75+ year operating history
NeuroPsychiatric Hospitals    26,685 Behavioral Parent guaranty
Community Health Systems    25,925 General Acute U.S. hospital operator with substantial operating history
Other Tenants    11,096 General Acute N/A
Above data represents approximately 85% of MPT Total Real Estate Investment
Notes: All data presented is on a trailing twelve month basis. For properties acquired in the preceding twelve months, data is for the period between MPT acquisition and December 31, 2023. (A) Investment figures exclude equity investments, non-real estate loans, freestanding ER/urgent care facilities, and facilities under development.
(B) Coverage not available due to restructuring.
(C) Prospect Medical Holdings coverage includes California facilities only.
MEDICAL PROPERTIES TRUST | SUPPLEMENTAL INFORMATION | Q1 2024 14


LOGO

PORTFOLIO INFORMATION
SUMMARY OF INVESTMENTS
(For the three months ended March 31, 2024)
(Amounts in thousands)
Capital Additions, Development and
(B) Various    82,495 Various Other Funding for Existing Tenants
SUMMARY OF CURRENT DEVELOPMENT PROJECTS AS OF MARCH 31, 2024
(Amounts in thousands)
IMED Hospitales Spain $    37,790 $    21,586 Q4 2024 IMED Hospitales Spain    51,802    19,299 Q1 2025
(A) Excludes transaction costs, such as real estate transfer and other taxes. Amount assumes exchange rate as of the investment date.
(B) Reflects normal capital additions that extend the life or improve existing facilities on which we receive a return equal to the lease rate for the respective facility. This includes over 10 facilities and six different operators.
Note: We completed construction and commenced rent on two properties in the 2024 first quarter. Due to Steward restructuring, the Texas development is omitted from this schedule.
MEDICAL PROPERTIES TRUST | SUPPLEMENTAL INFORMATION | Q1 2024 15


LOGO

FINANCIAL STATEMENTS
CONSOLIDATED STATEMENTS OF INCOME
(Unaudited)
(Amounts in thousands, except per share data)
March 31, 2024 March 31, 2023 REVENUES
Rent billed $    199,299 $    248,157 Straight-line rent     44,736    56,693 Income from financing leases     16,393    13,195 Interest and other income     10,888    32,166 Total revenues    271,316     350,211
EXPENSES
Interest    108,685    97,654 Real estate depreciation and amortization     75,586     83,860 Property-related(A)    4,818    7,110 General and administrative    33,348     41,724 Total expenses    222,437    230,348
OTHER EXPENSE
(Loss) gain on sale of real estate    (1,423)    62 Real estate and other impairment charges, net    (693,088)    (89,538) Earnings from equity interests     10,549     11,352 Other (including fair value adjustments on securities)    (89,345)    (5,166) Total other expense    (773,307)    (83,290)
(Loss) income before income tax    (724,428)     36,573 Income tax expense    (10,949)    (3,543)
Net (loss) income    (735,377)     33,030
Net income attributable to non-controlling interests    (248)    (236)
Net (loss) income attributable to MPT common stockholders $    (735,625) $    32,794
EARNINGS PER COMMON SHARE—BASIC AND DILUTED
Net (loss) income attributable to MPT common stockholders $     (1.23) $    0 .05
WEIGHTED AVERAGE SHARES OUTSTANDING—BASIC    600,304    598,302 WEIGHTED AVERAGE SHARES OUTSTANDING—DILUTED    600,304    598,310 DIVIDENDS DECLARED PER COMMON SHARE (B) $    —$    0 .29
(A) Includes $2.3 million and $4.2 million of ground lease and other expenses (such as property taxes and insurance) paid directly by us and reimbursed by our tenants for the three months ended March 31, 2024 and 2023, respectively.
(B) Regular quarterly dividend was declared subsequent to March 31, 2024.
MEDICAL PROPERTIES TRUST | SUPPLEMENTAL INFORMATION | Q1 2024 16


LOGO

FINANCIAL STATEMENTS
CONSOLIDATED BALANCE SHEETS
(Amounts in thousands, except per share data)
(Unaudited) (A) ASSETS
Real estate assets
Land, buildings and improvements, intangible lease assets, and other $ 12,823,748 $ 13,237,187 Investment in financing leases 1,233,178 1,231,630 Real estate held for sale 295,130 -Mortgage loans 309,926 309,315
Gross investment in real estate assets 14,661,982 14,778,132
Accumulated depreciation and amortization (1,422,728) (1,407,971)
Net investment in real estate assets 13,239,254 13,370,161
Cash and cash equivalents 224,340 250,016 Interest and rent receivables 34,492 45,059 Straight-line rent receivables 677,570 635,987 Investments in unconsolidated real estate joint ventures 1,450,482 1,474,455 Investments in unconsolidated operating entities 934,138 1,778,640 Other loans 426,971 292,615 Other assets 453,709 457,911
Total Assets
LIABILITIES AND EQUITY Liabilities
Debt, net $ 10,098,723 $ 10,064,236 Accounts payable and accrued expenses 302,526 412,178 Deferred revenue 32,076 37,962 Obligations to tenants and other lease liabilities 163,264 156,603
Total Liabilities     10,596,589    10,670,979
Equity
Preferred stock, $0.001 par value. Authorized 10,000 shares; no shares outstanding - -Common stock, $0.001 par value. Authorized 750,000 shares; issued and outstanding —600,304 shares at March 31, 2024 and 598,991 shares at December 31, 2023 600 599 Additional paid-in capital 8,567,199 8,560,309 Retained deficit (1,706,862) (971,809) Accumulated other comprehensive (loss) income (18,838) 42,501 Total Medical Properties Trust, Inc. Stockholders’ Equity 6,842,099 7,631,600 Non-controlling interests 2,268 2,265
Total Equity 6,844,367 7,633,865
Total Liabilities and Equity
(A) Financials have been derived from the prior year audited financial statements.
MEDICAL PROPERTIES TRUST | SUPPLEMENTAL INFORMATION | Q1 2024 17


LOGO

FINANCIAL STATEMENTS
INVESTMENTS IN UNCONSOLIDATED 
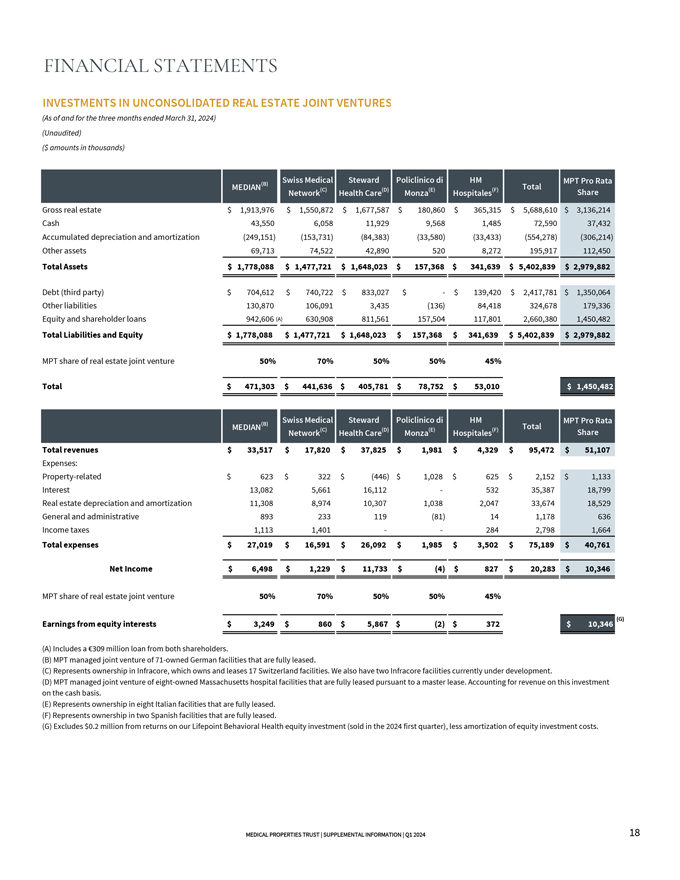
REAL ESTATE JOINT VENTURES
(As of and for the three months ended March 31, 2024) (Unaudited) ($ amounts in thousands)
Gross real estate $ 1,913,976 $ 1,550,872 $ 1,677,587 $    180,860 $    365,315 $ 5,688,610 $ 3,136,214 Cash    43,550    6,058     11,929    9,568    1,485     72,590    37,432 Accumulated depreciation and amortization    (249,151)    (153,731)    (84,383)    (33,580)    (33,433)    (554,278)    (306,214) Other assets    69,713     74,522     42,890    520    8,272    195,917    112,450
Total Assets $ 1,778,088 $ 1,477,721 $ 1,648,023 $    157,368 $    341,639 $ 5,402,839 $ 2,979,882
Debt (third party) $    704,612 $    740,722 $    833,027 $    — $    139,420 $ 2,417,781 $ 1,350,064 Other liabilities    130,870    106,091    3,435    (136)    84,418    324,678    179,336 Equity and shareholder loans    942,606 (A)    630,908    811,561    157,504    117,801    2,660,380    1,450,482
Total Liabilities and Equity $ 1,778,088 $ 1,477,721 $ 1,648,023 $    157,368 $    341,639 $ 5,402,839 $ 2,979,882
MPT share of real estate joint venture 50% 70% 50% 50% 45%
Total $    471,303 $    441,636 $    405,781 $    78,752 $    53,010
Total revenues $    33,517 $    17,820 $    37,825 $    1,981 $    4,329 $    95,472 $    51,107
Expenses:
Property-related $     623 $     322 $     (446) $    1,028 $     625 $    2,152 $    1,133 Interest    13,082     5,661    16,112    —    532    35,387    18,799 Real estate depreciation and amortization    11,308     8,974    10,307     1,038     2,047    33,674    18,529 General and administrative    893    233    119    (81)    14     1,178    636 Income taxes     1,113     1,401    —    —    284     2,798     1,664
Total expenses $    27,019 $    16,591 $    26,092 $    1,985 $    3,502 $    75,189 $    40,761
Net Income $    6,498 $    1,229 $    11,733 $    (4) $     827 $    20,283 $    10,346
MPT share of real estate joint venture 50% 70% 50% 50% 45%
(G)
Earnings from equity interests $    3,249 $     860 $    5,867 $    (2) $     372
(A) Includes a €309 million loan from both shareholders.
(B) MPT managed joint venture of 71-owned German facilities that are fully leased.
(C) Represents ownership in Infracore, which owns and leases 17 Switzerland facilities. We also have two Infracore facilities currently under development.
(D) MPT managed joint venture of eight-owned Massachusetts hospital facilities that are fully leased pursuant to a master lease. Accounting for revenue on this investment on the cash basis.
(E) Represents ownership in eight Italian facilities that are fully leased. (F) Represents ownership in two Spanish facilities that are fully leased.
(G) Excludes $0.2 million from returns on our Lifepoint Behavioral Health equity investment (sold in the 2024 first quarter), less amortization of equity investment costs.
MEDICAL PROPERTIES TRUST | SUPPLEMENTAL INFORMATION | Q1 2024 18


LOGO

FINANCIAL STATEMENTS
INVESTMENTS IN UNCONSOLIDATED OPERATING ENTITIES
(Amounts in thousands)
OPERATING ENTITY INVESTMENT FRAMEWORK
MPT’s hospital expertise and comprehensive underwriting process allows for opportunistic investments in hospital operations.
• Passive investments typically needed in order to acquire the larger real • Certain of these investments entitle us to customary minority rights and estate transactions. protections.
• Cash payments go to previous owner and not to the tenant, with limited • No additional operating loss exposure beyond our investment. exceptions.
• Proven track record of successful investments, including Ernest Health,
• Operators are vetted as part of our overall underwriting process.
Capella Healthcare and Springstone.
• Potential for outsized returns and organic growth.
Includes a 49% equity ownership interest in, along with a loan convertible into PHP Holdings, the PHP Holdings $    638,632 49.0% managed care business of Prospect. Both instruments are accounted for under the fair value option method.
Includes our passive equity ownership interest, along with a CHF 37 million loan as part of a syndicated Swiss Medical Network     173,647 8.9% loan facility.
Includes our passive equity ownership interest in Aevis, a public healthcare investment company. Our Aevis    65,120 4.6% original investment of CHF 47 million is marked-to-market quarterly.
In order to close the 2021 acquisition of 35 facilities, we made a passive equity investment and a loan to Priory Group    40,394 9.2% Priory (a subsidiary of MEDIAN) proceeds of which were paid to the former owner. The loan was sold in the first quarter of 2024.
Includes our passive equity ownership interest in Aspris, a spin-off of Priory’s education and children’s
Aspris    15,977 9.2% services line of business.
Includes our passive equity ownership interest in Caremax, a public care delivery system. Our original
Caremax    368 9.9% investment is marked-to-market quarterly.
Loan, for which proceeds were paid to Steward’s former private equity sponsor, is secured by the equity Steward Health Care    —(A) N/A of Steward and provides for an initial 4% return plus 37% of the increase in the value of Steward over seven years from January 2021.
Includes our 49% equity ownership interest and a loan made for the purpose of investing in select International Joint Venture    —(A) 49.0% international hospital operations. The loan carries a 7.5% interest rate and is secured by the remaining equity of the international joint venture and guaranteed by the other equity owner.
(A) Includes our passive equity ownership interest. Proceeds from our original investment of $150 million
Steward Health Care    —9.9% were paid directly to Steward’s former private equity sponsor and other shareholders.
Total
INVESTMENTS IN UNCONSOLIDATED OPERATING ENTITIES AS A PERCENTAGE OF TOTAL ASSETS
(A) As of March 31, 2024, these investments are fully reserved.
MEDICAL PROPERTIES TRUST | SUPPLEMENTAL INFORMATION | Q1 2024 19


LOGO

APPENDIX—NON-GAAP RECONCILIATIONS
ADJUSTED NET DEBT/ANNUALIZED EBITDAre
(Unaudited)
(Amounts in thousands)
March 31, 2024
ADJUSTED EBITDA re RECONCILIATION
Net loss $    (735,377)
Add back:
Interest 108,685 Income tax 10,949 Depreciation and amortization 77,214 Loss on sale of real estate 1,423 Adjustment to reflect MPT’s share of unlevered EBITDAre from unconsolidated real estate joint ventures(A) 14,123
1Q 2024 EBITDAre $    (522,983) Share-based compensation 7,633 Write-off of billed and unbilled rent and other 1,817 Other impairment charges, net 693,088 Litigation and other 5,870
Non-cash fair value adjustments 81,276
1Q 2024 Adjusted EBITDAre $    266,701 $    1,066,804 Adjustments for mid-quarter investment activity(B) 256
1Q 2024 Transaction Adjusted EBITDAre $    266,957 $    1,067,828
ADJUSTED NET DEBT RECONCILIATION
Total debt at March 31, 2024 $    10,098,723 Less: Cash at March 31, 2024 (224,340) Less: Cash funded for building improvements in progress and construction in progress at March 31, 2024(C) (493,642) Adjusted Net Debt $     9,380,741
Investors and analysts following the real estate industry utilize net debt (debt less cash) to EBITDAre as a measurement of leverage that shows how many years it would take for us to pay back our debt, assuming net debt and EBITDAre are held constant. In our calculation, we start with EBITDAre , as defined by Nareit, which is net income before interest expense, income tax expense, depreciation and amortization, losses/gains on disposition of depreciated property, impairment losses, and adjustments to reflect our share of EBITDAre from unconsolidated real estate joint ventures. We then adjust EBITDAre for non-cash share-based compensation, non-cash fair value adjustments and other items that would make comparison of our operating results with prior periods and other companies more meaningful, to derive Adjusted EBITDAre . We adjust net debt for cash funded for building improvements in progress and construction in progress for which we are not yet receiving rent to derive Adjusted Net Debt. We adjust Adjusted EBITDAre for the effects from investments and capital transactions that were completed during the period, assuming such transactions were consummated/fully funded as of the beginning of the period to derive Transaction Adjusted EBITDAre . Although non-GAAP measures, we believe Adjusted Net Debt, Adjusted EBITDAre , and Transaction Adjusted EBITDAre are useful to investors and analysts as they allow for a more current view of our credit quality and allow for the comparison of our credit strength between periods and to other real estate companies without the effect of items that by their nature are not comparable from period to period.
(A) Includes only the unlevered portion of our share of EBITDAre from unconsolidated real estate joint ventures, as we have excluded any net debt from our unconsolidated real estate joint ventures in the Adjusted Net Debt line. We believe this adjustment is needed to appropriately reflect the relationship between EBITDA re and net debt.
(B) Reflects a full quarter impact from our mid-quarter investments, disposals, and loan payoffs.
(C) Excluded development and capital improvement projects that are in process and not yet generating a cash return but will generate a return once completed.
MEDICAL PROPERTIES TRUST | SUPPLEMENTAL INFORMATION | Q1 2024 20


LOGO

Medical Properties Trust
1000 Urban Center Drive, Suite 501
Birmingham, AL 35242
(205) 969-3755 NYSE: MPW
www.medicalpropertiestrust.com
Contact:
Drew Babin, Senior Managing Director of Corporate Communications
(646) 884-9809 or dbabin@medicalpropertiestrust.com
or
Tim Berryman, Managing Director of Investor Relations
(205) 397-8589 or tberryman@medicalpropertiestrust.com

v3.24.1.u1
Document and Entity Information
May 09, 2024
Cover [Abstract]  
Entity Registrant Name MEDICAL PROPERTIES TRUST INC
Amendment Flag false
Entity Central Index Key 0001287865
Document Type 8-K
Document Period End Date May 09, 2024
Entity File Number 001-32559
Entity Incorporation State Country Code MD
Entity Tax Identification Number 20-0191742
Entity Address, Address Line One 1000 Urban Center Drive
Entity Address, Address Line Two Suite 501
Entity Address, City or Town Birmingham
Entity Address, State or Province AL
Entity Address, Postal Zip Code 35242
City Area Code (205)
Local Phone Number 969-3755
Written Communications false
Soliciting Material false
Pre Commencement Tender Offer false
Pre Commencement Issuer Tender Offer false
Security 12b Title Common Stock, par value $0.001 per share, of Medical Properties Trust, Inc.
Trading Symbol MPW
Security Exchange Name NYSE
Entity Emerging Growth Company false

Medical Properties (NYSE:MPW)
Historical Stock Chart
From Apr 2024 to May 2024 Click Here for more Medical Properties Charts.
Medical Properties (NYSE:MPW)
Historical Stock Chart
From May 2023 to May 2024 Click Here for more Medical Properties Charts.