EURUSD Price Analysis – March 5
In case the Bears are able to push the price below the support level of $1.11, then, support level of $1.10 and $1.09 may be tested. Should the just mentioned level is defend by the bulls, the price may continue its bullish trend towards $1.13, $1.14 and $1.16 levels.
EUR/USD Market
Key Levels:
Resistance levels: $1.13, $1.14, $1.16
Support levels: $1.11, $1.10, $1.09
EURUSD Long-term Trend: Bearish
On the long term outlook, EURUSD is bearish. The price action of EURUSD on the daily chart formed a double bottom chart pattern last week. The price reached the support level of $1.11 on November 24, it pulled back and test resistance level of $1.14. The price tested the support level of $1.11 second time on January 28. Today, the price is testing the support level of $1.11 as the third time. Price may bounce up at the just mentioned support level.
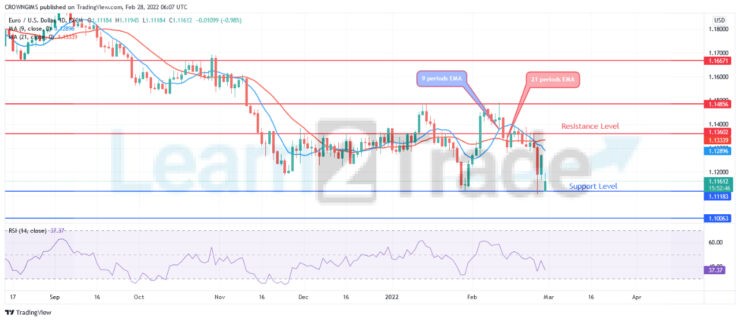
EURUSD has penetrated the two EMA downside, the price is trading below the 21 periods EMA and 9 periods EMA heading towards the previous low of $1.11. In case the Bears are able to push the price below the support level of $1.11, then, support level of $1.10 and $1.09 may be tested. Should the just mentioned level is defend by the bulls, the price may continue its bullish trend towards $1.13, $1.14 and $1.16 levels. However, the Relative Strength index period 14 is at 37 levels pointing down to indicate further price reduction.
EURUSD medium-term Trend: Bearish
EURUSD currency pair remains under the bearish control. The price increase to test the resistance level of $1.14 on February 04. The just mentioned level hold the price and it pulled back to retest the previous low at $1.11. A bullish pin bar formed and the price increased towards the dynamic resistance level. Today, the price experience a gap and it falls to test $1.11 support level third time.
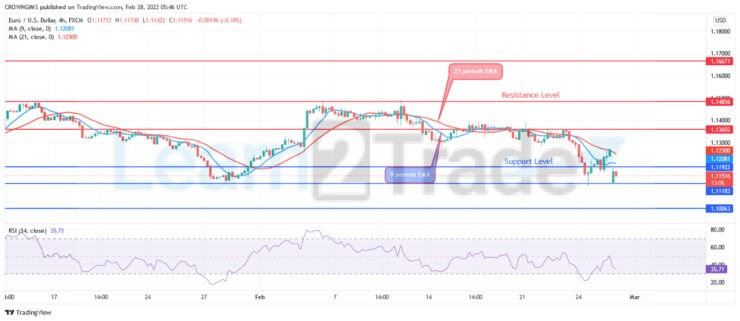
The Relative Strength Index period 14 is at 33 levels with the signal lines pointing up to indicate a buy signal.
Source: https://learn2.trade