CONSOLIDATED STATEMENT OF CASH FLOWS

 
                                                               2013          2012 
                                                    Notes      GBPm          GBPm 
 Operating activities Operating profit 
  Non-underlying items included in operating                    4.6           4.6 
   profit 
  Amortisation Depreciation                                     0.9           0.3 
  Defined benefit pension service costs                         1.4           1.4 
  Other non-cash items Pension payments                         1.8           2.1 
   Working capital movements: - increase 
   in inventories - increase in trade 
   and other receivables - increase in 
   trade and other payables - increase 
   in provisions 
                                                                  -           0.9 
                                                                0.2         (0.3) 
                                                              (1.5)         (1.6) 
 
                                                              (1.0)         (2.6) 
                                                              (3.4)         (0.7) 
                                                                2.4           3.5 
                                                                0.4           0.3 
                                                           --------      -------- 
 Cash generated from operations before                          5.8           7.9 
  reorganisation Reorganisation costs 
  paid                                                3       (0.7)         (0.5) 
                                                           --------      -------- 
 Cash generated from operations Taxation                        5.1           7.4 
  paid 
                                                              (1.0)         (0.8) 
                                                           --------      -------- 
 Net cash from operating activities                             4.1           6.6 
                                                           --------      -------- 
 Investing activities 
  Interest received                                             0.2           0.2 
  Proceeds from sale of property, plant                         0.2           0.1 
   and equipment Acquisition of property, 
   plant and equipment Acquisition of 
   investment property Capitalised development 
   expenditure 
                                                              (1.9)         (3.9) 
                                                              (0.7)             - 
                                                              (2.2)         (1.2) 
                                                           --------      -------- 
 Net cash from investing activities                           (4.4)         (4.8) 
                                                           --------      -------- 
 Financing activities Interest paid 
  Purchase of own shares Net increase 
  against revolving facilities Dividends 
  paid 
                                                              (0.3)         (0.2) 
                                                              (0.2)             - 
                                                                4.2           0.7 
                                                              (1.1)         (1.0) 
                                                           --------      -------- 
 Net cash from financing activities                             2.6         (0.5) 
                                                           --------      -------- 
 
  Net increase in cash and cash equivalents          7          2.3           1.3 
   Cash and cash equivalents at 1 January                      13.3          12.3 
   Effect of exchange rate fluctuations                       (0.6)         (0.3) 
    on cash held 
                                                           --------      -------- 
 Cash and cash equivalents at 31 December                      15.0          13.3 
                                                           ========      ======== 
 

NOTES TO PRELIMINARY ANNOUNCEMENT

1. The Group's accounts have been prepared in accordance with International Accounting Standards and International Financial Reporting Standards that were effective at 31 December 2013 and adopted by the EU.

The financial information set out above does not constitute the Company's statutory accounts for the years ended 31 December 2013 or 2012. Statutory accounts for 2012 have been delivered to the Registrar of Companies. The auditors have reported on the 2013 and 2012 statutory accounts; their reports were (i) unqualified, (ii) did not include references to any matters to which the auditors drew attention by way of emphasis without qualifying their reports and (iii) did not contain statements under section 498 (2) or (3) of the Companies Act 2006.

   2.             Operating segments 

Segment information

 
                               Scientific                  Packaging Machinery                 Tobacco Machinery                          Total 
                                 Services 
                        ------------------------      ----------------------------      ------------------------------       ------------------------------ 
 
                               2013         2012              2013            2012                2013            2012            2013                 2012 
                                                                                                                                                 (restated) 
                               GBPm         GBPm              GBPm            GBPm                GBPm            GBPm            GBPm                 GBPm 
 
   Revenue                 26.5             23.1          44.3            38.8            34.4                31.1               105.2           93.0 
                        =======      ===========      ========      ==========      ==========          ==========      ==============      ========= 
 
 
   Underlying segment 
   operating profit 
                            1.1              1.2           1.5             1.5                 2.9             2.2             5.5                4.9 
   Segment 
   non-underlying 
   items                  (0.1)            (0.9)             -           (0.1)                   -               -           (0.1)              (1.0) 
                        -------      -----------      --------      ----------      --------------      ----------      ----------      ------------- 
 Segment operating 
  profit                    1.0              0.3           1.5             1.4                 2.9             2.2             5.4                3.9 
                        =======      ===========      ========      ==========      ==============      ========== 
 Unallocated 
  non-underlying 
  items - defined 
  benefit pension 
  (costs)/credits                                                                                                            (0.8)                0.7 
                                                                                                                        ----------      ------------- 
 Operating profit                                                                                                              4.6                4.6 
 
  Net financing                                                                                                              (0.8)              (0.1) 
  expense 
                                                                                                                        ----------      ------------- 
 Profit before                                                                                                                 3.8                4.5 
  tax 
                                                                                                                             (0.3)              (0.7) 
  Taxation 
                                                                                                                        ----------      ------------- 
 Profit for the 
  period                                                                                                                       3.5                3.8 
 
 Segment assets            14.0             13.6          25.1            19.1                23.8            26.5            62.9               59.2 
  Segment liabilities     (5.9)            (5.4)        (12.9)          (12.1)              (10.1)          (12.4)          (28.9)             (29.9) 
                        -------      -----------      --------      ----------      --------------      ----------      ----------      ------------- 
 Segment net 
  assets 
  - continuing 
  operations                8.1              8.2          12.2             7.0                13.7            14.1            34.0               29.3 
                        =======      ===========      ========      ==========      ==============      ========== 
 
   Net liabilities                                                                                                           (0.1)              (0.1) 
   - discontinued 
   operations 
                                                                                                                               6.6                1.3 
   Unallocated 
   net assets 
                                                                                                                        ----------      ------------- 
 Total net assets                                                                                                             40.5               30.5 
                                                                                                                        ==========      ============= 
 
 
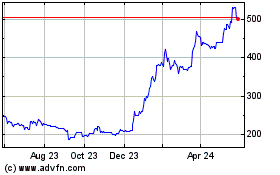
Mpac (LSE:MPAC)
Historical Stock Chart
From Jun 2024 to Jul 2024 Click Here for more Mpac Charts.
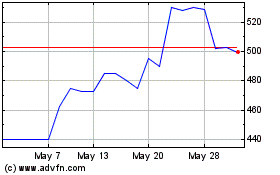
Mpac (LSE:MPAC)
Historical Stock Chart
From Jul 2023 to Jul 2024 Click Here for more Mpac Charts.