Walmart Up Over 5% After 3Q Earnings Report and Fiscal Year Sales Guidance Raise -- Data Talk
August 15 2019 - 4:05PM
Dow Jones News
Walmart Inc. (WMT) is currently at $112.14, up $5.94 or
5.59%
-- Would be highest close since July 29, 2019, when it closed at
$112.27
-- On pace for largest percent increase since Aug. 16, 2018,
when it rose 9.33%
-- Earlier Thursday, Walmart reported that second-quarter sales
at U.S. stores and websites operating at least 12 months grew 2.8%,
due to strong grocery sales, online and off, and slightly more
shoppers visiting stores and websites. U.S. e-commerce sales rose
37%
-- The company now expects U.S. comparable sales to rise at the
upper end of a 2.5% to 3% range for the full year, an improvement
from an earlier prediction of sales falling somewhere in that
range
-- Currently up two of the past three days
-- Up 1.59% month-to-date
-- Up 20.39% year-to-date
-- Down 2.47% from its all-time closing high of $114.98 on July
15, 2019
-- Up 13.69% from 52 weeks ago (Aug. 16, 2018), when it closed
at $98.64
-- Down 2.47% from its 52-week closing high of $114.98 on July
15, 2019
-- Up 30.67% from its 52-week closing low of $85.82 on Dec. 24,
2018
-- Traded as high as $113.64; highest intraday level since July
22, 2019, when it hit $114.34
-- Up 7.01% at today's intraday high; largest intraday percent
increase since Aug. 16, 2018, when it rose as much as 11.07%
-- Best performer in the DJIA today
-- Second-best performer in the S&P 500 today
-- Contributed 40.28 points to the DJIA so far today
All data as of 3:26:35 PM
Source: Dow Jones Market Data, FactSet
(END) Dow Jones Newswires
August 15, 2019 15:50 ET (19:50 GMT)
Copyright (c) 2019 Dow Jones & Company, Inc.
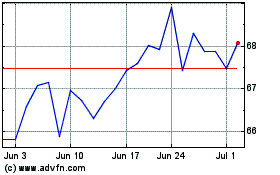
Walmart (NYSE:WMT)
Historical Stock Chart
From Aug 2024 to Sep 2024

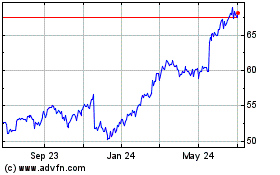
Walmart (NYSE:WMT)
Historical Stock Chart
From Sep 2023 to Sep 2024
