Earnings Scorecard: Simon Property - Analyst Blog
May 12 2011 - 10:00AM
Zacks
Simon Property Group
Inc. (SPG), a leading real estate investment trust (REIT),
reported fiscal 2011 first quarter funds from operations (FFO) of
$1.61 per share, which beat the Zacks Consensus Estimate by 7
cents. Fund from operations, a widely used metric to gauge the
performance of REIT, is obtained after adding depreciation and
amortization and other non-cash expenses to net income.
We cover below the results of the
recent earnings announcement, as well as the subsequent analyst
estimate revisions and the Zacks ratings for the short-term and
long-term outlook for the stock.
Earnings Report
Review
Total revenues during the reported
quarter increased to $1.0 billion from $925.1 million in the
year-ago period. Total revenues during the reported quarter were
well ahead of the Zacks Consensus Estimate of $964 million.
Occupancy in the regional malls and
premium outlet centers combined portfolio was 92.9% at quarter-end,
compared to 92.2% in the year-ago period. Comparable sales in the
combined portfolio increased to $500 per square foot, compared to
$462 in the prior-year quarter. Average rent per square foot in the
combined portfolio increased during first quarter 2011 to $39.26
from $38.72 in the year-ago period.
(Read our full coverage on this
earnings report: Simon Property Beats Estimates)
Earnings Estimate Revisions-
Overview
Fiscal earnings estimates have moved
up for Simon Property since the earnings release, meaning that
analysts are bullish about the long-term performance of the
company. Let’s dig into the earnings estimate details.
Agreement of Estimate
Revisions
In the last 30 days, fiscal 2011
earnings estimates were raised by 13 analysts out of 21 covering
the stock, while none had lowered the same. For fiscal 2012, 12 out
of 21 analysts covering the stock have revised their estimates
upward, while only 1 has lowered it during the same time period.
This indicates a clear positive directional movement for the fiscal
year earnings.
Magnitude of Estimate
Revisions
Earnings estimates for fiscal 2011
have increased by 7 cents in the last 30 days to $6.69. With strong
first quarter 2011 results, Simon Property has increased its 2011
FFO guidance from the range of $6.45 – $6.60 per share to $6.55 –
$6.65. For fiscal 2012, earnings estimates have increased by 7
cents during the last 30 days to $7.09. Management expects fiscal
2011 to be an all-time high for the company in terms of its
earnings. Furthermore, management reiterated to continue its
aggressive yet disciplined approach to profitably grow its
business, driven by its unrivalled financial strength.
Moving Forward
The long-term earnings estimate
picture for Simon Property is optimistic. Simon Property is the
largest publicly traded retail real estate company in North America
with assets in almost all retail distribution channels.
Furthermore, the company’s international presence gives it a more
sustainable long-term growth story than its domestically focused
peers. The geographic and product diversity of the company
insulates it from market volatility to a great extent and provides
a steady source of income.
However, Simon Property’s properties
consist primarily of community shopping centers making its
performance dependent upon general economic conditions of the
market affecting retail space. Excess retail space in a number of
markets and the increase in consumer purchases through catalogs and
the Internet could hurt demand for Simon Property properties.
We maintain our ‘Neutral’ rating on
Simon Property, which currently has a Zacks #3 Rank that translates
into a short-term ‘Hold’ rating, indicating that the stock is
expected to perform in line with the overall U.S. equity market for
the next 1–3 months. We also have a ‘Neutral’ recommendation and a
Zacks #3 Rank for Macerich Co. (MAC), one of the
competitors of Simon Property.
About Earnings Estimate
Scorecard
Len Zacks, PhD in mathematics
from MIT, proved over 30 years ago that earnings estimate revisions
are the most powerful force impacting stock prices. He turned this
ground breaking discovery into two of the most celebrating stock
rating systems in use today. The Zacks Rank for stock trading in a
1 to 3 month time horizon and the Zacks Recommendation for
long-term investing (6+ months). These “Earnings Estimate
Scorecard” articles help analyze the important aspects of estimate
revisions for each stock after their quarterly earnings
announcements. Learn more about earnings estimates and our proven
stock ratings at http://www.zacks.com/education/
MACERICH CO (MAC): Free Stock Analysis Report
SIMON PROPERTY (SPG): Free Stock Analysis Report
Zacks Investment Research
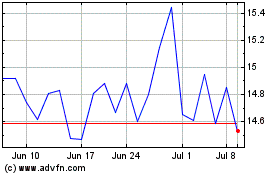
Macerich (NYSE:MAC)
Historical Stock Chart
From May 2024 to Jun 2024

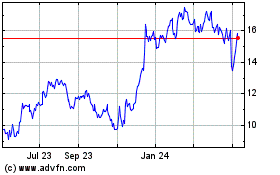
Macerich (NYSE:MAC)
Historical Stock Chart
From Jun 2023 to Jun 2024
