Lithia Motors, Inc. (NYSE: LAD) announced today that net income
from continuing operations in the first quarter of 2009 was $0.2
million or one cent per diluted share, the same as prior year.
Consolidated net income for the first quarter of 2009 was six cents
per share after inclusion of one cent per share income from
continuing operations and five cents per share income from
discontinued operations and disposal activities. In the quarter,
the Company had a net benefit from certain items of $1.5 million,
including a gain on early extinguishment of debt and a net gain on
asset sales and dispositions, partially offset by asset impairment
charges.
First quarter 2009 revenue totaled $398 million, compared to
$567 million in the year-ago period, driven primarily by lower
vehicle sales. Same store sales for new and used vehicle retail
sales declined 39.9% and 13.0% respectively, when compared to the
same quarter last year. Parts and service same-store sales declined
6.3% compared to the same quarter of last year.
Sid DeBoer, Lithia�s Chairman and CEO, commented: �We are
pleased to post a profit in the first quarter of 2009. Despite the
declining revenue base and decreasing same store sales, we were
able to improve gross margins in each of our business lines and
continue to reduce costs. As business conditions remain
challenging, we have accelerated our cost reduction program. We now
project our annualized cost savings on continuing operations to
exceed $55 million.
�We continue to strengthen our balance sheet. We were in
compliance with all debt covenants at the end of the quarter. As of
today, only $6.9 million of our convertible notes due in May 2009
remain outstanding. We have generated approximately $41 million of
cash since January 1st from financings, the sale of assets and
other activities. Our liquidity is strong, including cash and
availability on our credit facilities of approximately $52
million.
�We continue to execute the restructuring plan announced in June
2008. Of the 31 stores we identified for disposal, 20 have been
divested to date,� concluded Mr. DeBoer.
The first quarter conference call may be accessed at 2:00 p.m.
Pacific Time today by phone at 973-409-9255 Conference ID:
95124108. A playback of the conference call will be available after
5 p.m. Pacific Time April 29, 2009 through May 8, 2009 by calling
800-642-1687 access code: 95124108.
About Lithia
Lithia Motors, Inc. is a Fortune 700 Company, selling 27 brands
of new and all brands of used vehicles at 91 stores, which are
located in 13 states. Internet sales are centralized at
www.Lithia.com. Lithia also sells used vehicles; arranges finance,
warranty, and credit insurance contracts; and provides vehicle
parts, maintenance, and repair services at all of its
locations.
Additional
Information
For additional information on Lithia Motors, contact the
Investor Relations Department: 541-776-6591 or log-on to:
www.lithia.com - go to Investor Relations
Forward-Looking
Statements
This press release includes forward-looking statements within
the meaning of the �Safe-Harbor� provisions of the Private
Securities Litigation Reform Act of 1995, which management believes
are a benefit to shareholders. These statements are necessarily
subject to risk and uncertainty and actual results could differ
materially due to certain risk factors, including without
limitation, future economic conditions and others set forth from
time to time in the company�s filings with the SEC. We make
forward-looking statements about our annualized cost savings.
Specific risks in this press release include execution of the
restructuring plan and expense reductions, future interest rates
and macro-economic and market factors affecting the company�s sales
levels and profitability.
LITHIA MOTORS, INC.
(In thousands except per share
data)
Unaudited �
Three Months Ended � �
% March
31, Increase Increase 2009 �
2008
(Decrease) (Decrease) New vehicle sales $187,104
$312,358 $(125,254) (40.1) � % Used vehicle sales 124,844 155,132
(30,288) (19.5) Finance and insurance 13,462 21,463 (8,001) (37.3)
Service, body and parts 71,853 77,278 (5,425) (7.0) Fleet and other
revenues 539 913 (374) (41.0)
Total revenues 397,802
567,144 (169,342) (29.9) � � � � Cost of sales
319,620 470,205 (150,585) (32.0) Gross profit 78,182 96,939
(18,757) (19.3) SG&A expense 68,059 82,577 (14,518) (17.6)
Depreciation and amortization
4,307 4,538 (231) (5.1)
Income from operations 5,816
9,824 (4,008) (40.8) � Floorplan interest
expense (2,863) (5,062) (2,199) (43.4) Other interest expense
(3,779) (4,449) (670) (15.1) Other income, net 1,171 63 1,108
1,758.7
Income from continuing
operations before income taxes
345 376 (31) (8.2) � Income tax expense
153 154 (1) (0.6) Income tax rate 44.1% 41.0% � �
Income from
continuing operations 192 222 (30)
(13.5) � Discontinued operations:
Loss from operations, net of
income tax
(1,594) (2,383) (789) (33.1)
Gain from disposal activities, net
of income tax
2,731 - 2,731 NM
Net income (loss) $1,329
$(2,161) 3,490 161.5 �
Diluted net income
per share: Continuing operations 0.01 0.01 - - Discontinued
operations:
Loss from operations, net of
income tax
(0.08) (0.12)
Gain from disposal activities, net
of income tax
0.13 - � � Net income per share $0.06 $(0.11) $0.17 154.5 Diluted
shares outstanding 20,831 19,962 869 4.4 % �
NM � not meaningful
Lithia Motors, Inc.
(Continuing Operations)
�
Three Months Ended �
�
�
% �
Unaudited March 31,
�
Increase
Increase 2009 � �
2008
�
(Decrease)
(Decrease)
Unit sales:
New vehicle 6,243 10,542 (4,299) (40.8) % Used - retail vehicle
7,055 7,105
(50)
(0.7) Used - wholesale 3,077 4,660 (1,583) (34.0) Total units sold
16,375 22,307 (5,932) (26.6) �
Average selling price:
New vehicle $ 29,970 $ 29,630 $ 340 1.1 % Used - retail vehicle
15,392 17,496 (2,104) (12.0) Used - wholesale 5,283 6,614 (1,331)
(20.1) �
Gross margin/profit data
New vehicle retail 8.7 % 7.8 % 90 bps Used vehicle retail 12.4 %
12.0 % 40 bps Used vehicle wholesale 2.3 % (1.2) % 350 bps Service,
body & parts 47.7 % 46.9 % 80 bps Finance & insurance 100.0
% 100.0 % - Gross profit margin 19.7 % 17.1 % 260 bps New retail
gross profit/unit $2,604 $2,312 $292 Used retail gross profit/unit
1,916 2,095 (179) Used wholesale gross profit/unit 120 (83) 203
Finance & insurance/retail unit 1,012 1,216 (204) �
Revenue mix:
New vehicles 47.0 % 55.1 % Used retail vehicles 27.3 % 21.9 % Used
wholesale vehicles 4.1 % 5.4 % Finance and insurance, net 3.4 % 3.8
% Service and parts 18.1 % 13.6 % Fleet and other 0.1 % 0.2 %
Lithia Motors, Inc.
(Brand Mix)
�
Three Months Ended Unaudited March 31,
2009 �
2008
New vehicle unit sales brand mix � continuing
operations:
� � Chrysler Brands 33.8 % 33.5 % General Motors & Saturn 16.0
% 18.9 % Toyota 13.9 % 14.5 % Honda 8.9 % 8.5 % Ford 5.0 % 4.8 %
BMW 5.0 % 4.4 % Hyundai 3.7 % 2.7 % Nissan 3.3 % 4.8 % Volkswagen,
Audi 3.8 % 3.0 % Subaru 4.2 % 2.4 % Mercedes 0.6 % 0.5 % Other 1.8
% 2.0 % �
New vehicle unit sales brand mix � including
discontinued operations:
Chrysler Brands 36.7 % 38.4 % General Motors & Saturn 14.9 %
17.1 % Toyota 14.1 % 14.4 % Honda 7.9 % 6.9 % Ford 4.9 % 4.9 % BMW
4.5 % 3.6 % Hyundai 4.1 % 3.1 % Nissan 2.9 % 4.0 % Volkswagen, Audi
3.4 % 2.5 % Subaru 4.1 % 2.4 % Mercedes 1.0 % 1.2 % Other 1.5 % 1.5
%
LITHIA MOTORS, INC.
(Selected Same Store
Data)
Unaudited
�
Three Months Ended
March 31,
2009
�
2008
Same store total sales geographic
mix:
� � Texas 24.3 % 29.1 % Oregon 16.1 % 14.8 % California 11.1 % 11.1
% Alaska 9.8 % 7.9 % Washington 8.7 % 8.9 % Iowa 7.0 % 7.0 %
Montana 7.3 % 6.8 % Idaho 7.5 % 6.8 % Nevada 4.9 % 4.4 % Colorado
1.9 % 1.8 % Nebraska 1.4 % 1.4 % �
Same store revenue:
New vehicle retail sales (39.9) % (12.9) % Chrysler Brands (39.7) %
(16.7) % General Motors & Saturn (47.6) % (5.6) % Toyota (44.5)
% 4.2 % All other brands (33.4) % (18.7) % Used vehicle retail
sales (13.0) % (9.3) % Used wholesale sales (48.1) % (8.0) % Total
vehicle sales (excluding fleet) (33.2) % (11.7) % Finance &
insurance sales (33.0) % (11.7) % Service, body and parts sales
(6.3) % 3.5 % Total sales (excluding fleet) (29.5) % (9.9) % Total
gross profit (excluding fleet) (17.9) % (14.1) %
LITHIA MOTORS, INC.
Balance Sheet Highlights (Dollars in Thousands)
Unaudited �
March 31, 2009 �
December 31, 2008
Cash & cash equivalents $9,104 $10,874 Trade receivables*
60,031 69,615 Inventory 391,959 422,812 Assets held for sale
139,603 161,423 Other current assets 10,331 31,828
Total current
assets 611,028 696,552 � Real estate, net 284,875
284,088 Equipment & other, net 59,238 62,188 Other assets
93,144 90,631
Total assets $1,048,285
$1,133,459 � Flooring notes payable $264,901 $337,700
Liabilities related to assets held for sale 89,162 108,172 Current
maturities of senior subordinated convertible notes 39,300
42,500
Other current liabilities
110,746
108,656
Total current liabilities
504,109
597,028 � Real estate debt 171,239 163,708 Other long-term
debt 87,683 101,476 Other liabilities
33,664
22,904
Total liabilities $796,695 $885,116 �
Shareholders' equity 251,590 248,343 � �
Total liabilities &
shareholders' equity $1,048,285 $1,133,459 �
*Note: Includes contracts-in-transit of $23,589 and $27,799 for
2009 and 2008 �
Other balance sheet data
Lt debt/total cap (excludes real estate) 26% 29% Book value per
basic share 12.12 12.30 �
Debt covenant ratios
Requirement
As of March 31, 2009
Minimum net worth Not less than $175 million $252 million Fixed
charge coverage ratio Not less than 1.0 to 1 1.30 to 1 Cash flow
leverage ratio Not more than 3.0 to 1 2.48 to 1 Minimum current
ratio Not less than 1.2 to 1 1.32 to 1
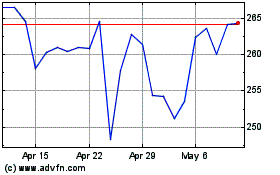
Lithia Motors (NYSE:LAD)
Historical Stock Chart
From Jun 2024 to Jul 2024

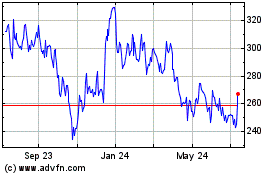
Lithia Motors (NYSE:LAD)
Historical Stock Chart
From Jul 2023 to Jul 2024
