Dillard's Posts Flat January Comps - Analyst Blog
February 07 2012 - 12:07PM
Zacks
Fashion apparel, cosmetics and home furnishings retailer
Dillard’s Inc. (DDS) reported total sales decline
of 1% while comparable store sales remained flat year over year for
the 27-day period ending on January 28, 2012. Total sales for
the period plummeted to $363.5 million versus $366.4 million
recorded in the comparable period last year.
Geographically, sales for the 27-day period dropped due to
marginally below trend in the western region as well as
significantly below trend in Central region. However, the company’s
Eastern region performance was flat year over year.
Product-wise, sales trends for shoes and home and furniture
categories lived up to the company’s expectations in the 27-day
period. However, sales for men’s apparel and accessories
significantly missed expectations.
Fourth-Quarter 2011 Sales
Performance
Dillard’s total sales for the 13 week-period ended January 28,
2012 inched up 2% to $1,951.5 million compared with $1,914.6
million in the year-ago period. Comparable sales for the same
period registered a year-over-year growth of 3%.
Fiscal 2011 Sales
Performance
For the 52 weeks ended January 28, 2012, the company’s sales
totaled $6,199.0 million, registering an increase of 3% from total
sales of $6,020.3 million reported in the same period last year.
Comparable store sales increased 4% for the 52-week period ended
January 28, 2012.
This month’s performance has broken Dillard’s run of positive
comps and sales growth since April 2011. Moreover, the company has
also registered positive comparable and total sales growth in every
quarter of fiscal 2011.
On the back of 2% growth in comparable sales for the first
quarter of fiscal 2011, Dillard’s earnings doubled to $1.31 per
share. Similarly, the company’s earnings reached 32 cents per share
for second-quarter 2011, on the heels of 6% rise in comparable
sales. The trend continued in the third quarter as well as earnings
more than doubled to 50 cents per share primarily driven by a rise
of 5% in comparable sales.
Peer Performance
Dillard’s operates its retail merchandise business under highly
competitive conditions. Despite being a large regional department
store, the company has many competitors at the national level, who
compete with the individual stores, including specialty, off-price,
discount and Internet and mail-order retailers.
Among the company’s peers, Kohl’s Corporation
(KSS) reported a marginal comparable sales growth of 0.6%, while
net sales inched up 2.4% to $844 million during the five-week
period ended January 28, 2012. Dillard’s another competitor
Ross Stores Inc.’s (ROST) comparable sales grew 5%
and total sales surged 10% to $483 million compared with $441
million in prior-year period.
Our Take
We believe that the company’s sales will improve in near term
given its increased focus on online business. Dillard’s has
recently made a huge investment of $4 million in Acumen Brands, a
Fayetteville, Arkansas-based ecommerce company.
As per the deal, Acumen Brands will provide technological
marketing services which will boost Dillard’s brand online.
Further, the company has also announced to open a new Internet
Fulfillment Center in Maumelle, Arkansas, in spring 2012.
We believe that the company benefits from its improvements in
inventory management, focusing on more conservative purchasing and
efforts to better match the timing of receipts with demand,
ultimately resulting in reduced markdowns.
Dillard’s has recently taken a revolutionary step to boost its
liquidity position by forming a real estate investment trust
company, which will open the avenues for debt and equity markets.
Moreover, the company has also formed a wholly-owned captive
insurance company, which we believe will enable it to manage its
risks more efficiently while providing access to more reinsurance
markets.
Dillard's shares maintain a Zacks #3 Rank, which translates into
a short-term Hold rating. Our long-term recommendation on the stock
remains Outperform.
DILLARDS INC-A (DDS): Free Stock Analysis Report
KOHLS CORP (KSS): Free Stock Analysis Report
ROSS STORES (ROST): Free Stock Analysis Report
To read this article on Zacks.com click here.
Zacks Investment Research
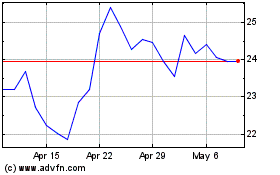
Kohls (NYSE:KSS)
Historical Stock Chart
From May 2024 to Jun 2024

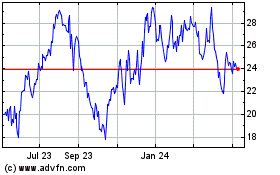
Kohls (NYSE:KSS)
Historical Stock Chart
From Jun 2023 to Jun 2024
