Crude Supplies Surge, Fuels Drop - Analyst Blog
March 15 2012 - 12:25PM
Zacks
The U.S. Energy Department's weekly inventory release showed
that crude stockpiles rose to their highest level since September
2011, as supplies at the Cushing Storage Hub soared. However, the
agency’s report also revealed that both gasoline and distillate
stocks declined over the week on demand recovery. Meanwhile,
refinery utilization rate reflected a decrease of 1.2%.
The Energy Information Administration ("EIA") Petroleum Status
Report – which contains data for the previous week ending Friday,
outlines information regarding the weekly change in petroleum
inventories held and produced by the U.S., both locally and
abroad.
The report provides an overview of the level of reserves and
their movements, thereby helping investors understand the
demand/supply dynamics of petroleum products. It is an indicator of
current oil prices and volatility that affect businesses of
companies engaged in the oil and refining industry, such as
ExxonMobil Corp. (XOM), Chevron
Corp. (CVX), ConocoPhillips (COP),
Valero Energy Corp. (VLO) and Tesoro
Corp. (TSO).
Analysis of the Data
Crude Oil: The federal government’s EIA report
revealed that crude inventories climbed by 1.75 million barrels for
the week ending March 9, 2012, after rising by a modest 832,000
barrels the week before.
Analysts surveyed by Platts, the energy information arm of
McGraw-Hill Companies Inc. (MHP), had expected oil
stocks to go up some 2.1 million barrels. Surging inventories at
Cushing and lower refinery utilization rates led to the stockpile
buildup with the world's biggest oil consumer.
In particular, crude inventories at the Cushing terminal in
Oklahoma – the key delivery hub for U.S. crude futures traded on
the New York Mercantile exchange – jumped by 2.52 million barrels
from previous week’s level to 38.70 million barrels, the most since
the week ending June 3, 2011. Stocks reached an all-time high of
41.90 million barrels in April last year.
At 347.50 million barrels, current crude supplies are 0.9% below
the year-earlier level, but are in the upper limit of the average
for this time of the year. The crude supply cover was up from 23.5
days in the previous week to 23.7 days. In the year-ago period, the
supply cover was 25.3 days.
Gasoline: Supplies of gasoline decreased for
the fourth consecutive week as domestic consumption rose 1.9% to
8.42 million barrels a day and imports dropped. These factors were
partially offset by higher production.
The 1.41 million barrels dip – same as projections – took
gasoline stockpiles down to 228.12 million barrels. The existing
inventory level of the most widely used petroleum product is 1.4%
above the year-earlier levels and is in the upper limit of the
average range.
Distillate: Distillate fuel inventories
(including diesel and heating oil) plunged by 4.68 million barrels
last week, well above analyst expectations for a 1.5 million
barrels decrease. The fall in distillate fuel supplies – for the
fifth consecutive week – could be attributed to stronger demand and
lower output.
At 134.81 million barrels, distillate supplies are 11.7% below
the year-ago level and are in the middle of the average range for
this time of the year.
Refinery Rates: Refinery utilization was down
1.2% from the prior week at 82.7%. Analysts were expecting the
refinery run rate to decline 0.2% to 83.7%.
CONOCOPHILLIPS (COP): Free Stock Analysis Report
CHEVRON CORP (CVX): Free Stock Analysis Report
MCGRAW-HILL COS (MHP): Free Stock Analysis Report
TESORO CORP (TSO): Free Stock Analysis Report
VALERO ENERGY (VLO): Free Stock Analysis Report
EXXON MOBIL CRP (XOM): Free Stock Analysis Report
To read this article on Zacks.com click here.
Zacks Investment Research
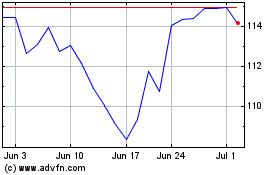
Exxon Mobil (NYSE:XOM)
Historical Stock Chart
From Jun 2024 to Jul 2024

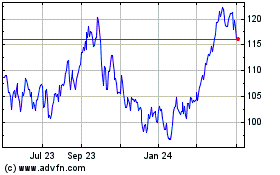
Exxon Mobil (NYSE:XOM)
Historical Stock Chart
From Jul 2023 to Jul 2024
