First Horizon National Corp.’s (FHN)
fourth-quarter 2011 earnings of 13 cents per share came a penny
below the Zacks Consensus Estimate. However, results compared
favorably with operating earnings of 12 cents per share in the
prior quarter and a loss of 19 cents per share in the year-ago
quarter.
Results reflected subdued top-line figures. However, a decrease
in provision for loan losses as well as expenses was on the
upside.
First Horizon’s reported full-year 2011 operating earnings per
share of 47 cents, compared with a loss of 20 cents in 2010. Full
year 2011 earnings per share missed the Zacks Consensus Estimate by
4 cents.
First Horizon’s fourth-quarter 2011 net income available to
common shareholders was $34.9 million compared with $36.1 million
in the prior quarter and a loss of $48.7 million in the year-ago
quarter. The year-ago figure reflected preferred dividend
payments.
For full year 2011, First Horizon reported net income available
to common shareholders of $131.2 million, compared with a loss of
$57.8 million in 2010.
The company reported revenue was $360.1 million, slightly
missing the Zacks Consensus Estimate of $361 million. The revenue
figure also reported a 9% sequential decrease and a 7%
year-over-year drop.
For full year 2011, First Horizon’s revenue came in at $1.49
billion, down 11% year-over-year but slightly above the Zacks
Consensus Estimate of $1.46 billion.
Provision for loan losses was $10.0 million, down a whooping 69%
sequentially and 78% year over year.
Quarter in Detail
The sequential revenue decrease of 9% at First Horizon was due
to a 3% fall in non-interest income and decrease in net securities
gains, partly offset by a 1% rise in net interest income. Moreover,
the 7% year-over-year drop in revenue was due to a 4% decrease in
non-interest income and a 2% fall in net interest income as well as
lower net securities gains.
Net interest margin of 3.23% was flat sequentially and up 5
basis points year over year. Period-end loans were up 1%
sequentially but down 2% year over year. Moreover, total deposits
advanced 3% sequentially and 7% year over year.
Non-interest expense decreased 3% sequentially and 5% year over
year to $312.0 million. The company reported a decline across most
of the expense categories.
Credit Quality
Credit quality at First Horizon improved in the quarter.
Allowance for loan losses and non-performing assets were down both
sequentially and year over year.
Allowance for loan losses were down 15% sequentially and 42%
year over year at $384.4 million. As a percentage of period-end
loans on an annualized basis, allowance for loan losses were 2.34%,
down 43 basis points (bps) from the prior quarter and 162 bps year
over year.
Non-performing assets decreased 11% sequentially and 38% year
over year to $521.2 million. As a percentage of period-end loans
plus foreclosed real estate and other assets, non-performing assets
were 2.57%, down 45 bps sequentially and 191 bps year over
year.
Evaluation of Capital
First Horizon’s capital ratios were mixed in the quarter. Tier 1
capital ratio decreased to 14.16% from 14.44% reported in the prior
quarter. However, tangible common equity ratio increased 5 bps
sequentially to 9.05%. Book value came in at $9.28 per share,
slightly down from $9.29 per share reported in the prior
quarter.
Capital Deployment Update
Concurrent with its third quarter earnings release, First
Horizon launched a repurchase program of $100 million of its common
stock in the open market or in privately negotiated transactions,
subject to market conditions, by the end of August 2012. In the
fourth quarter, the company used $44 million to buy back stock
under its repurchase program.
Simultaneous with its fourth quarter earnings release, First
Horizon's Board of Directors has approved payment of a quarterly
cash dividend on its common stock of 1 cent per share. The dividend
is payable on April 1, 2012, to the common shareholders of record
on March 16, 2012.
Our Take
Going forward, we believe that First Horizon’s efforts to reduce
its exposure to problem loans, control costs, boost capital levels
and improve long-term profitability by focusing on growing its core
Tennessee banking franchise are encouraging. Capital deployment
initiatives are impressive.
Yet, though the wind-down of the non-strategic part of the
loan portfolio augurs well, it will remain a drag on the
company's earnings going forward. A shrinking revenue base and
regulatory issues remain our concern. Moreover, a sluggish economic
recovery coupled with a low interest rate environment and mortgage
exposure serves as headwind for the company’s results.
Among First Horizon’s peers,Regions Financial
Corporation (RF) will be releasing its fourth-quarter 2011
earnings on January 24, while Popular Inc. (BPOP)
will be releasing on January 25.
First Horizon retains its Zacks #2 Rank, which translates into a
short-term ‘Buy’ rating. However, considering the fundamentals, we
maintain long-term Neutral recommendation on the stock.
POPULAR INC (BPOP): Free Stock Analysis Report
FIRST HRZN NATL (FHN): Free Stock Analysis Report
REGIONS FINL CP (RF): Free Stock Analysis Report
To read this article on Zacks.com click here.
Zacks Investment Research
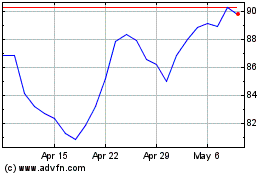
Popular (NASDAQ:BPOP)
Historical Stock Chart
From Jun 2024 to Jul 2024

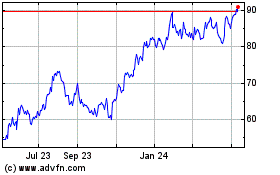
Popular (NASDAQ:BPOP)
Historical Stock Chart
From Jul 2023 to Jul 2024
