Life Meets EPS, Misses Revs - Analyst Blog
April 27 2011 - 2:34PM
Zacks
Life Technologies Corporation (LIFE) reported
an EPS of 50 cents in the first quarter of 2011 compared to 48
cents in the year-ago period. However, after adjusting for certain
one-time items, the EPS was 85 cents, in line with the Zacks
Consensus Estimate,but down 2.3% compared to 87 cents in the
year-ago quarter.
Revenues increased 1% year over year to $897 million, missing
the Zacks Consensus Estimate of $920 million. While foreign
exchange movement had a negative impact of 1 point, prior
acquisitions and divestitures contributed approximately 2 points to
the reported revenue growth.
Organic revenue growth for the quarter was flat due to difficult
year over year comparisons and the recent disaster in Japan.
Excluding these items, organic growth for the quarter was 5%.
On a geographical basis, barring Japan where revenues declined
16% compared to the first quarter of fiscal 2010, revenue growth
was witnessed across all other regions: Europe – 2%, Asia-Pacific –
7% and the Americas – 1%.
Adjusted gross margin during the quarter was 66.3%, down
200 basis points (bps) from the year-ago quarter due to the
negative impact from currency and mix partially offset by the
positive impact of price. Moreover, operating margin (adjusted) was
28.2% in the reported quarter, 130 bps lower than the prior year
quarter due to lower gross margins, partially offset by lower
operating expenses.
Operating expenses were $342 million compared to $343.4 million
in the year-ago quarter due to a 2.8% decline in selling, general
and administrative expenses to $250.5 million, though research and
development expenses increased 6.7% to $91.5 million.
Although revenues increased 1% during the quarter, EPS dropped
by 2.3% due to lower margins, higher interest expense (up 13.4% to
$34.4 million), a 34% fall in interest income, partially offset by
lower effective tax rate (27.6% versus 30%) and a 1.9% decline in
share count.
Life Technologies exited the quarter with $735.2 million in the
form of cash and short-term investments, lower than $854.8 million
at the end of December 2010.
Segments
Life Technologies earns revenues primarily from three divisions
– Molecular Biology Systems, Genetic Systems and Cell Systems,
which recorded adjusted revenues of $426 million (down 1% compared
to the year-ago quarter), $228 million (down 4%) and $238 million
(up 11%), respectively.
The strong growth for the Cell Systems division was a result of
strong demand across the portfolio, led by double-digit growth in
the Beads Based Separation and BioProduction businesses.
However, in case of Molecular Biology systems, strong demand for
TaqMan assay products was offset by the PCR and Molecular Biology
Reagents businesses, both of which faced difficult year-over-year
comparisons. Moreover, revenue of Genetic Systems declined
primarily due to delayed shipment of the new 5500 sequencer owing
to the Japan disaster.
Guidance
Life Technologies reiterated its outlook for 2011. The company
expects its organic revenues to grow in mid-single digits resulting
in an adjusted EPS of $3.80–$3.95.
Recommendation
Life Technologies enjoys a strong position in the life sciences
market. During the quarter the company was affected by the recent
disaster in Japan and difficult year-over-year comparisons.
However, we believe new product launches and focus on emerging
markets will help drive revenues going forward.
Moreover, the situation in Japan is expected to improve
gradually. However, the company could face challenges such as
increased competition from players like, Thermo Fisher
Scientific (TMO), Illumina (ILMN) among
others and unfavorable currency movement.
We are currently Neutral on the stock, which also corresponds to
the Zacks #3 Rank (Hold) in the short term.
ILLUMINA INC (ILMN): Free Stock Analysis Report
LIFE TECHNOLOGS (LIFE): Free Stock Analysis Report
THERMO FISHER (TMO): Free Stock Analysis Report
Zacks Investment Research
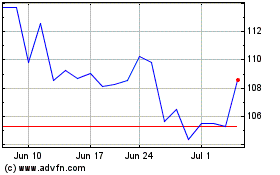
Illumina (NASDAQ:ILMN)
Historical Stock Chart
From Oct 2024 to Nov 2024

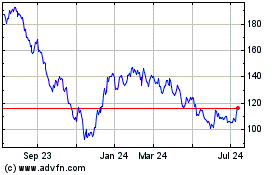
Illumina (NASDAQ:ILMN)
Historical Stock Chart
From Nov 2023 to Nov 2024
